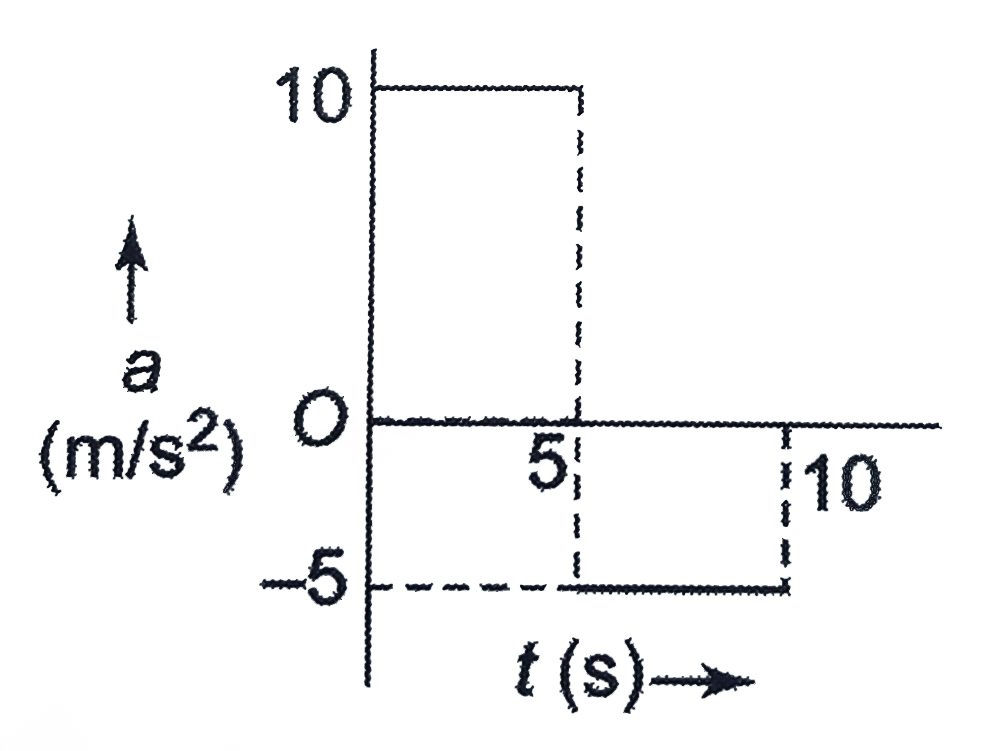
Draw graphs of the speeds and path lengths as functions of time if the graph of acceleration is as shown below . The initial speed is zero .
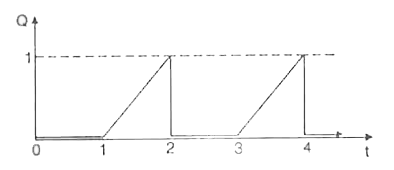
Step by step video & image solution for Draw graphs of the speeds and path lengths as functions of time if the graph of acceleration is as shown below . The initial speed is zero . by Physics experts to help you in doubts & scoring excellent marks in Class 11 exams.
Topper's Solved these Questions
Similar Questions
Knowledge Check
- Question 1 - Select One
The displacement-time graph of a particle is as shown below. It indicates that
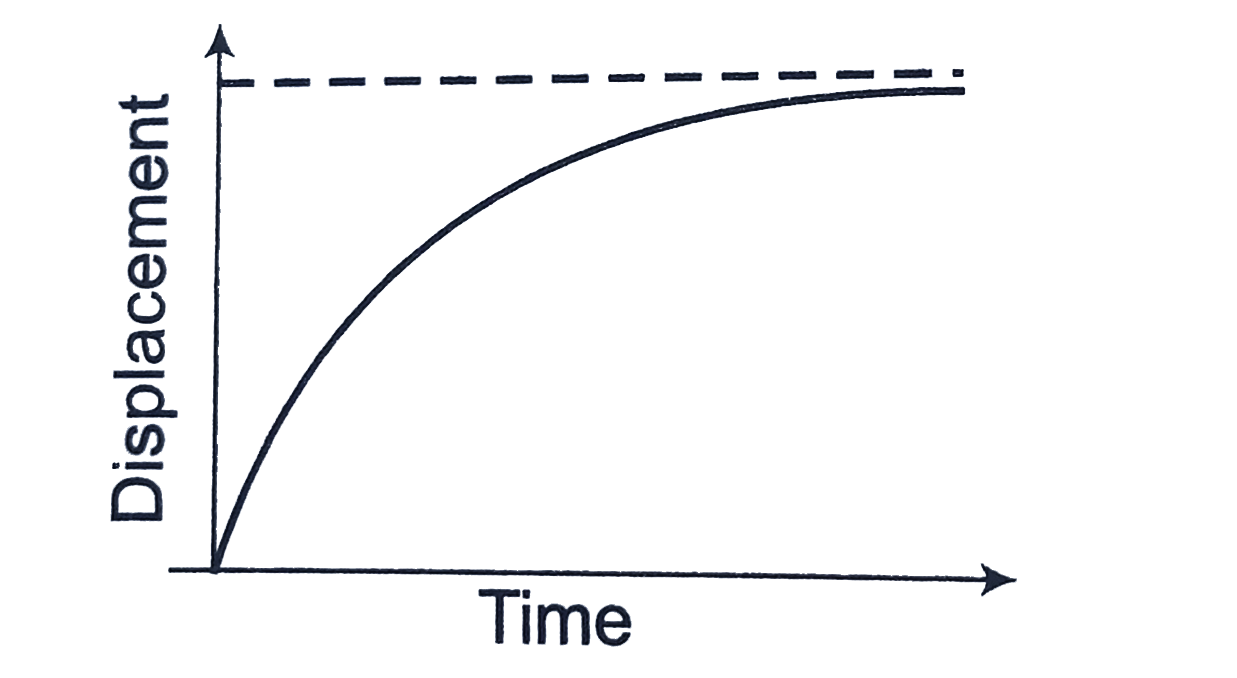 Athe particle starts with a certain velocity but the motion is retarded and finally the particle stopsBthe velocity of the particle is constant throufgoutCthe acceleration of the particle is constant throughoutDthe particle starts with a velocity, the motion is accelerated and finally the particle moves with a constant velocity
 - Question 2 - Select One
Position-time graph for motion with zero acceleration is
A B
B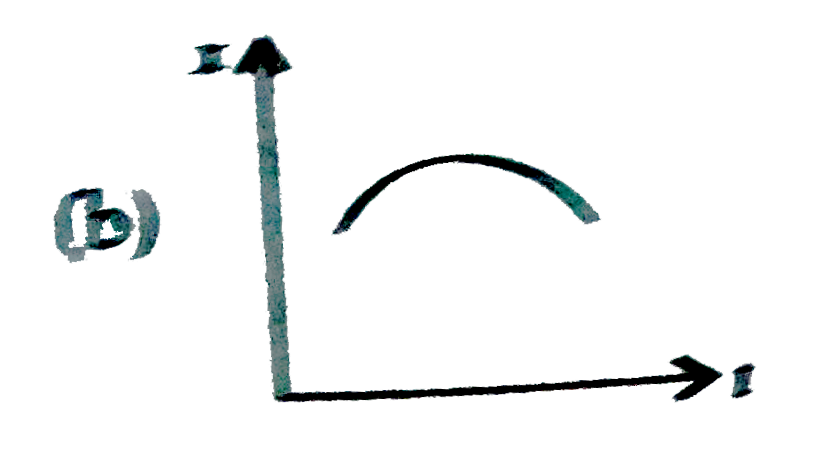 C
C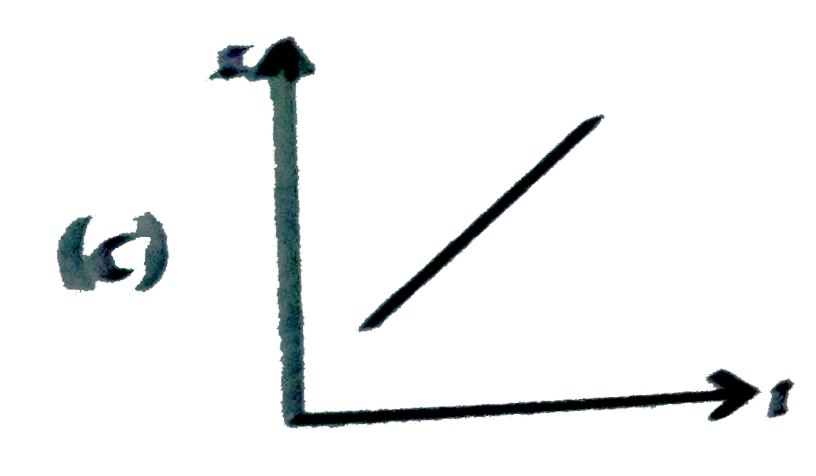 D
D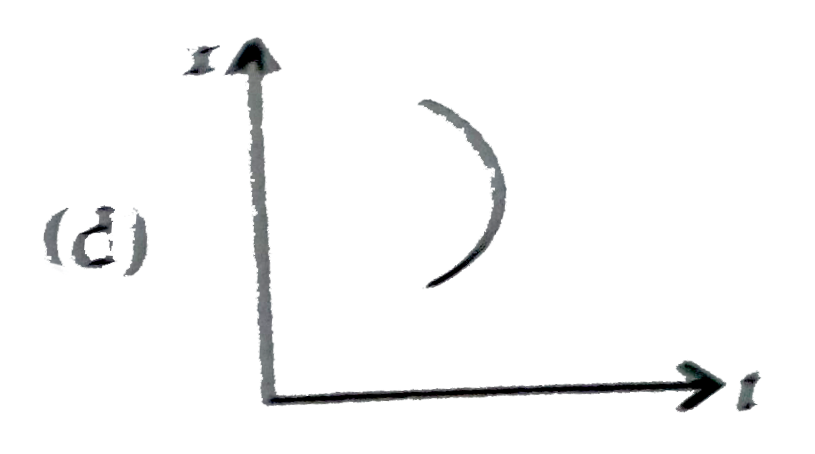
- Question 3 - Select One or More
Which of the graphs shown below represent the motion with uniform speed?
A B
B C
C D
D
The velocity-time graph of an object is shown below. The acceleration of the object is
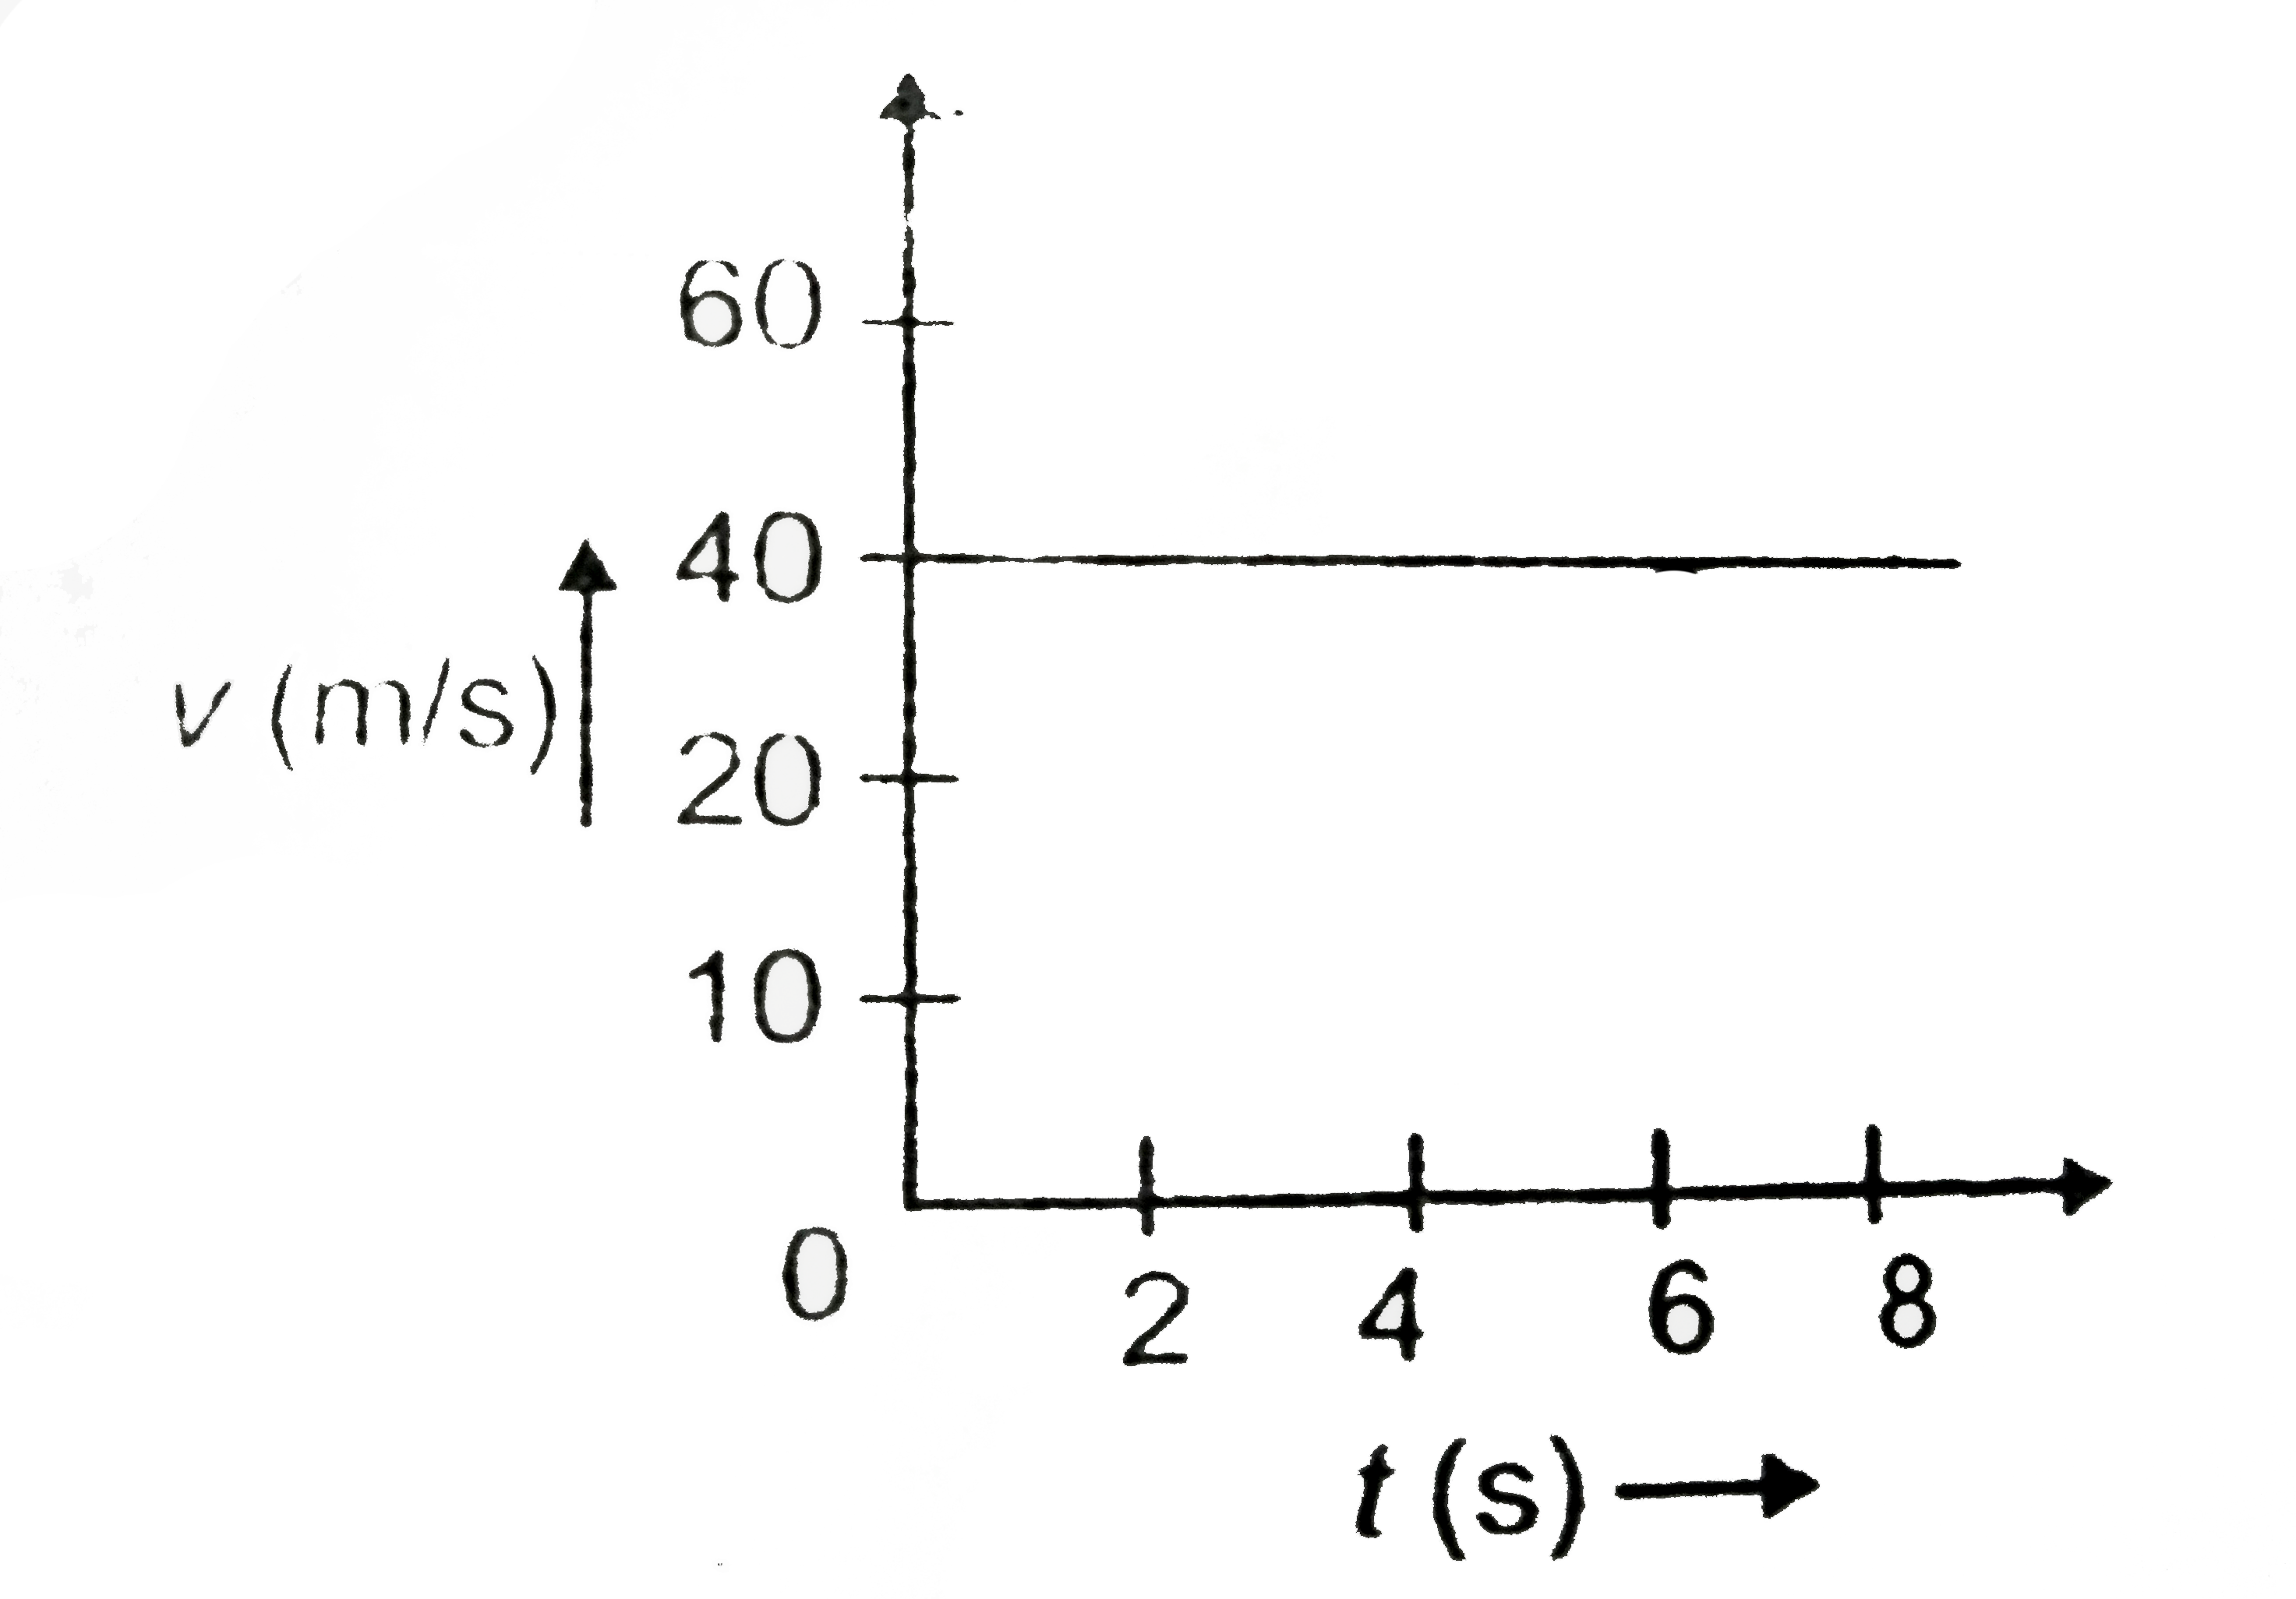 View Solution
The acceleration-time graph of a patticle moving in a straight line is as shown below. Sketch the v-t graph. The initial velocity of the particle is zero.
 View Solution
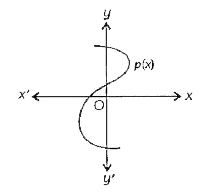
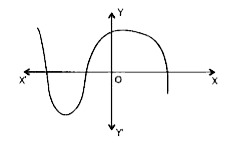
How many zeros are there of the polynomial whose graph is shown below?
 View Solution
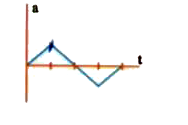
The acceleration time graph of a body is shown below the most probable velocity time graph of the body isView SolutionWhich of the following v Vs t graph are correct representation for the acceleration Vs time graph shown below
 View Solution


