For an ideal gas, under isobaric condition, a graph between log V vs log T :
is linear with unit slope
represents Boyle’s Law
represents Charle’s Law
represents Gay-Lussac’s Law
The correct Answer is:A, C
To solve the question regarding the graph between log V vs log T for an ideal gas under isobaric conditions, we can follow these steps:
1. Understand the Conditions: We are dealing with an ideal gas under isobaric conditions, which means the pressure (P) is constant.
2. Apply Charles's Law: According to Charles's Law, for an ideal gas at constant pressure, the volume (V) of the gas is directly proportional to its absolute temperature (T). This can be expressed mathematically as:
V∝TorV=kT
where k is a constant.
3. Take the Logarithm: To analyze the relationship in logarithmic terms, we take the logarithm of both sides:
logV=log(kT)
4. Use Logarithmic Properties: Using the property of logarithms that states log(ab)=loga+logb, we can rewrite the equation:
logV=logk+logT
5. Identify the Graph Components: In this equation, logV is on the y-axis and logT is on the x-axis. This can be rearranged to the form of a straight line:
logV=logk+1⋅logT
Here, the slope (m) is 1 and the y-intercept (c) is logk.
6. Conclusion about the Graph: Since the relationship is linear, we conclude that the graph of logV versus logT will be a straight line with a slope of 1.
Final Answer:
The graph between log V vs log T for an ideal gas under isobaric conditions is a linear graph with a unit slope.
V∝TorV=kT
where k is a constant.
logV=log(kT)
logV=logk+logT
logV=logk+1⋅logT
Here, the slope (m) is 1 and the y-intercept (c) is logk.
The graph between log V vs log T for an ideal gas under isobaric conditions is a linear graph with a unit slope.
Similar Questions
Knowledge Check
In the given isobaric process shown by graph between T and V.
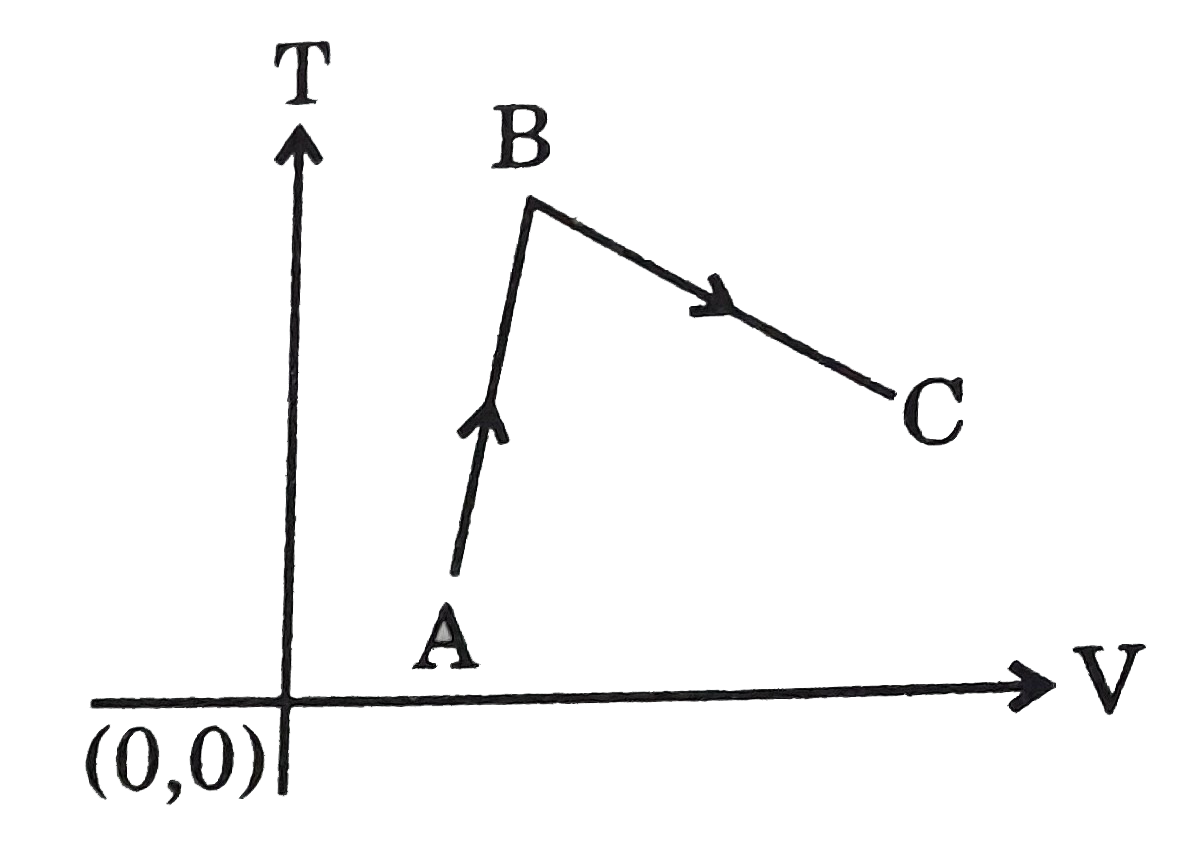 AMoles decreases throughoutBMoles first increases then deceasesCMoles first decreases then increasesDMoles cannot be predicted form given data
For a given mass of gas isobar is the graph drawn between
AP and volume at constant TBT and P at constant VCT and V at constant PDP and 1V at constant TIf the rate of emission of radiation by a body at temperature TK is E then graph between log E and log T will be .
A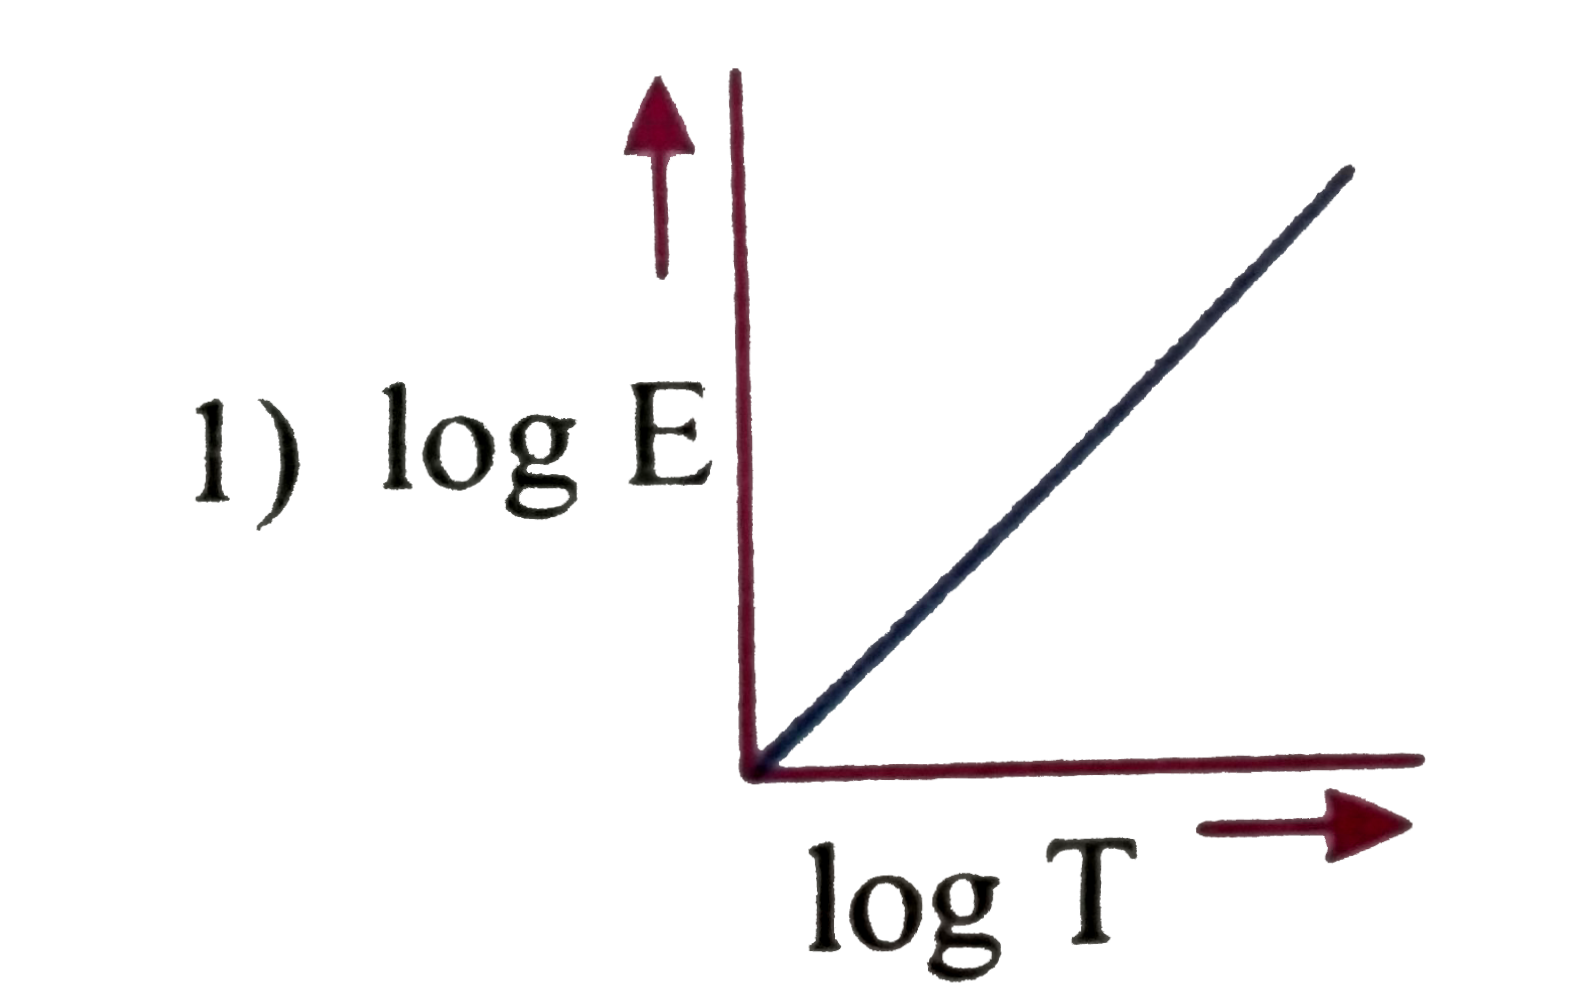 B
B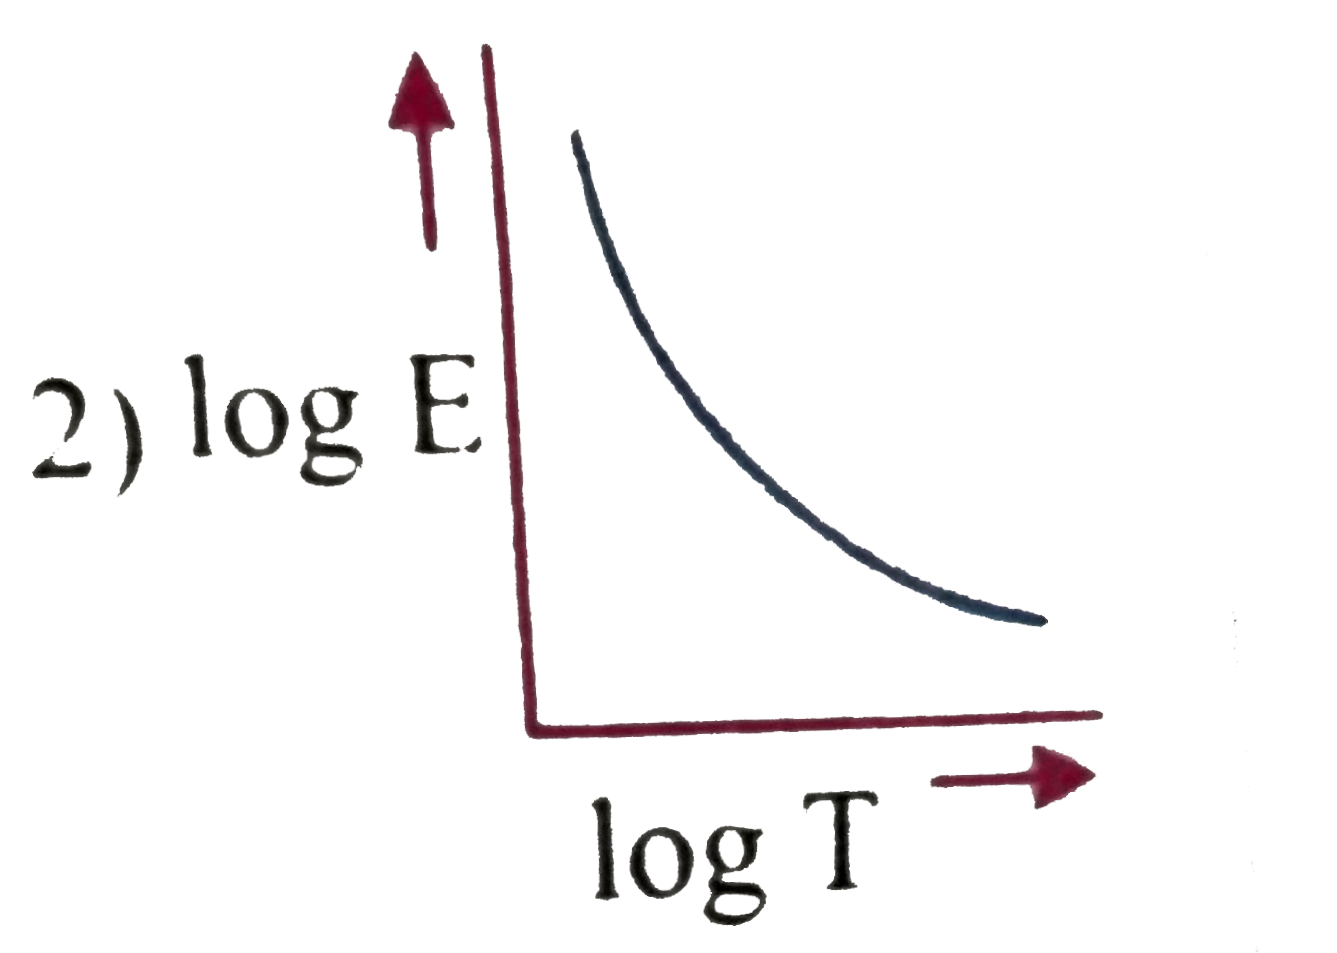 C
C D
D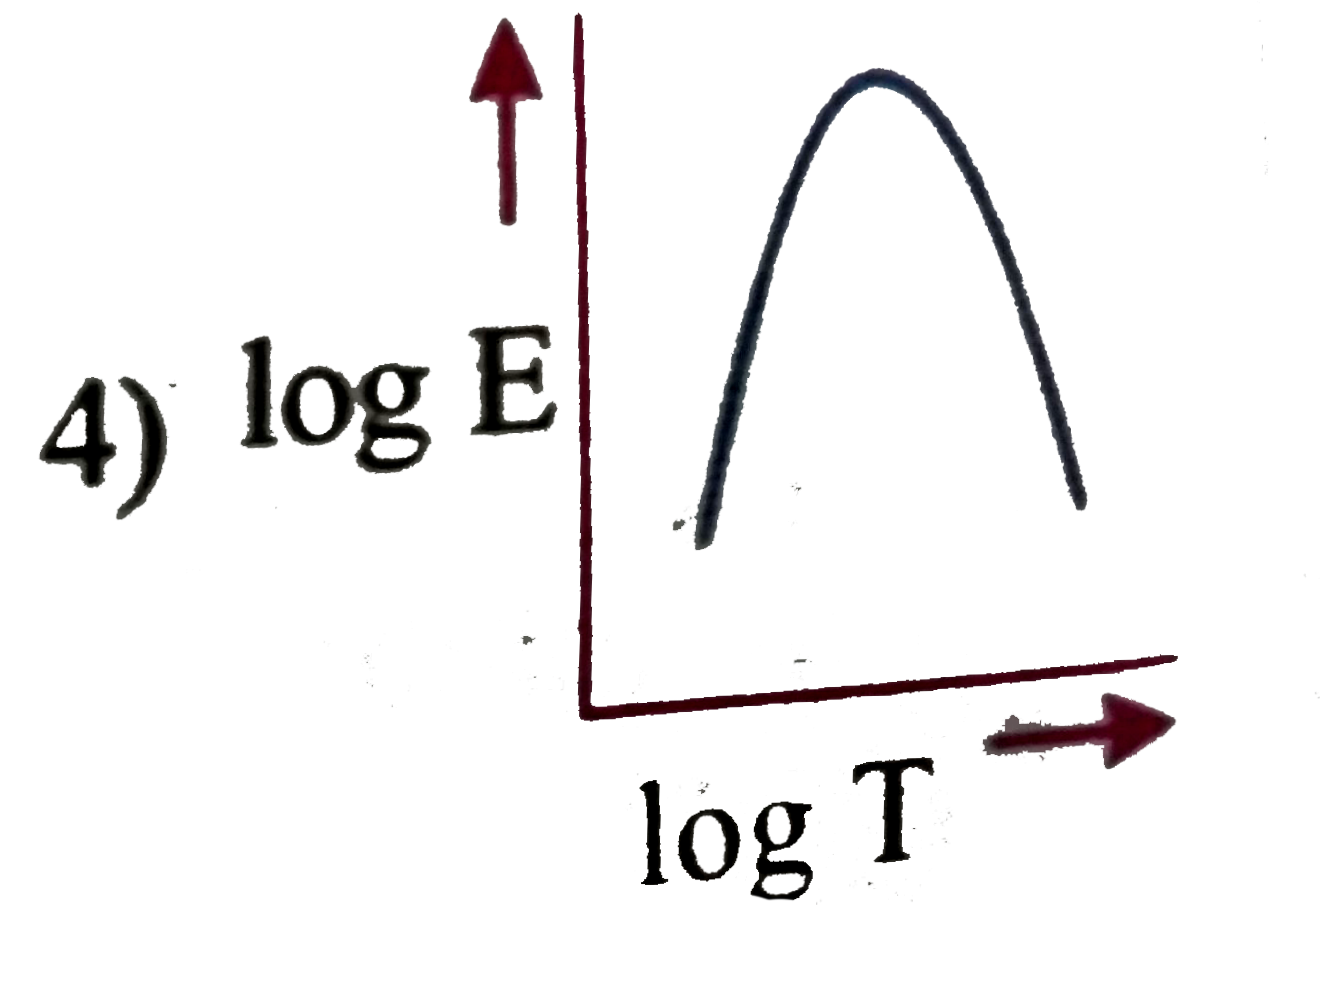
The frequency of revolution of electron in nth Bohr orbit is vn .The graph between logn and log(vnv1) may be
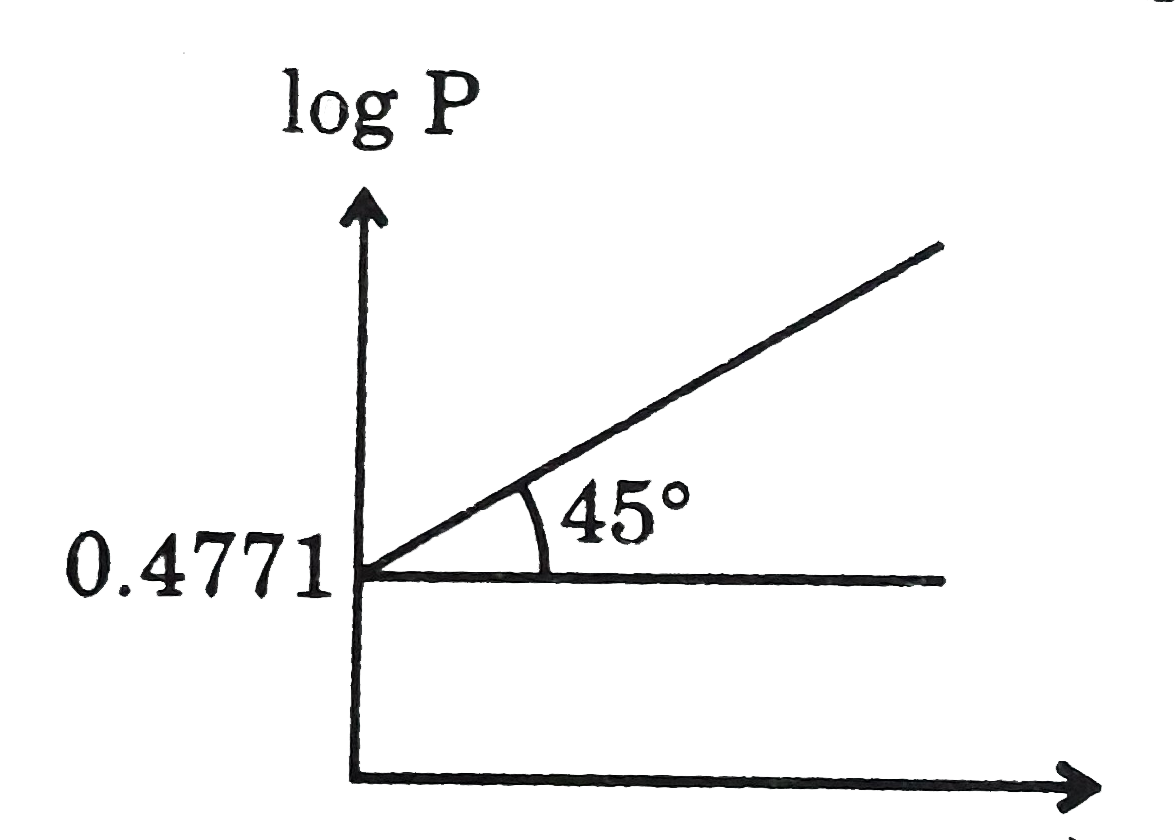
View SolutionFor an ideal gas kept in a container attached manometer as show. Find volume of container. For the given gas, lo P us log (1/V) graph is given :
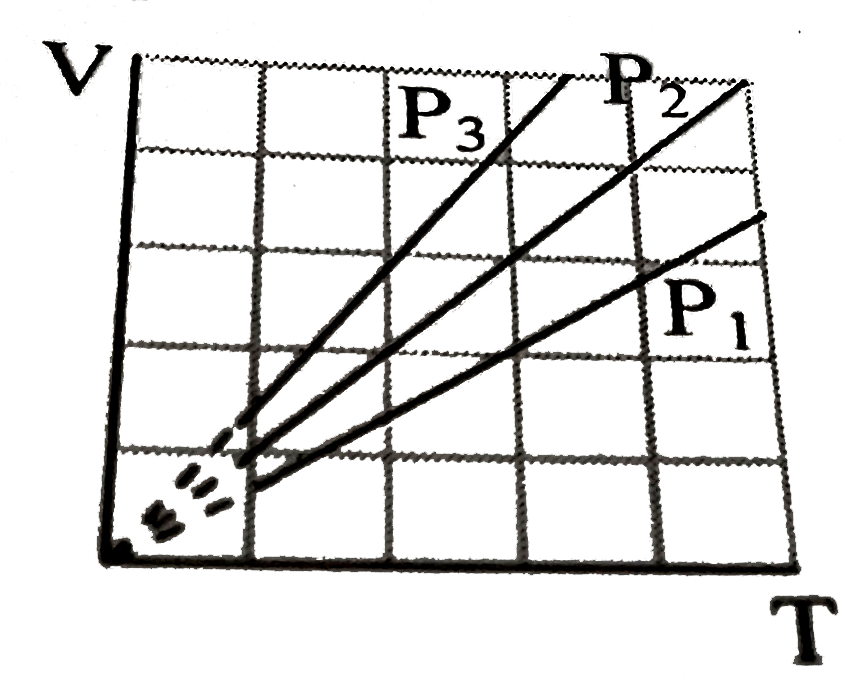
View SolutionThe state of an ideal gas was changed isobarically. The graph depicts three such isobaric lines. Which of the following is true about the pressures of the gas ?
View SolutionWhich conclusion can be drawn if a graph is plotted between log t50% vs. log [reactant] if it show an intercept 'A' and tanθ=0?
View SolutionFor 1 mol ofan ideal gas at a constant temperature T, the plot of (log P) against (log V) is a (P: Pressure, V: Volume)
View Solution
