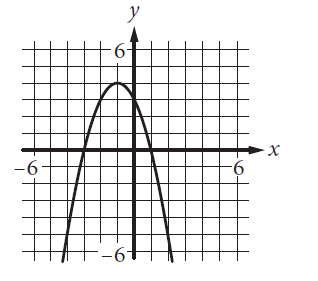
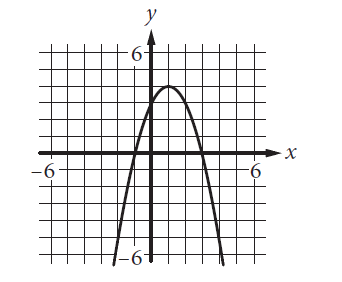
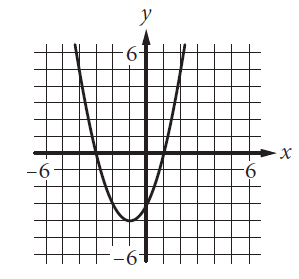
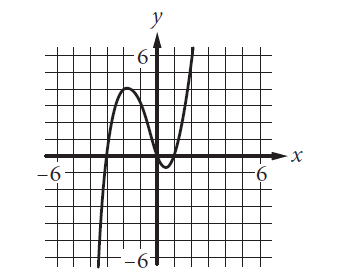
The range of the polynomial function f is the set of real numbers less than or equal to 4. If the zeros of f are −3 and 1, which of the following could be the graph of y = f (x) in the xy-plane?
A
B
C
D
Video Solution
Text Solution
The correct Answer is:A
Since zeros of f correspond to the x-intercepts of the graph of f, and the range of f gives all the possible y-values on the graph of the function, the correct graph of the function has only points with y-values less than or equal to 4, and crosses the x-axis at only (−3, 0) and (1, 0). The graph in choice A satisfies both of these conditions.
Choice B is incorrect. The graph of the function matches the range given, but the zeros are at −1 and 3, not −3 and 1. Choice C is incorrect. The graph has y-values greater than 4. Choice D is incorrect. Even though the graph has zeros at −3 and 1, it has an additional zero at 0, and the range of the graph is the set of all real numbers. .
|
Similar Questions
Knowledge Check
The zeros of the polynomial function g are 4 and -2. If the range of g is the set real numbers greater than or equal to -3, which of the following could be the graph of y=g(x) in the xy-plane?
A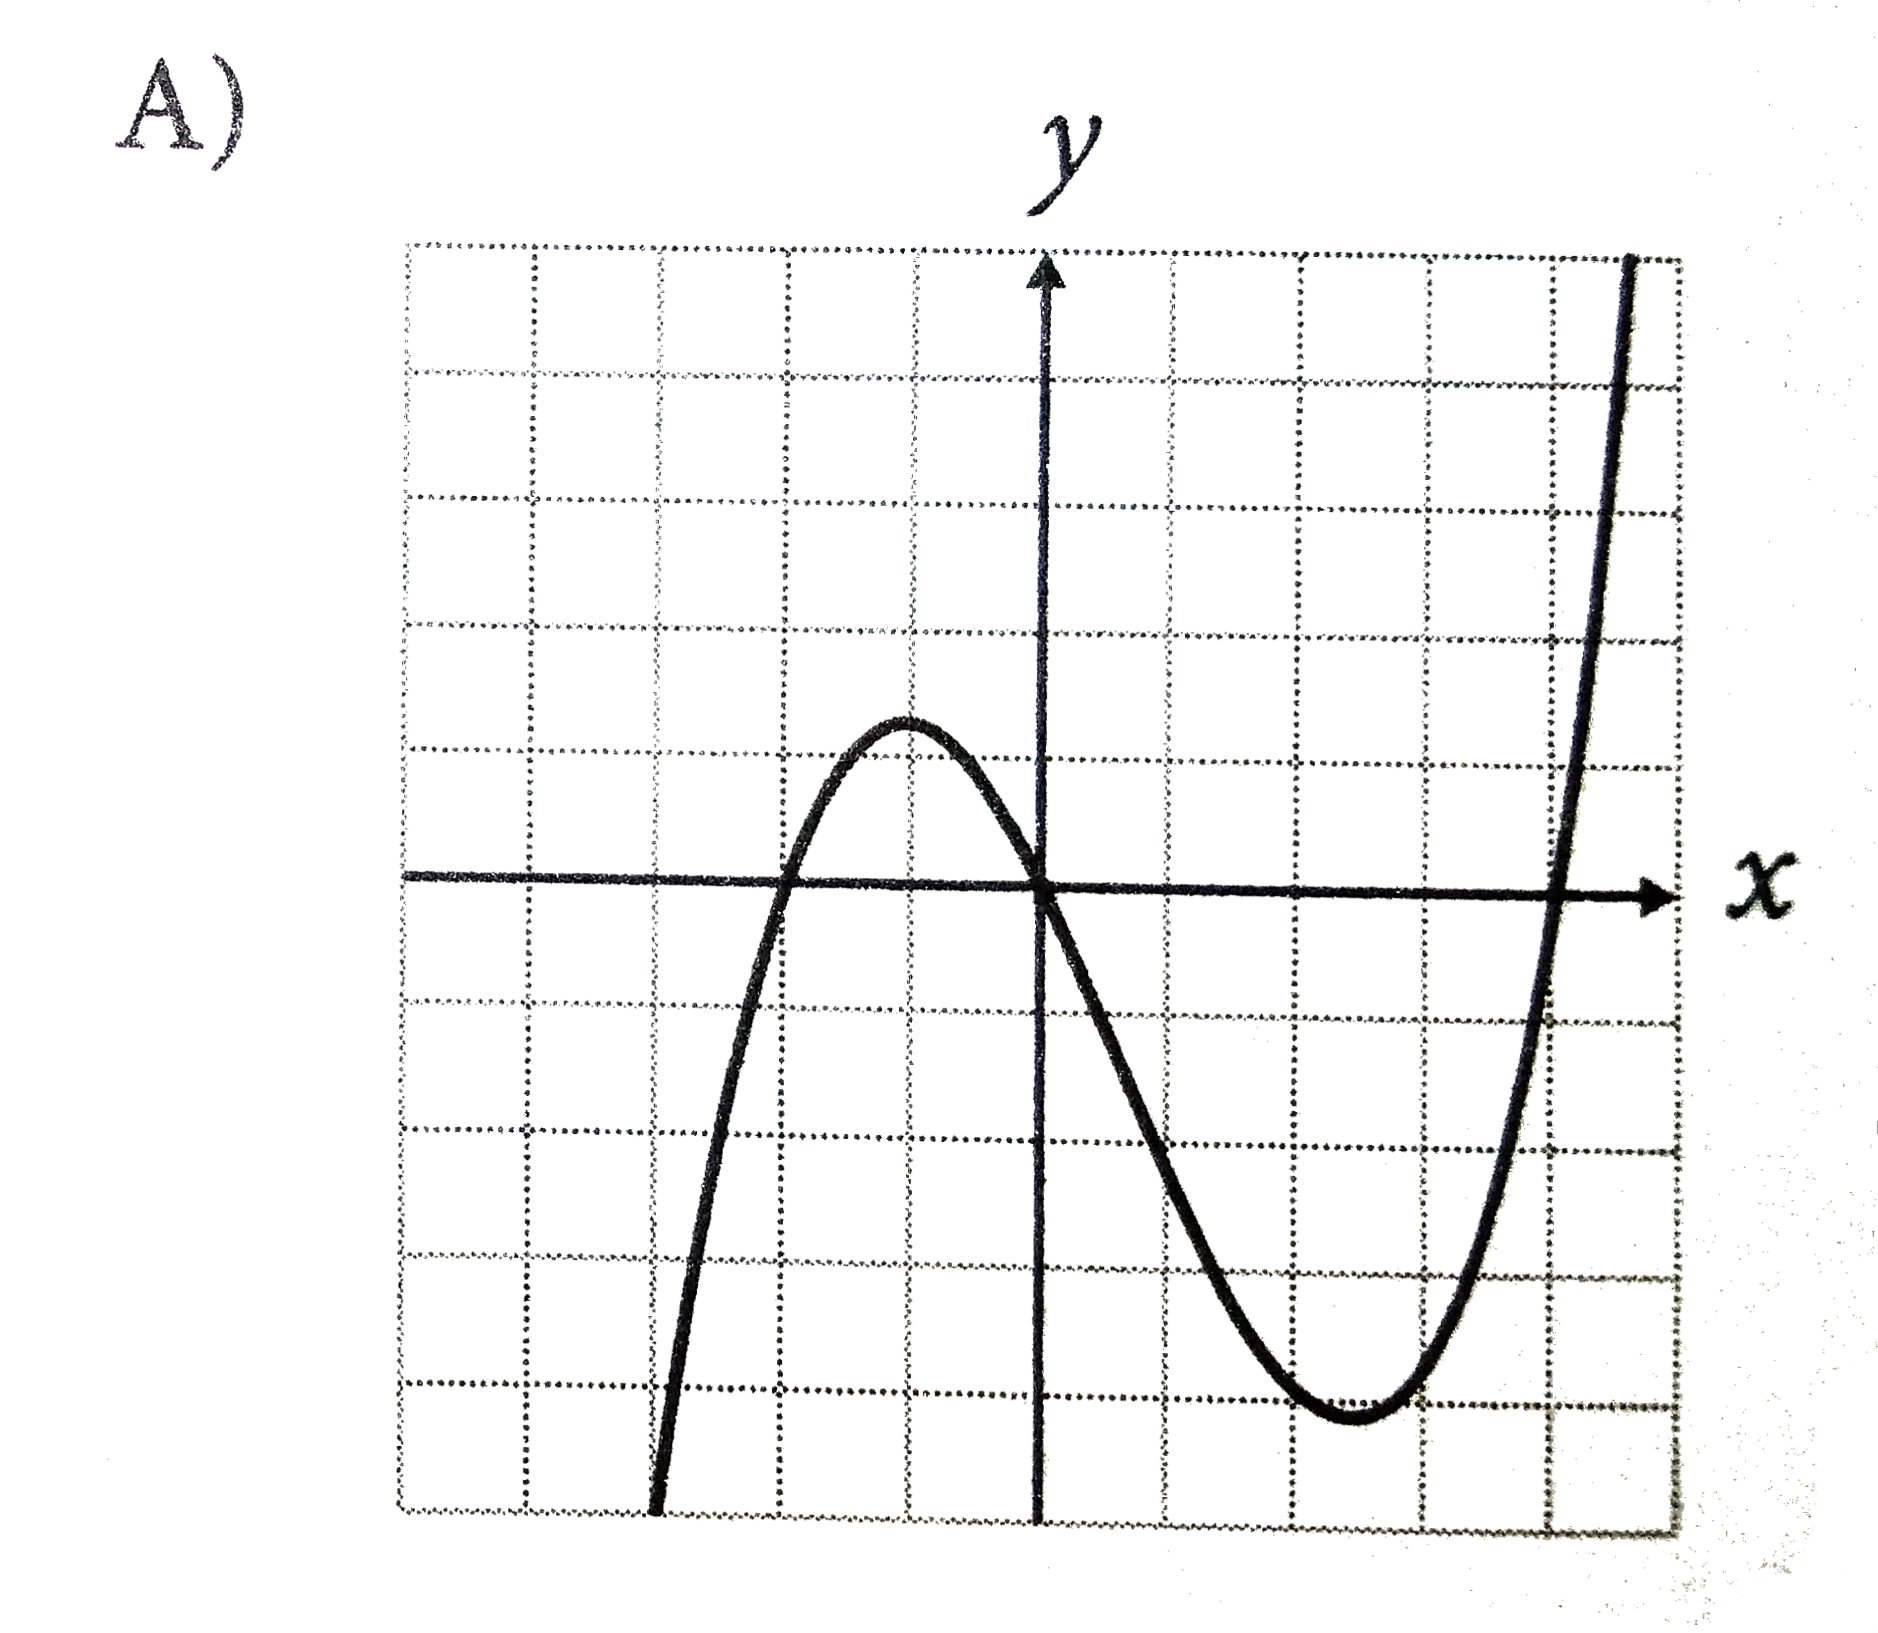 B
B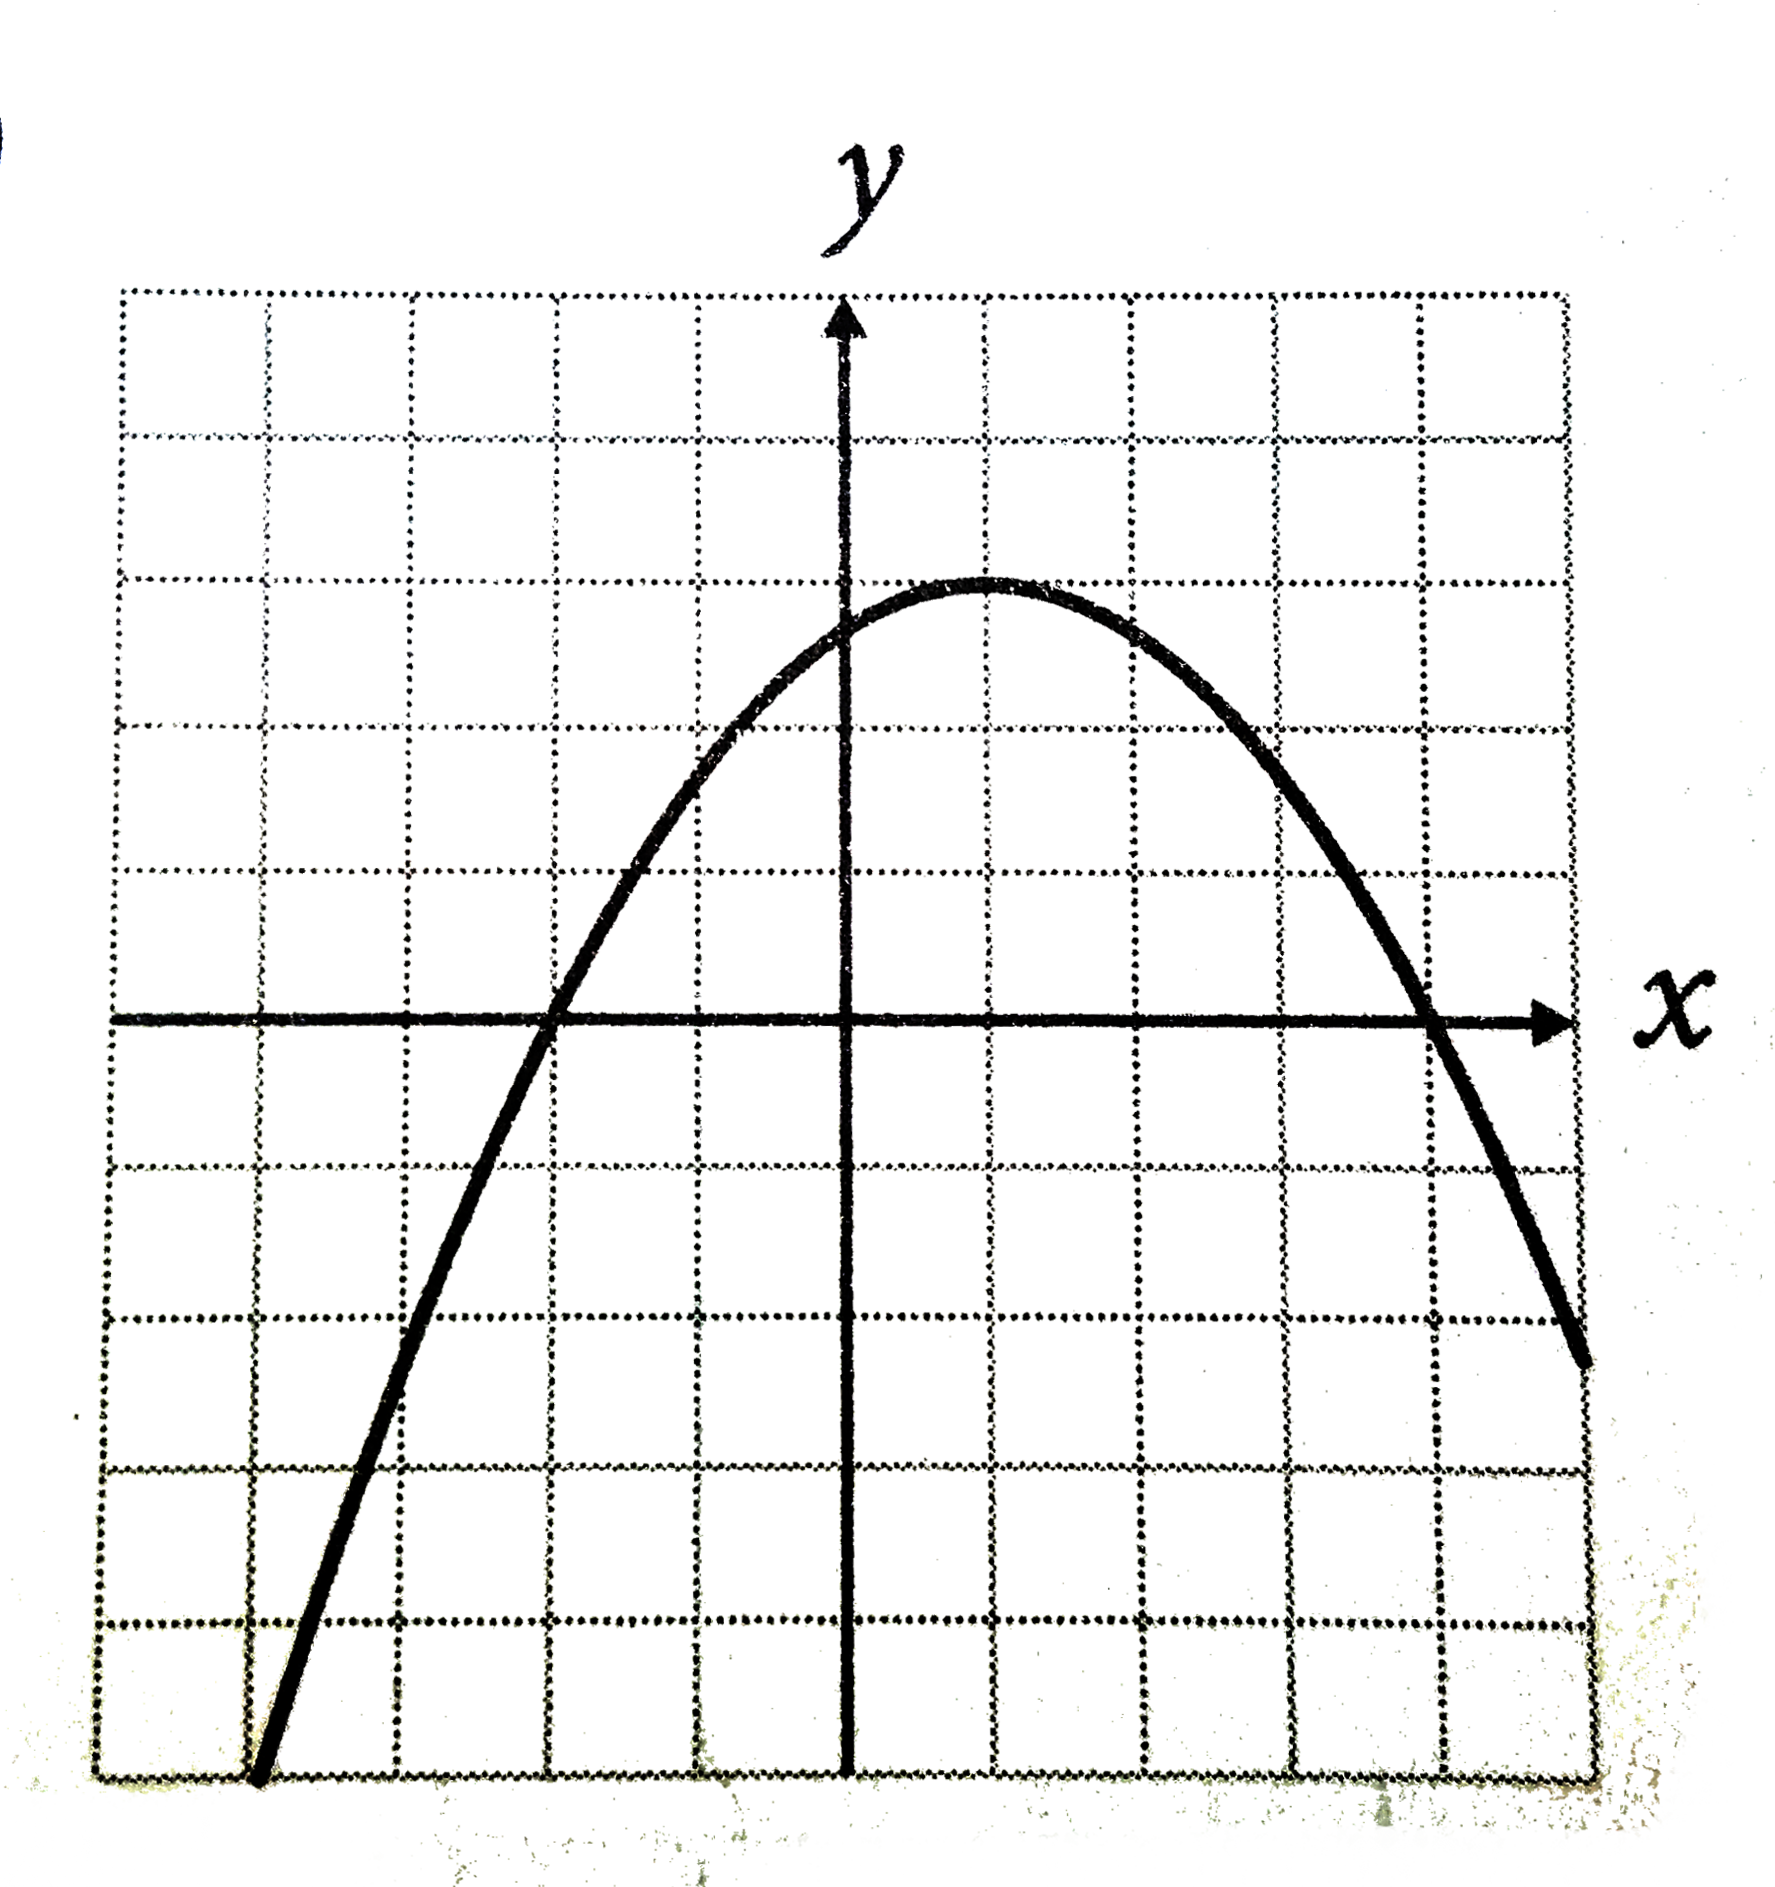 C
C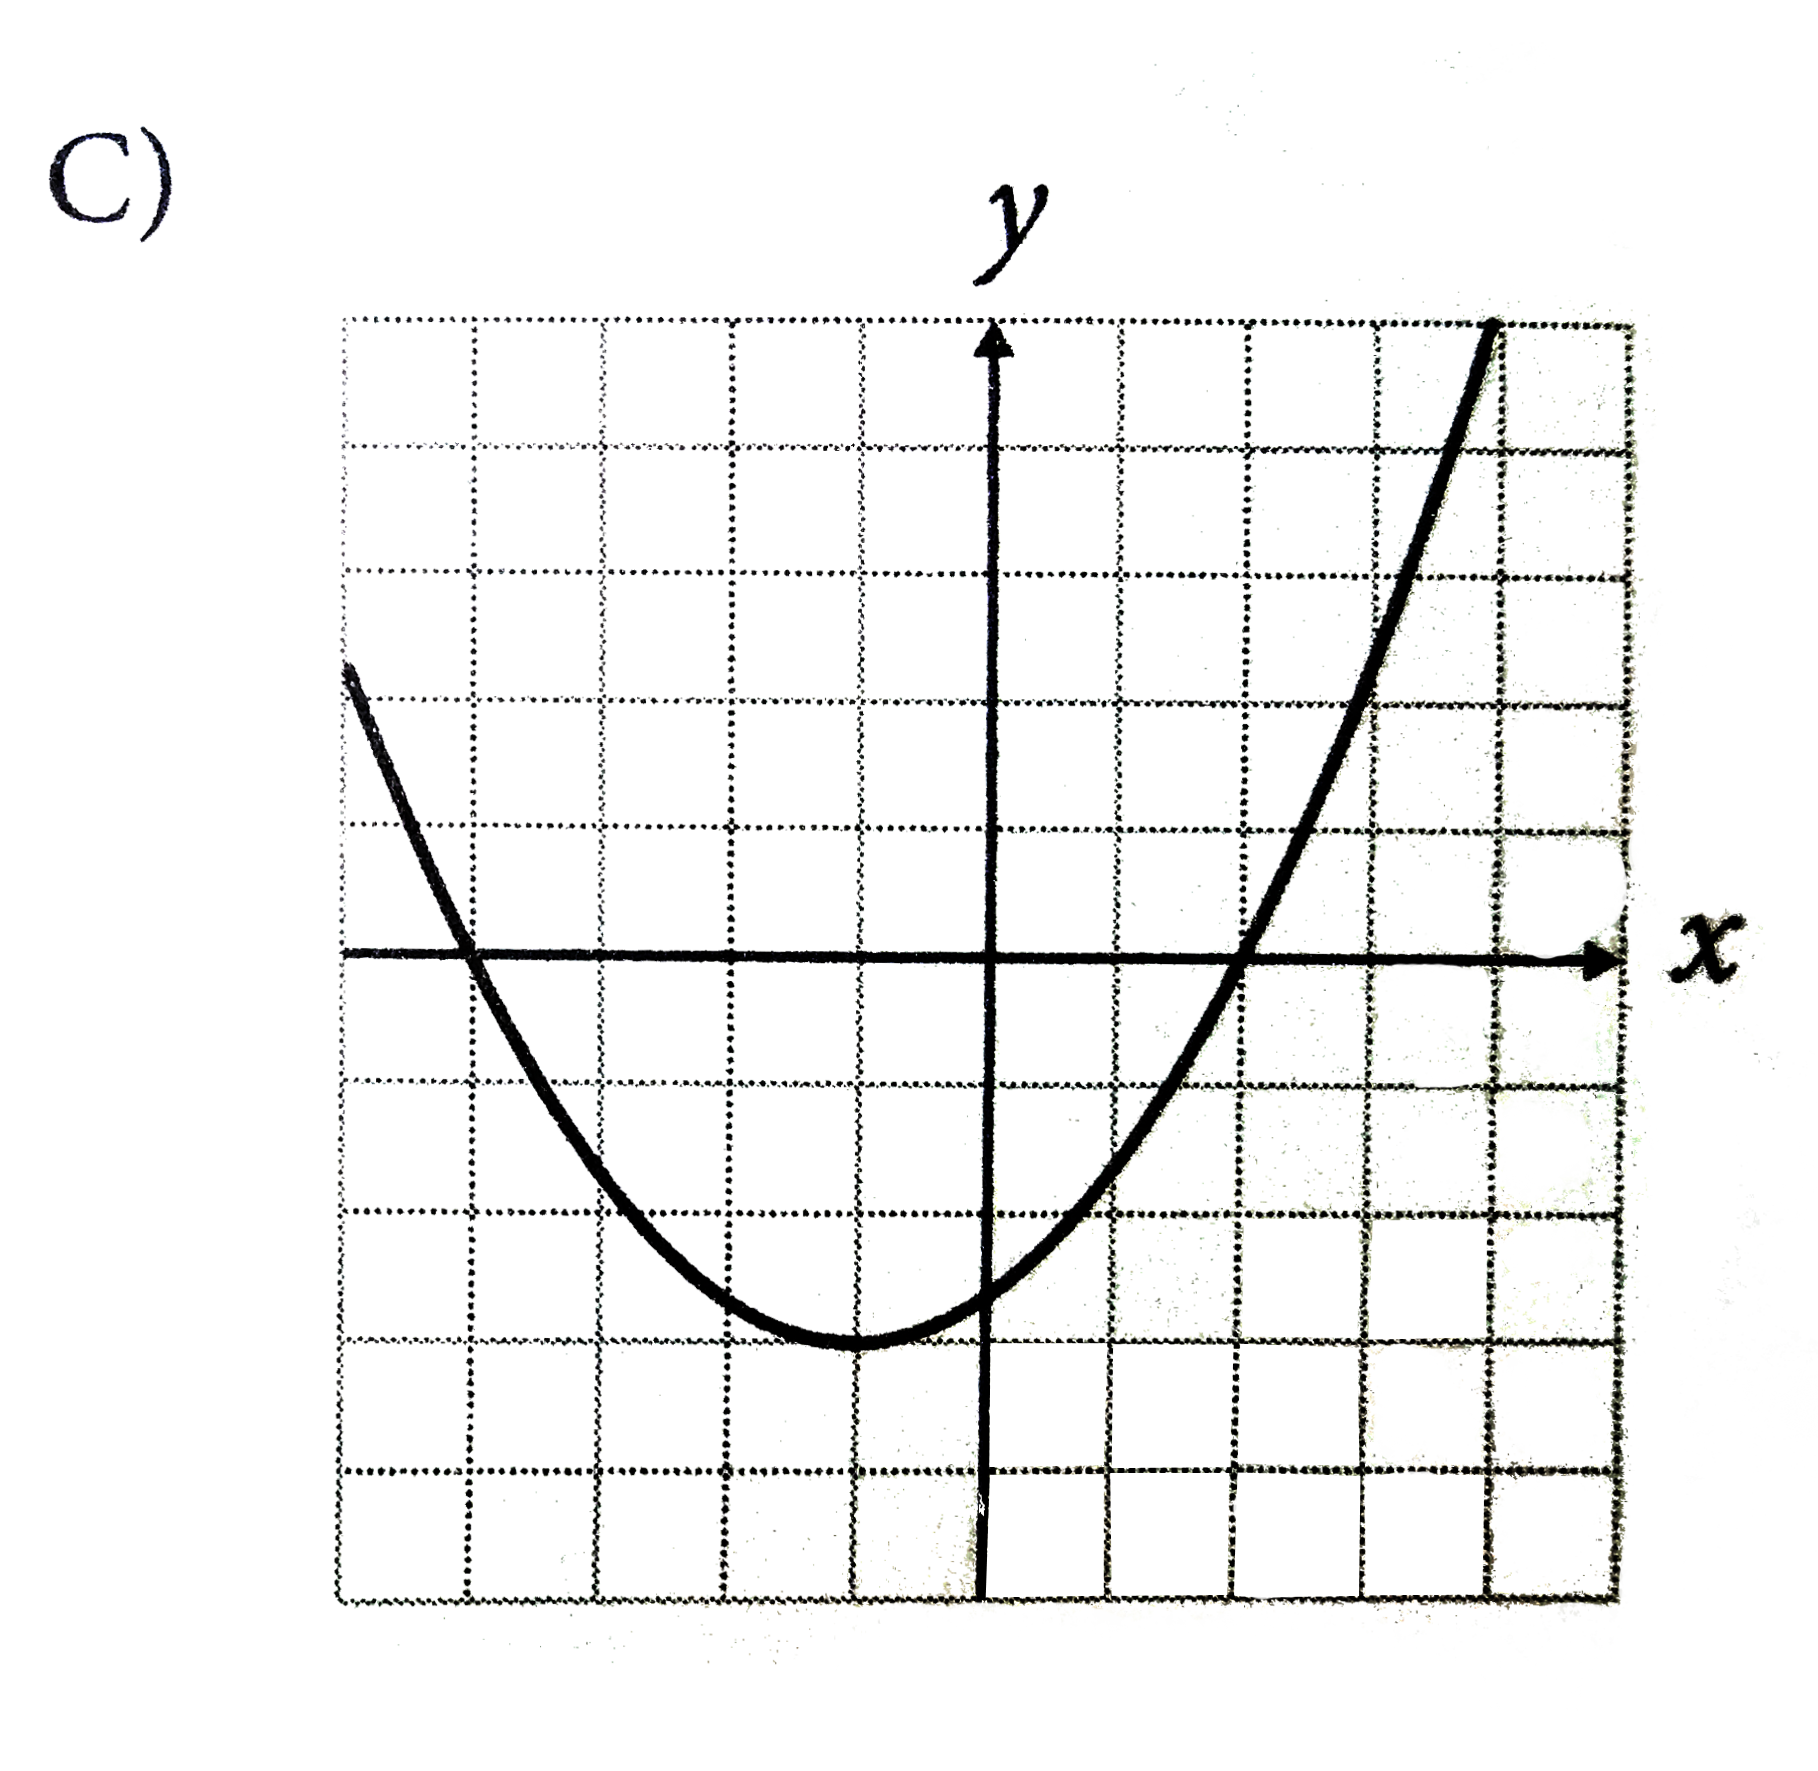 D
D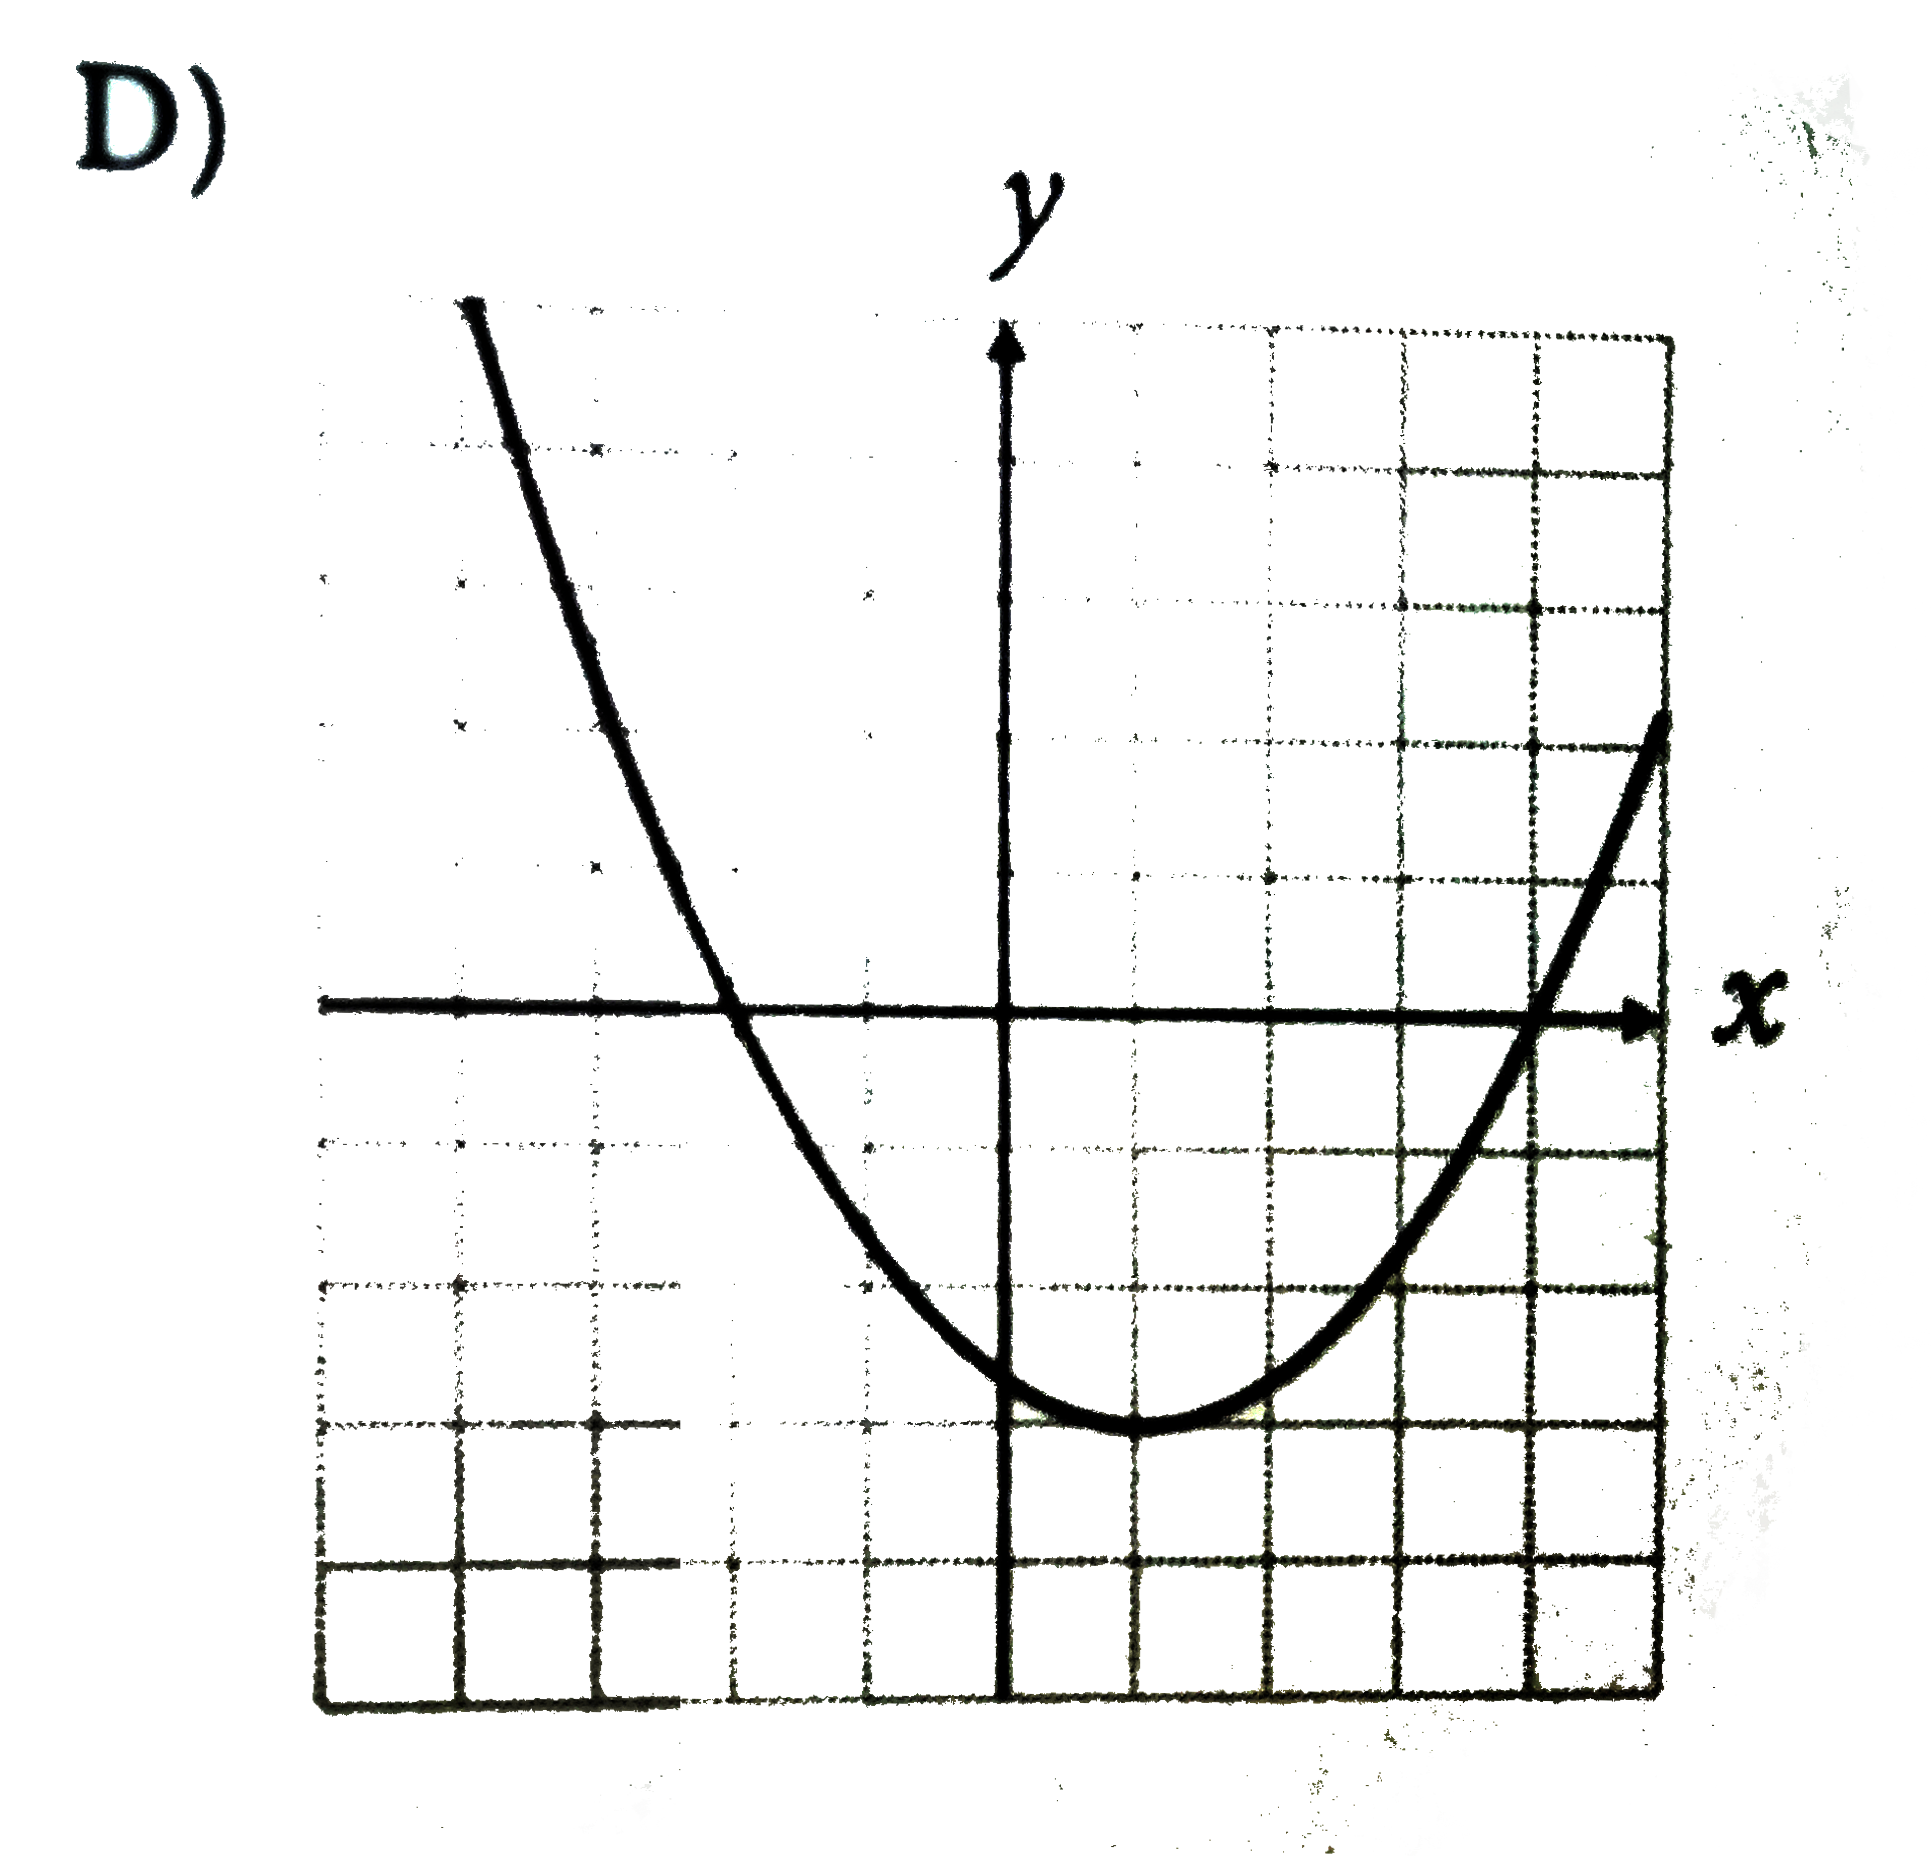
If the function f has three distinct zeros, which of the following represents the graph of f in the xy-plane?
A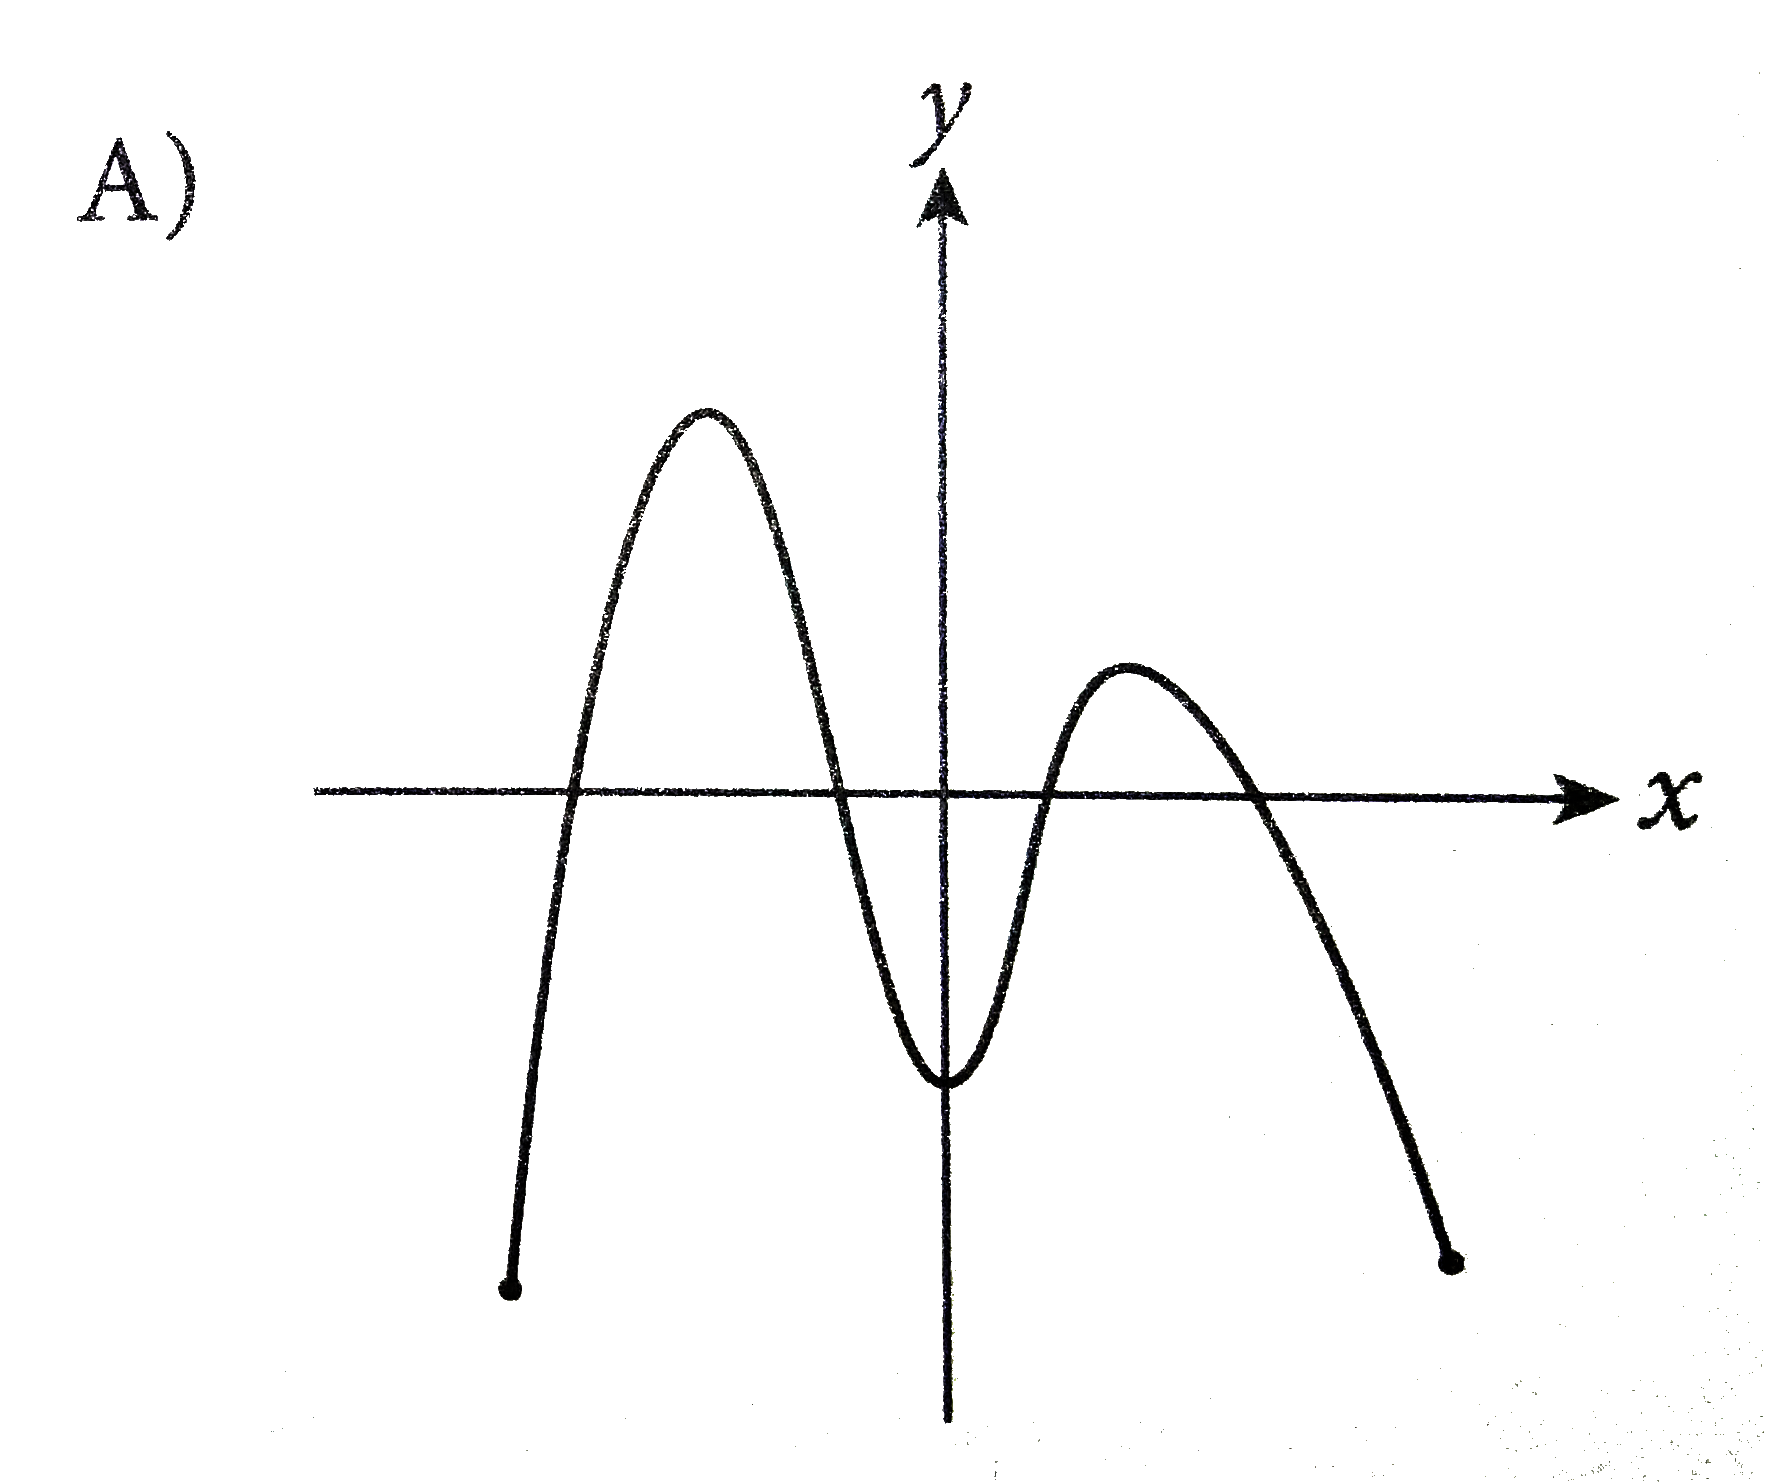 B
B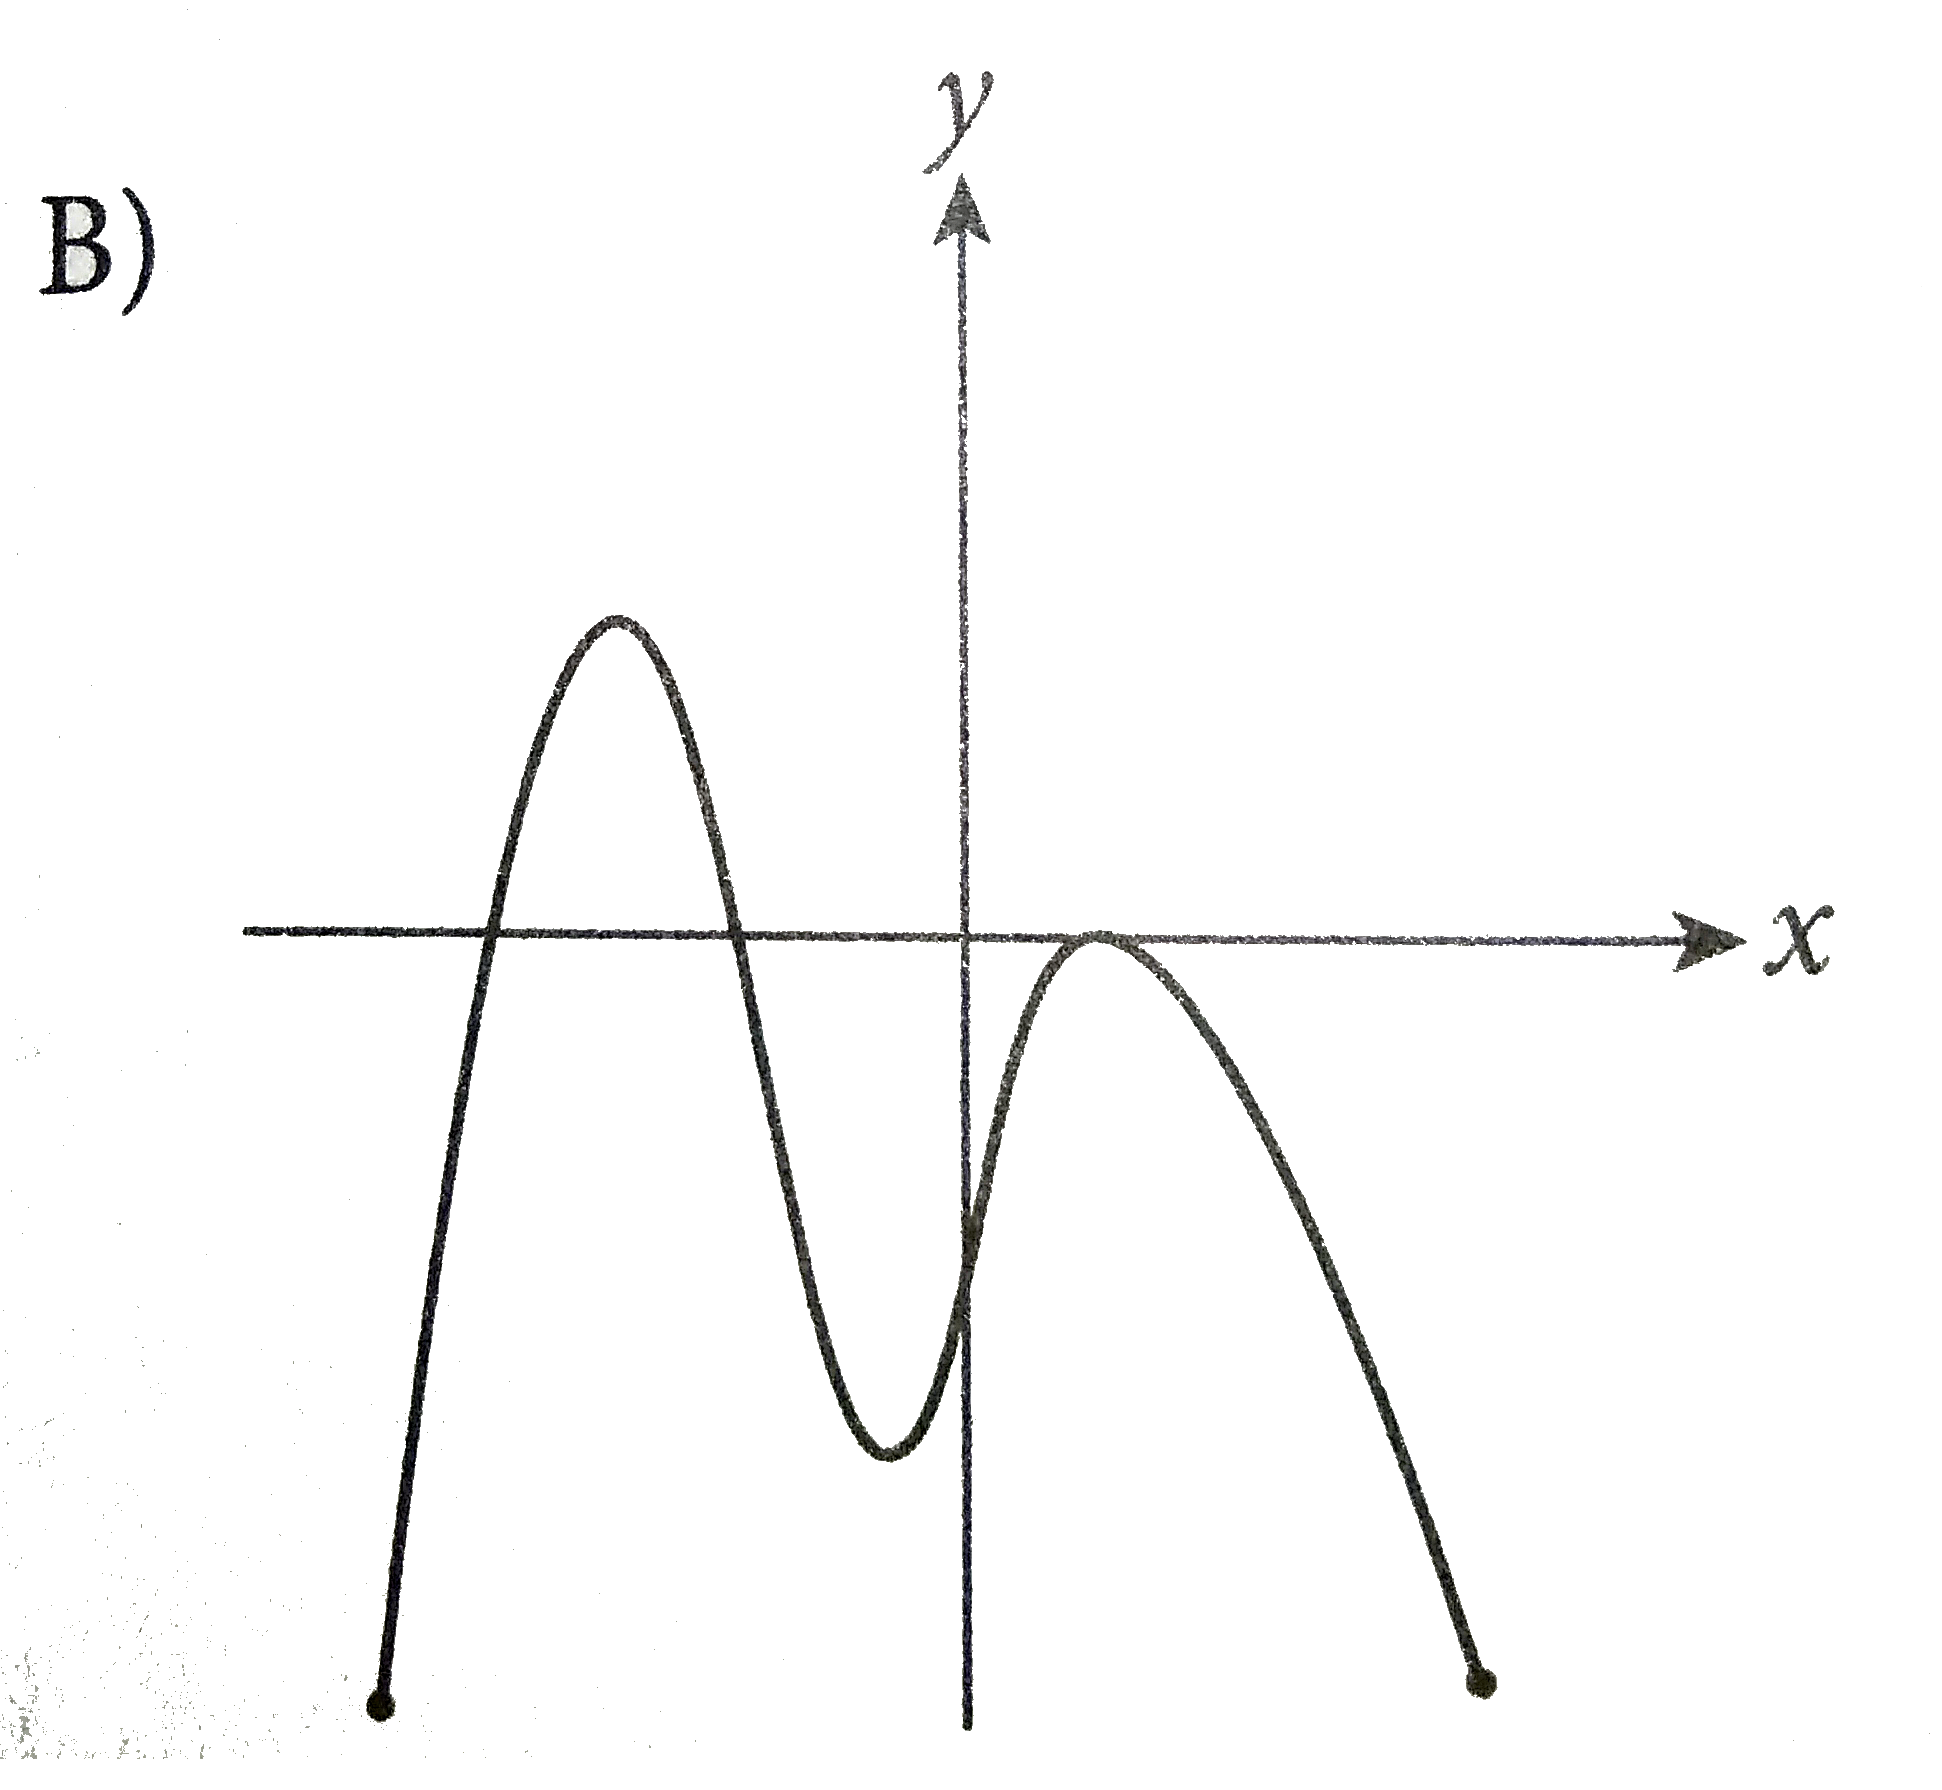 C
C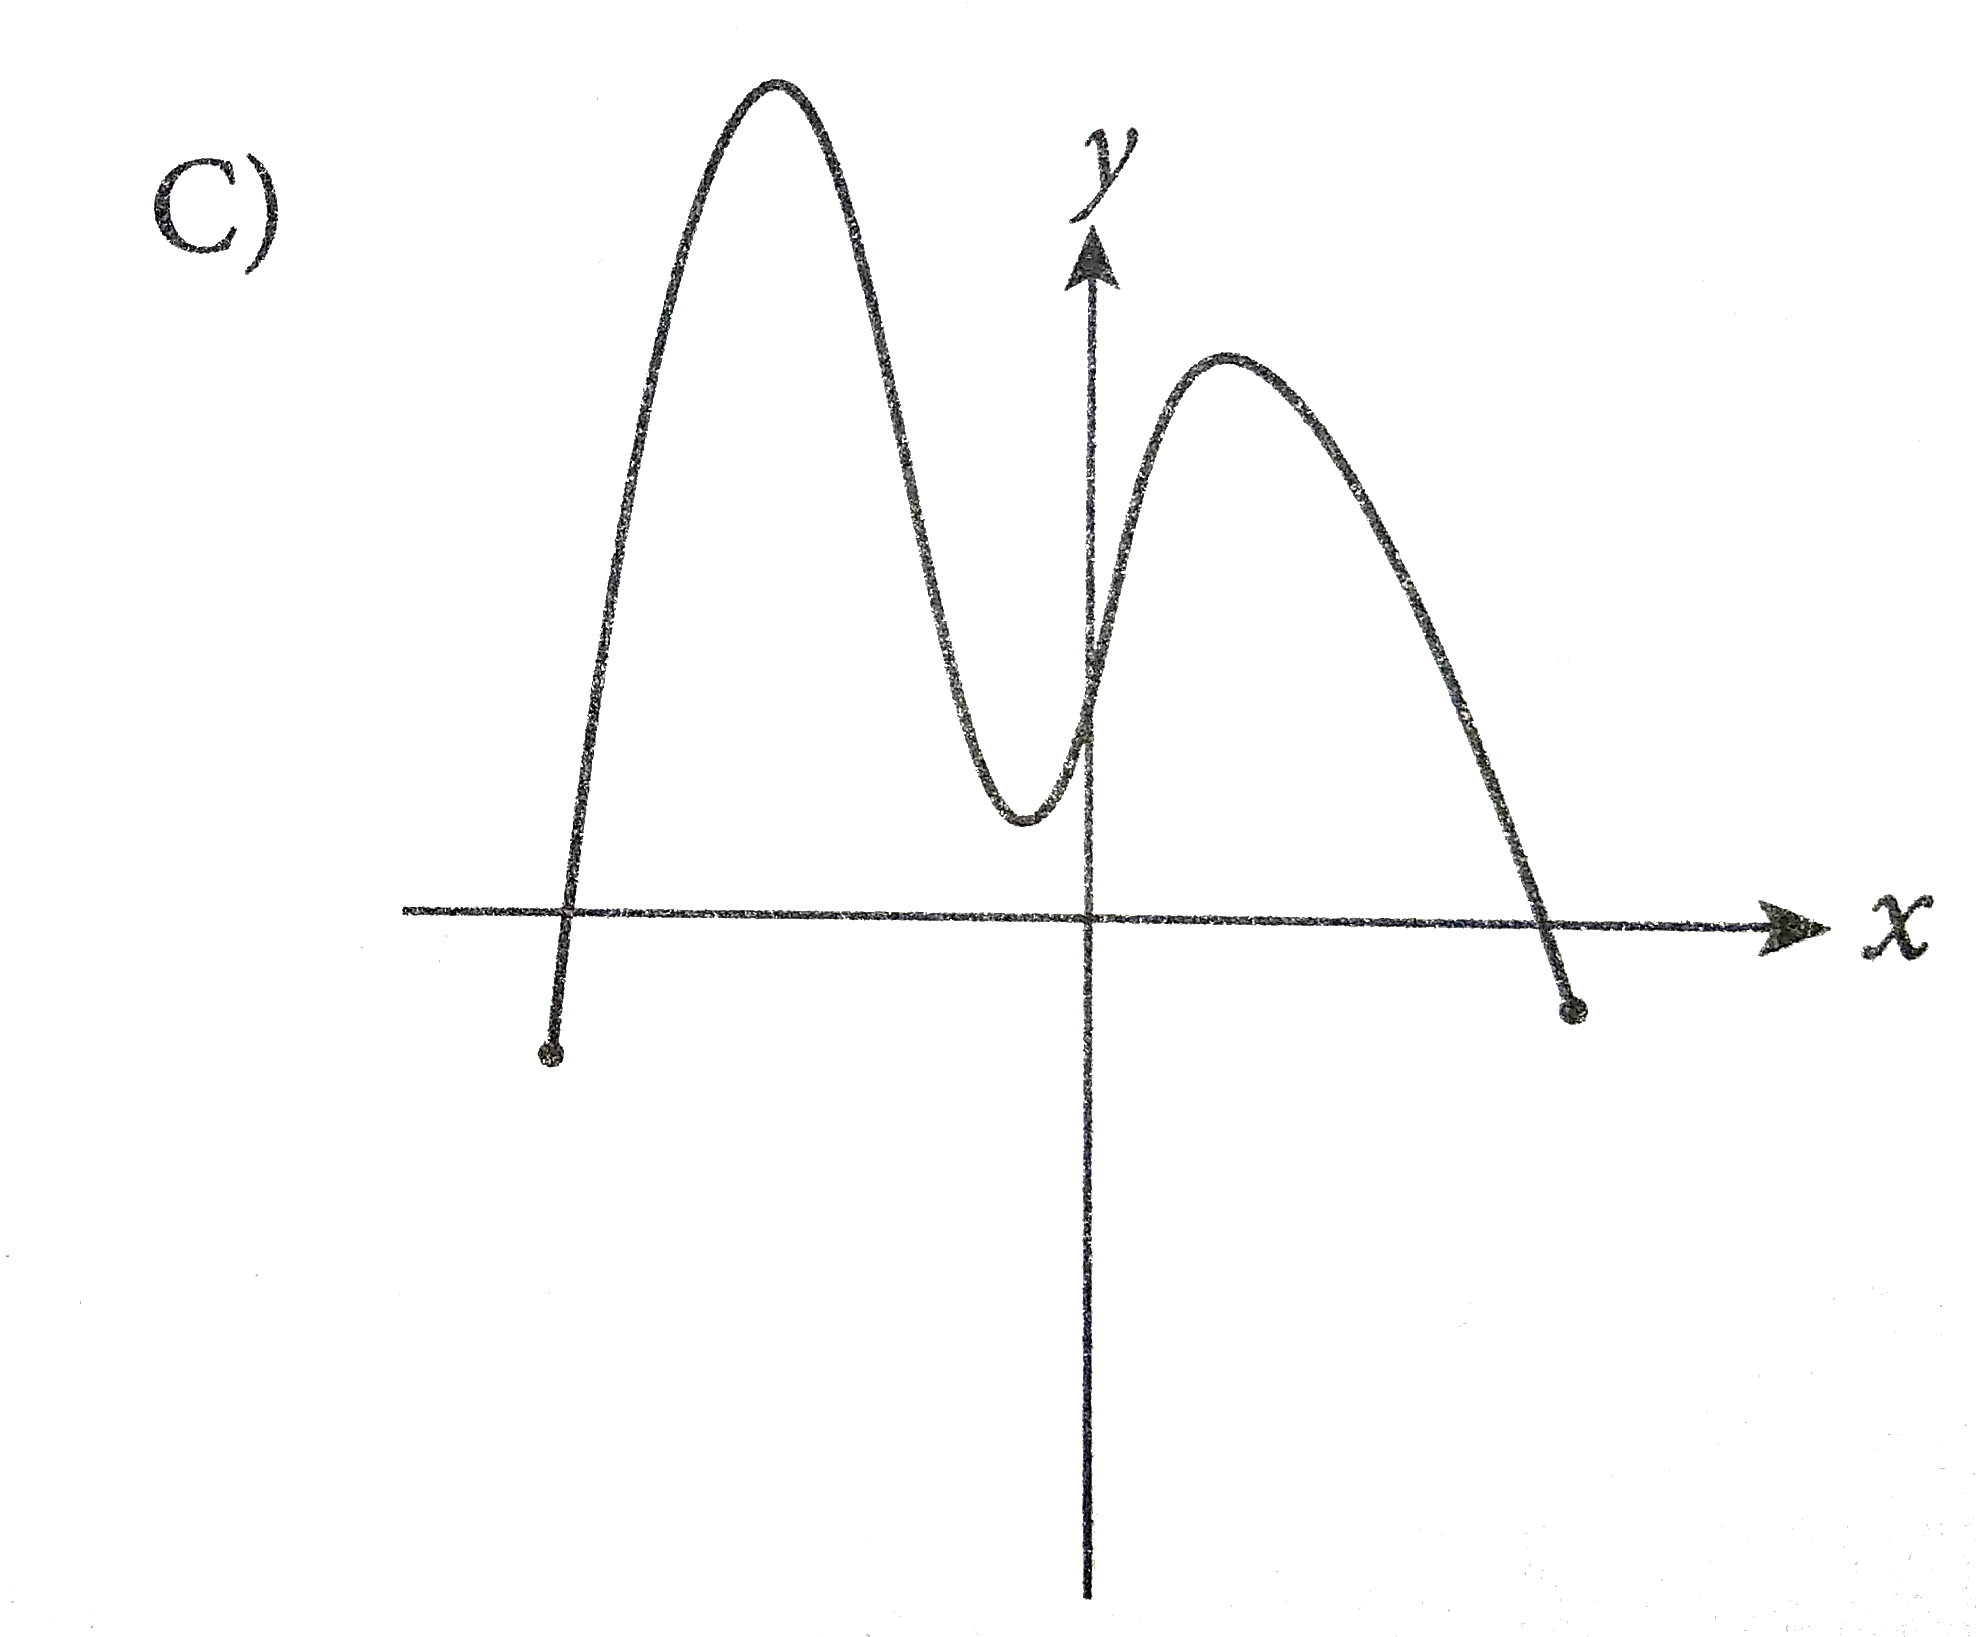 D
D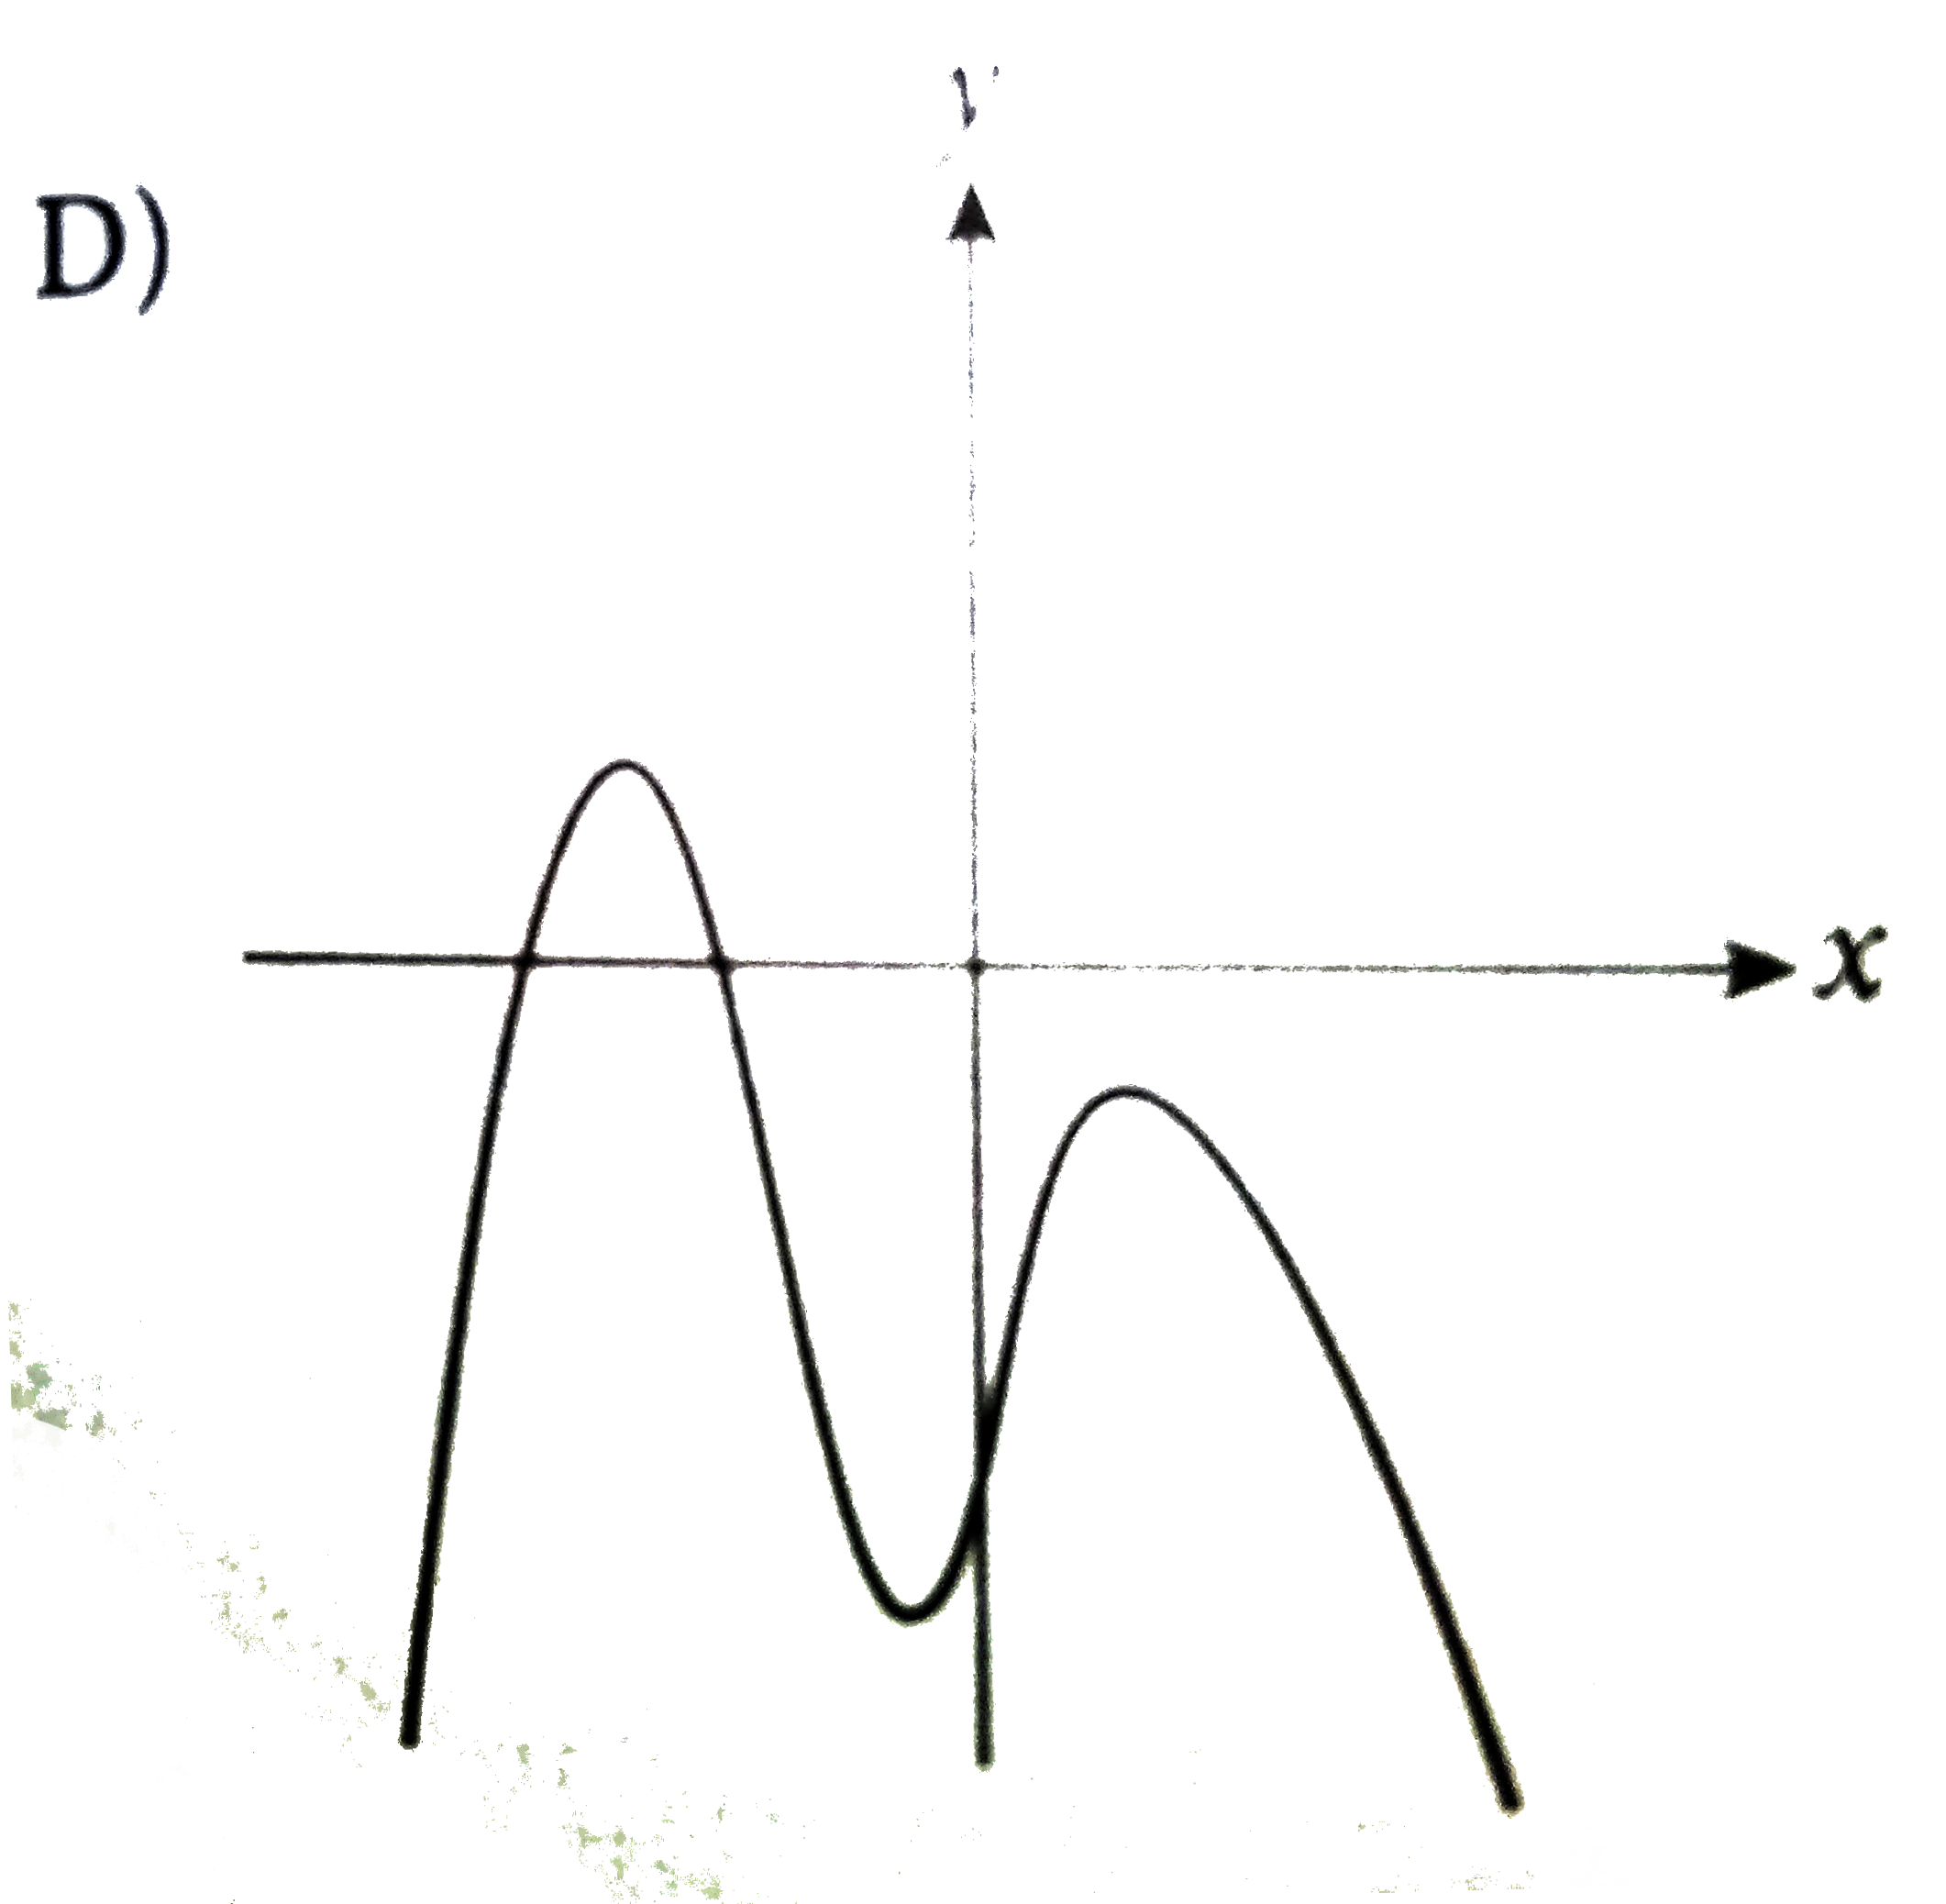
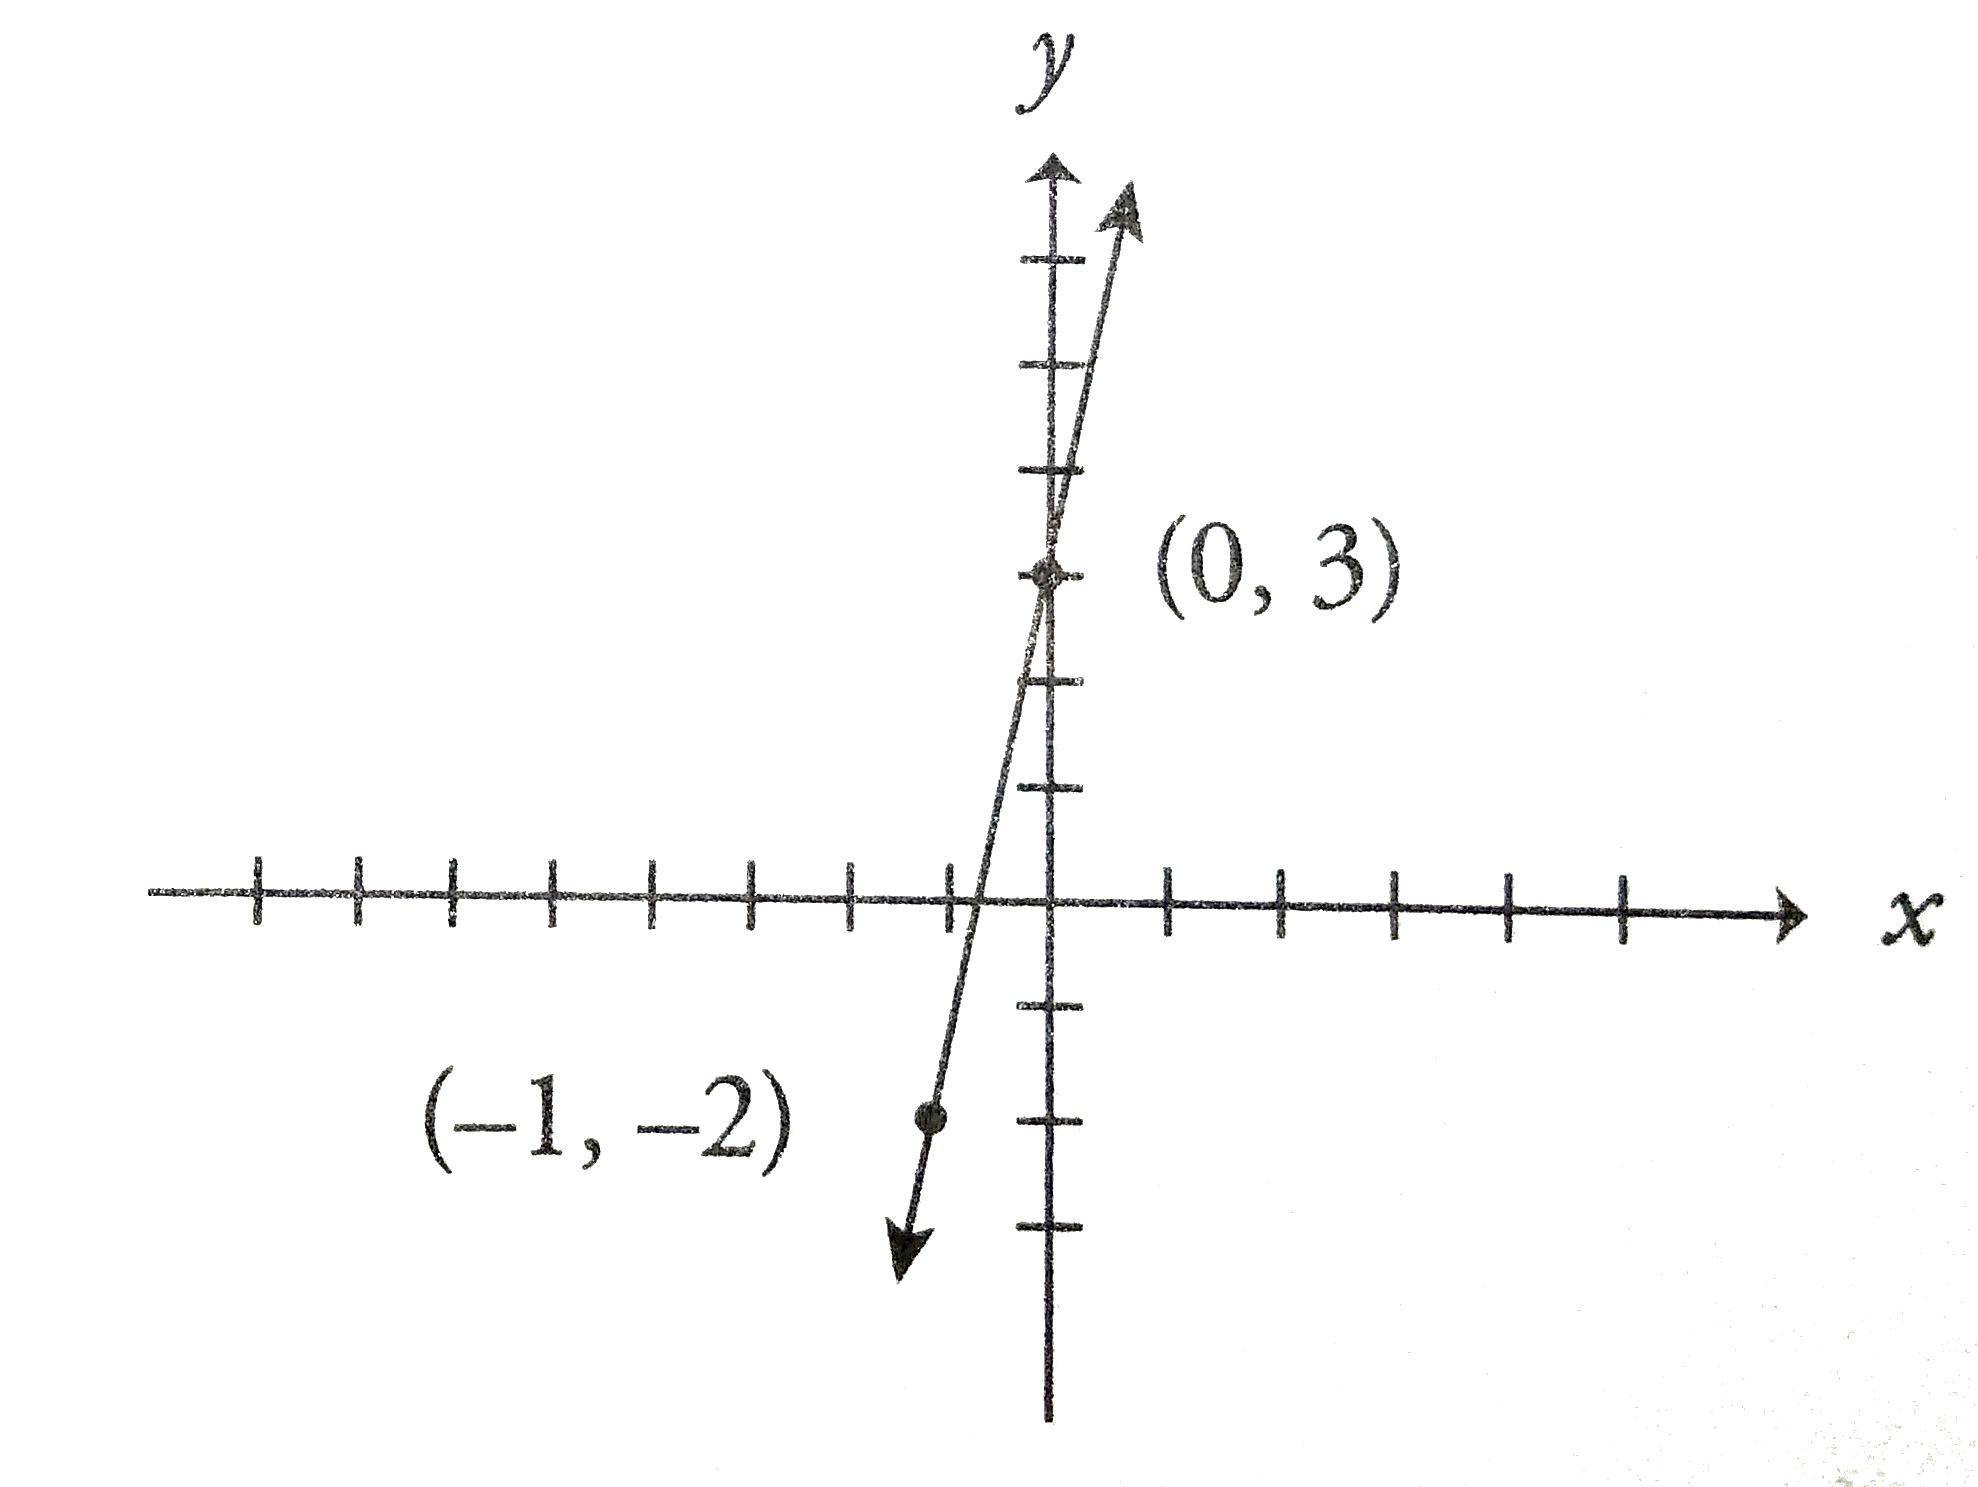
If the graph above is that of f(x), which of the following could be f(x)?Af(x)=15x+15Bf(x)=15x+3Cf(x)=3x+5Df(x)=5x+3
12 If the function f has five distinct zeros, which of the following could represent the complete graph of f in the xy‑plane?
View Solution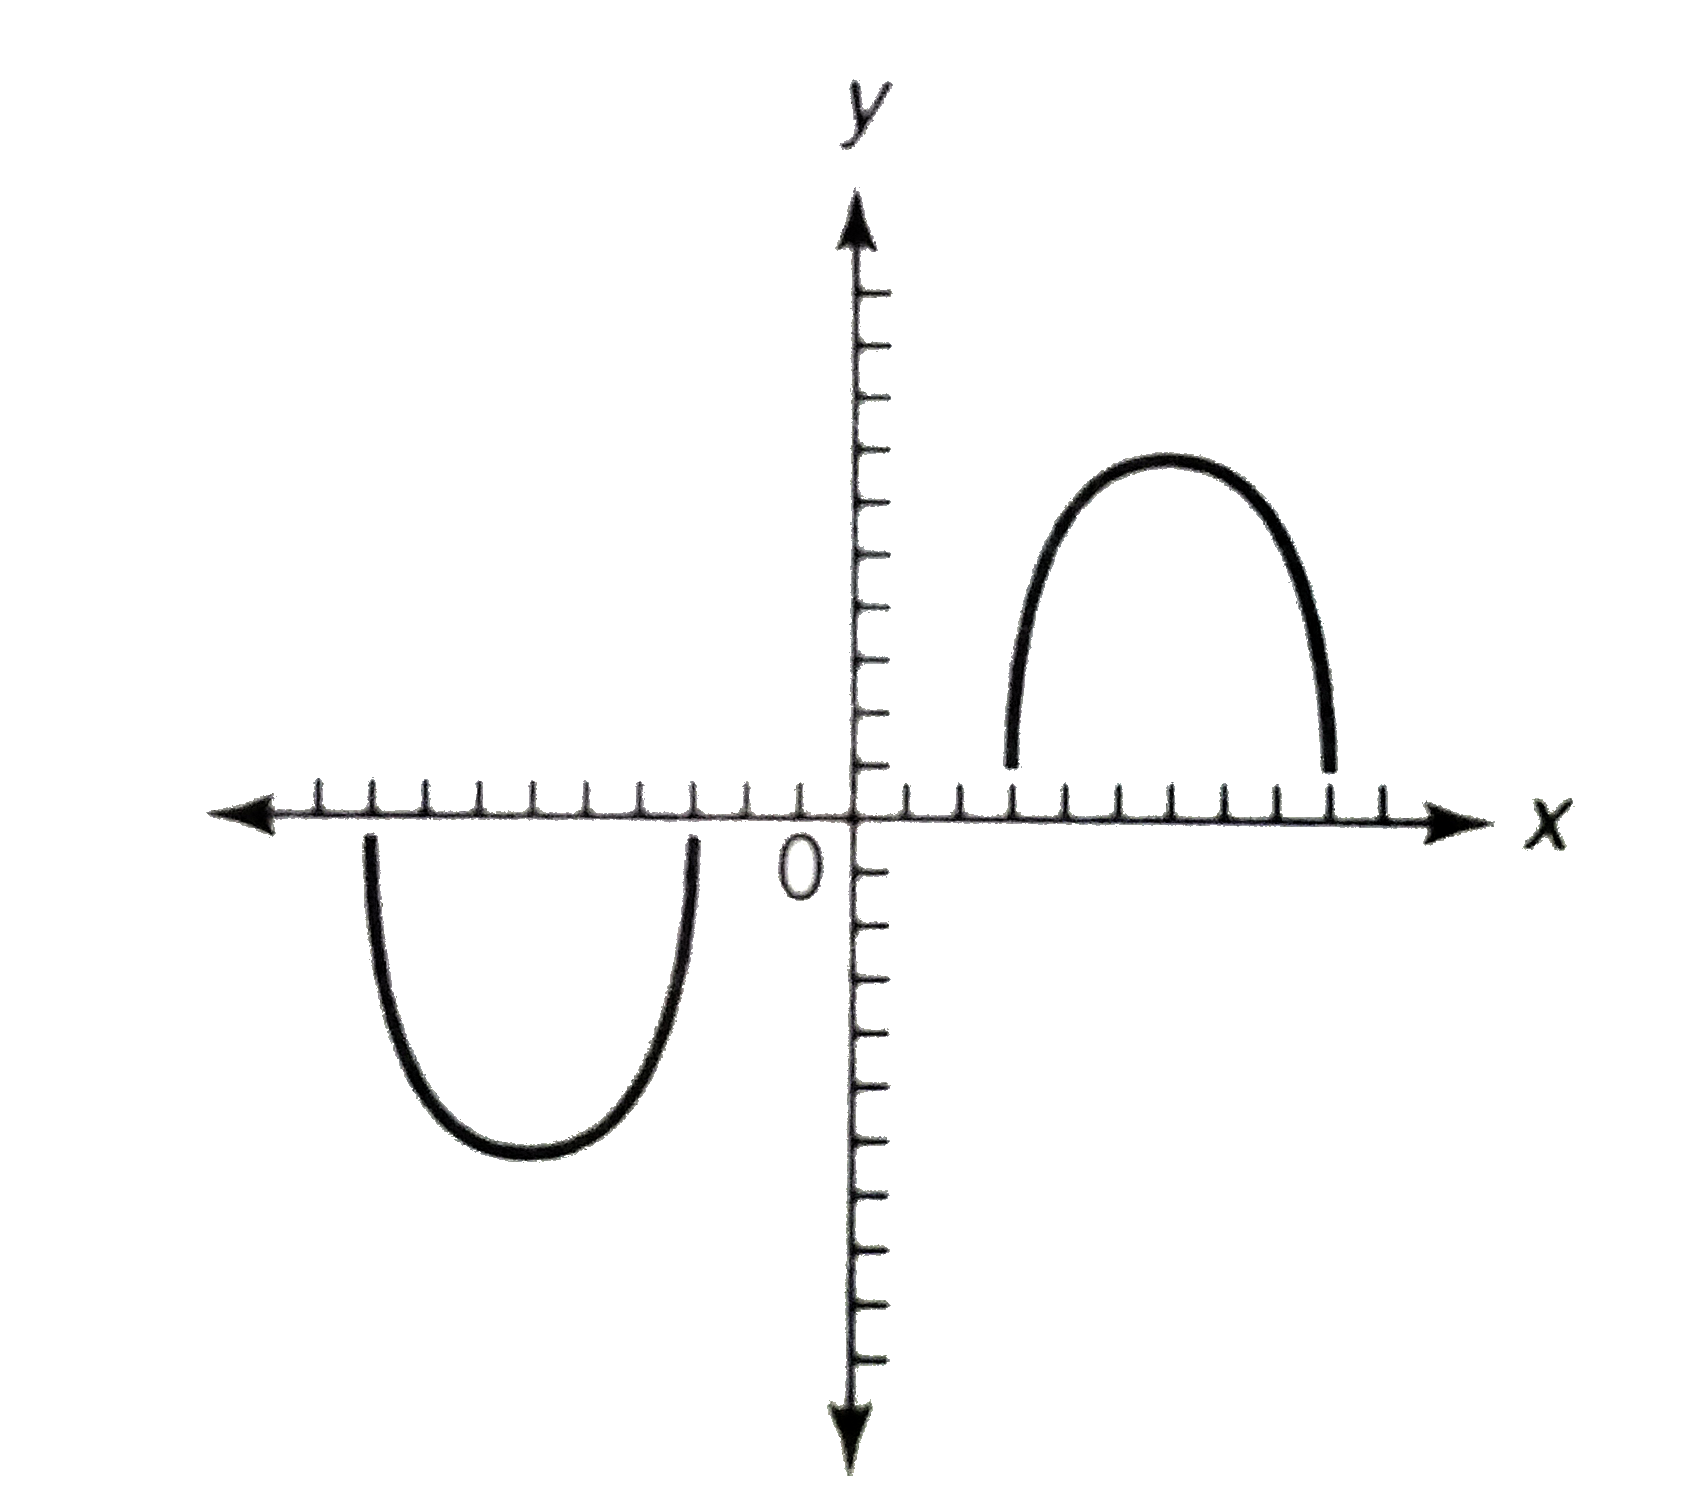
The graph of the function f is shown above. Which of the following could represent the graph of y=|f(x)|?
View SolutionThe graph of y=f(x) is shown below.
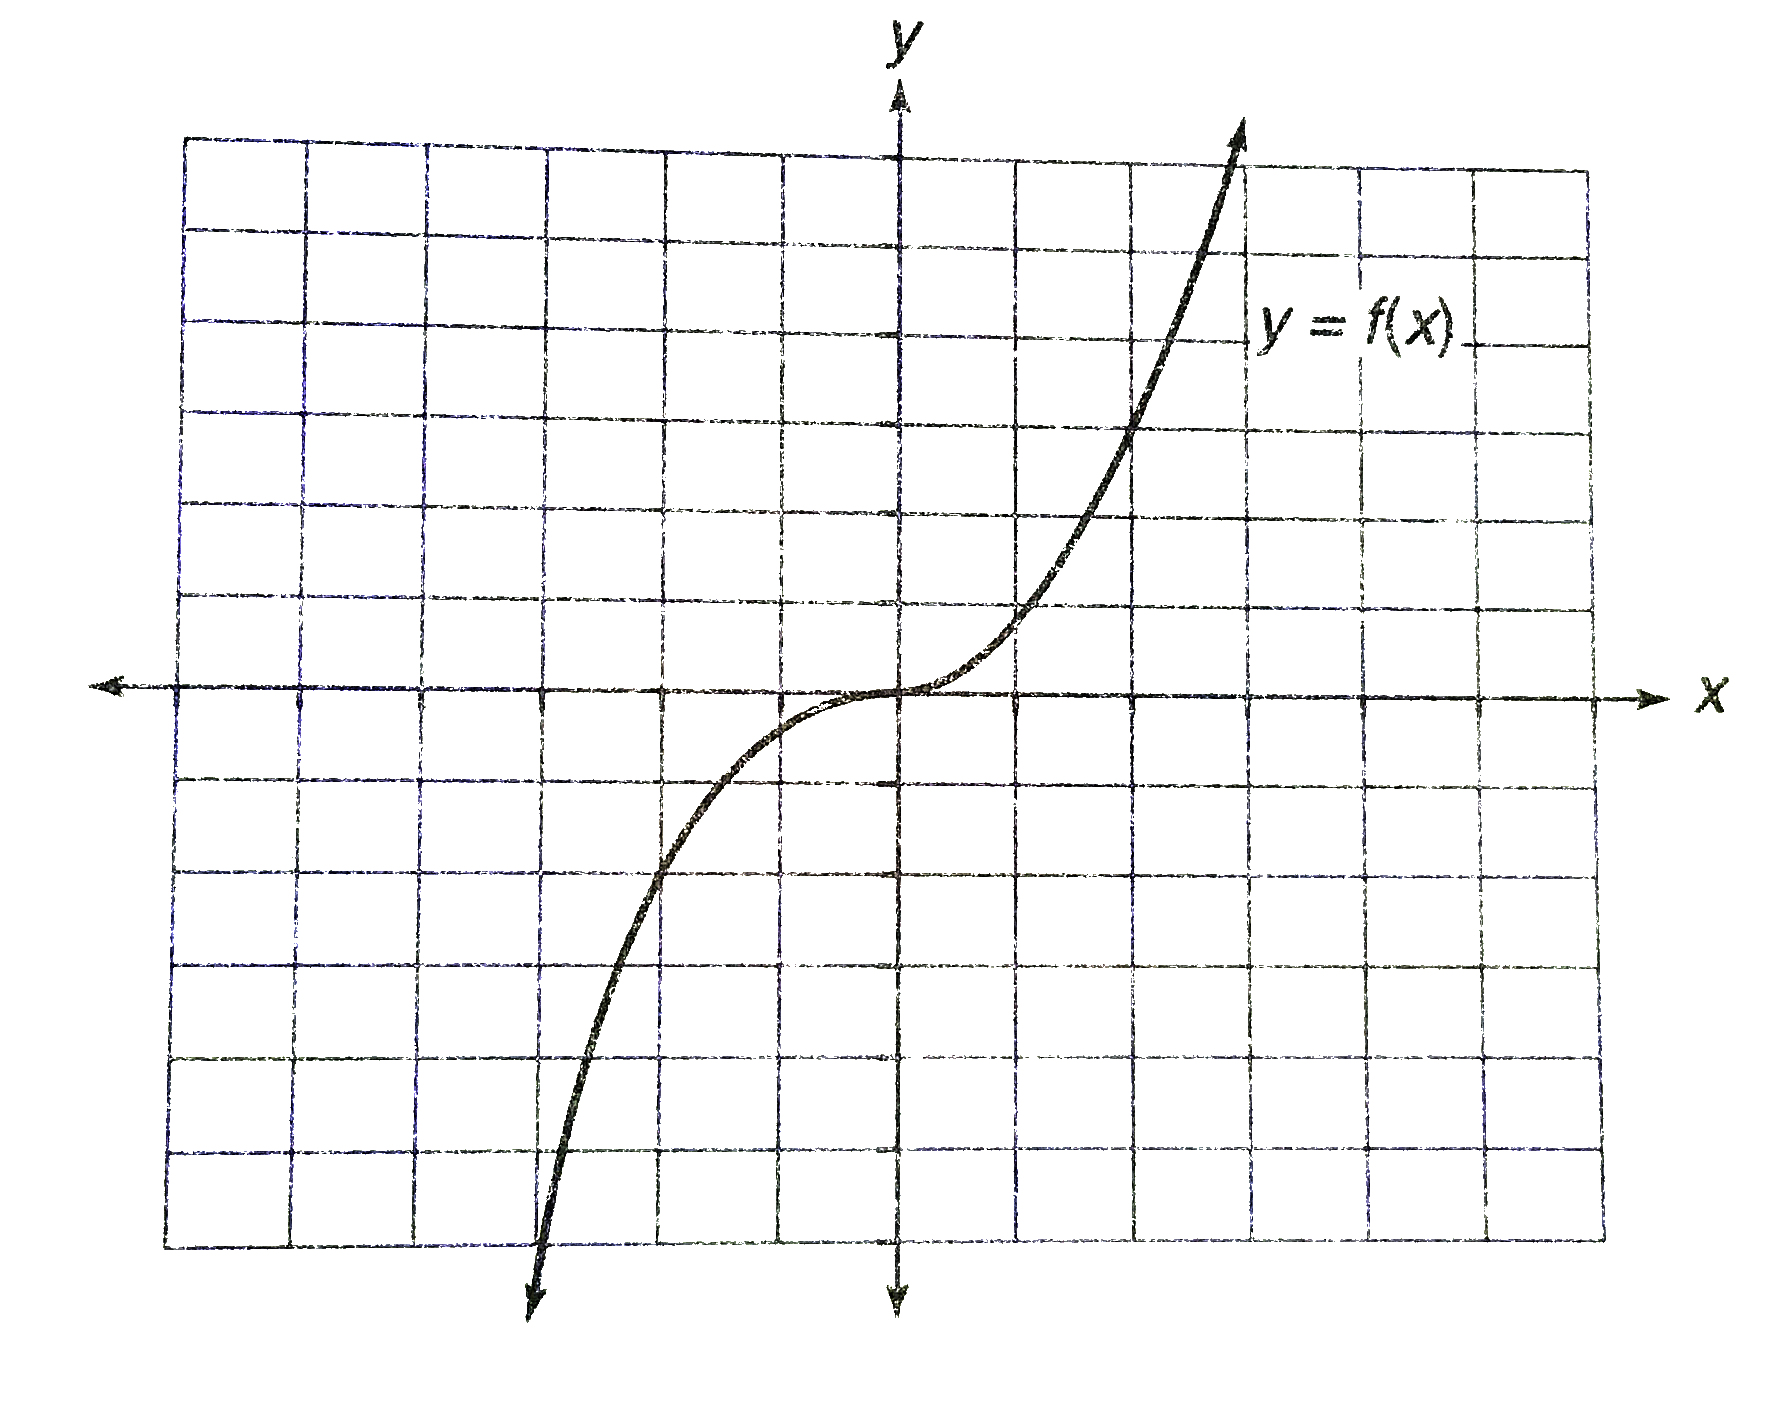
Which of the following could represents the graph of y=f(x−2)+1?
View Solutionf (x) = (x + 3)(x − k)
T he function f is defined above. If k is a positive integer, which of the following could represent the graph of y = f (x) in the xy-plane?
View Solution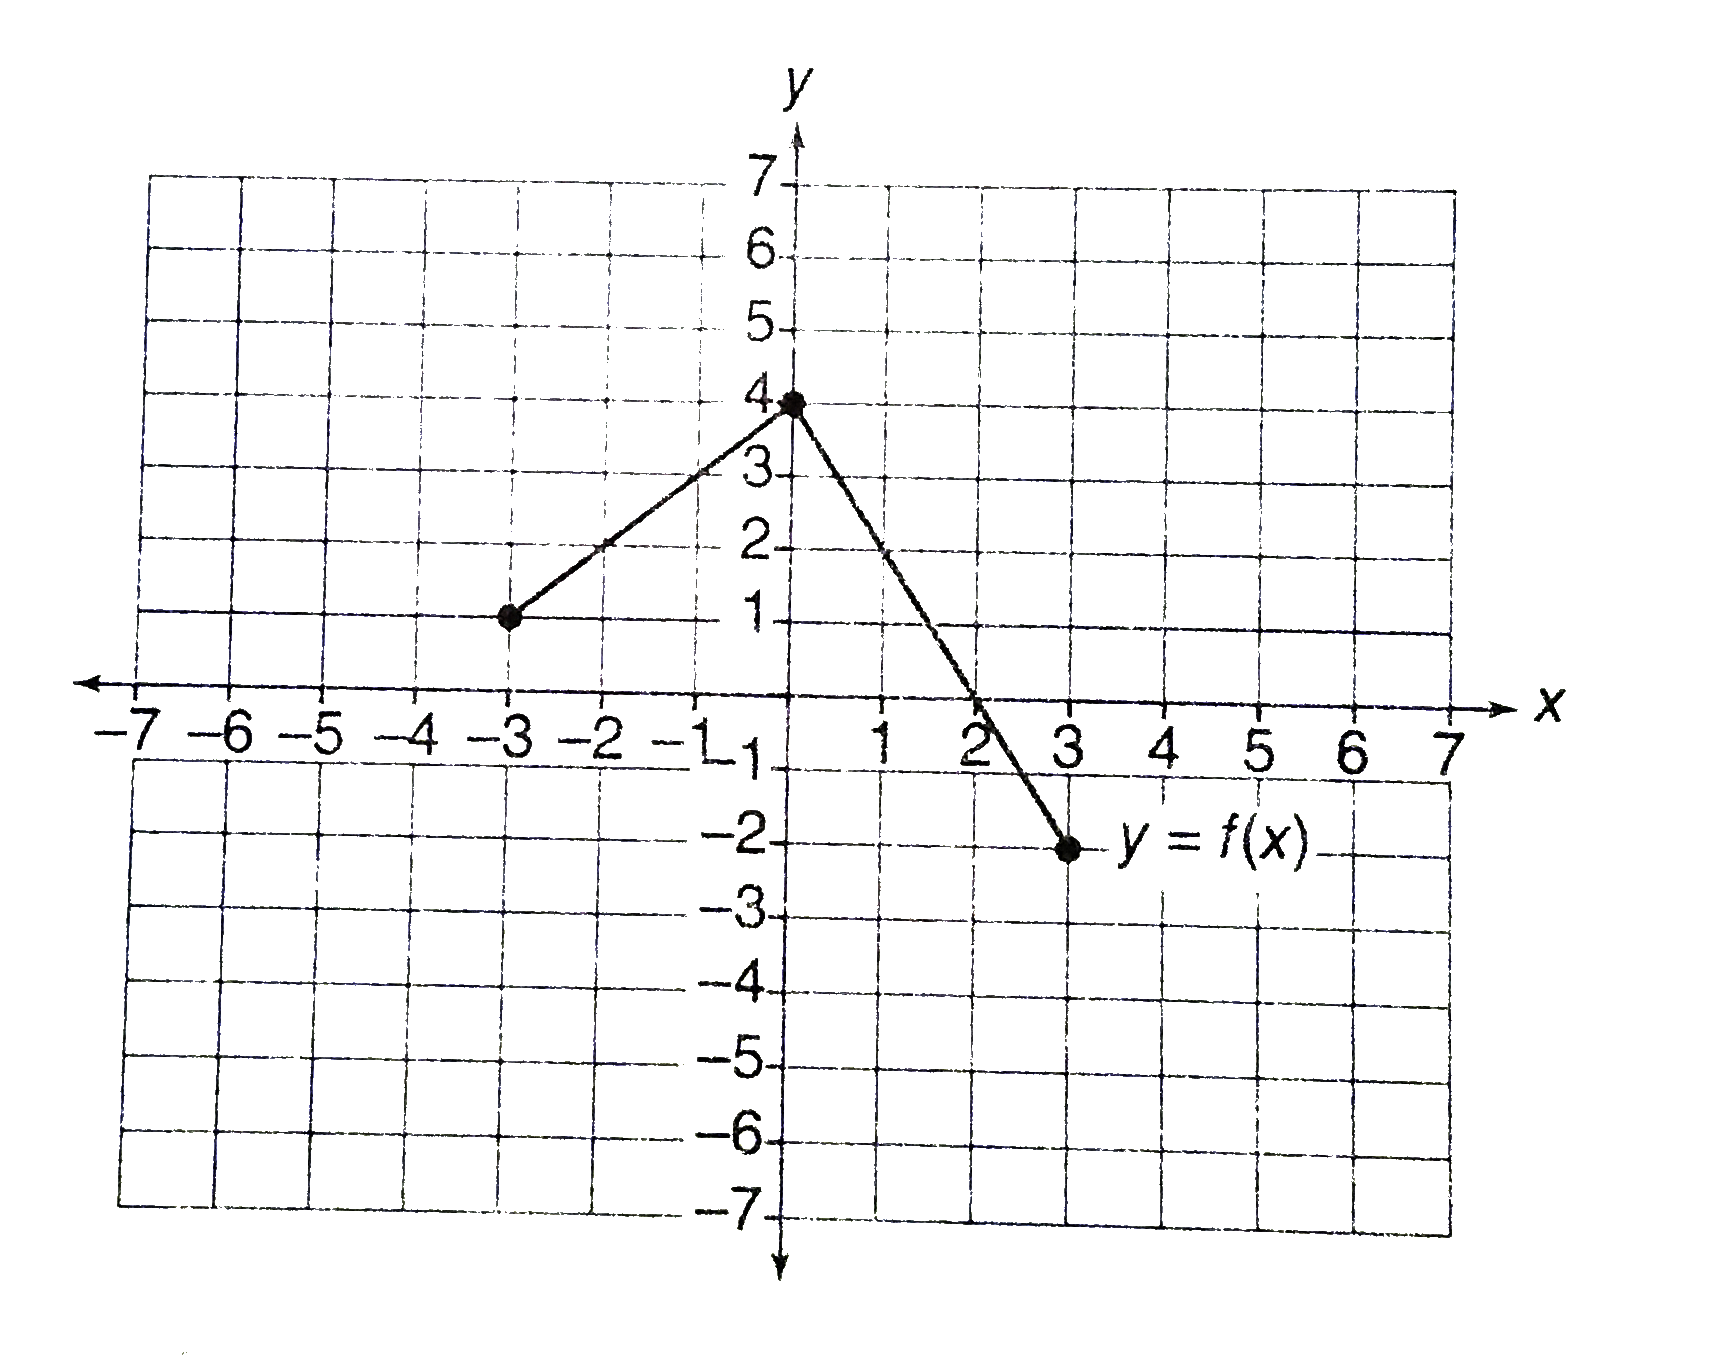
If the accomanying figure above shows the graph of function f, which of the following could represent the graph of y=f(x+1)?
View Solution
