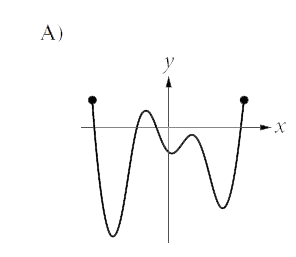
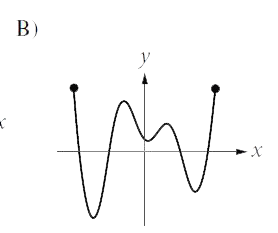
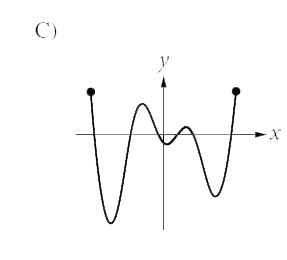
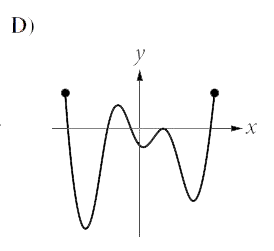
12 If the function f has five distinct zeros, which of the following could represent the complete graph of f in the xy‑plane?
The correct Answer is:D
To solve the problem of identifying which graph could represent a function f with five distinct zeros, we need to analyze the characteristics of the graphs provided in the options. Here’s a step-by-step breakdown of the solution:
Step 1: Understand the Concept of Zeros
A zero of a function is a value of x for which f(x)=0. If a function has five distinct zeros, it means that the graph of the function intersects the x-axis at five different points.
Hint: Remember that each intersection with the x-axis represents a zero of the function.
Step 2: Analyze Each Option
We will examine each option to count the number of x-intercepts (where the graph crosses the x-axis).
- Option A: Count the x-intercepts.
- The graph intersects the x-axis at 1, 2, 3, and 4 points.
- Therefore, it has 4 distinct zeros.
Hint: Look for how many times the graph crosses the x-axis.
- Option B: Count the x-intercepts.
- The graph intersects the x-axis at 1, 2, 3, and 4 points.
- Therefore, it also has 4 distinct zeros.
Hint: Compare the number of x-intercepts with the required number of distinct zeros.
- Option C: Count the x-intercepts.
- The graph intersects the x-axis at 1, 2, 3, 4, 5, and 6 points.
- Therefore, it has 6 distinct zeros.
Hint: Ensure that the number of intercepts matches the required number of distinct zeros.
- Option D: Count the x-intercepts.
- The graph intersects the x-axis at 1, 2, 3, 4, and 5 points.
- Therefore, it has exactly 5 distinct zeros.
Hint: This is the critical step; look for the option that has exactly 5 distinct x-intercepts.
Step 3: Conclusion
After analyzing all the options, we find that only Option D has exactly 5 distinct zeros. Thus, the complete graph of the function f with five distinct zeros is represented by Option D.
Final Answer: The answer is Option D.
A zero of a function is a value of x for which f(x)=0. If a function has five distinct zeros, it means that the graph of the function intersects the x-axis at five different points.
We will examine each option to count the number of x-intercepts (where the graph crosses the x-axis).
- The graph intersects the x-axis at 1, 2, 3, and 4 points.
- Therefore, it has 4 distinct zeros.
- The graph intersects the x-axis at 1, 2, 3, and 4 points.
- Therefore, it also has 4 distinct zeros.
- The graph intersects the x-axis at 1, 2, 3, 4, 5, and 6 points.
- Therefore, it has 6 distinct zeros.
- The graph intersects the x-axis at 1, 2, 3, 4, and 5 points.
- Therefore, it has exactly 5 distinct zeros.
After analyzing all the options, we find that only Option D has exactly 5 distinct zeros. Thus, the complete graph of the function f with five distinct zeros is represented by Option D.
Similar Questions
The range of the polynomial function f is the set of real numbers less than or equal to 4. If the zeros of f are −3 and 1, which of the following could be the graph of y = f (x) in the xy-plane?
02:58View Solution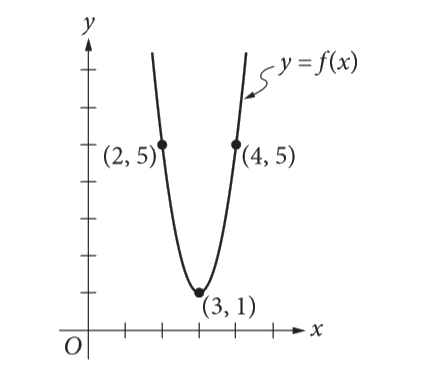
The graph of the function f in the xy-plane above is a parabola. Which of the following defines f ?02:27View Solutionf (x) = (x + 3)(x − k)
T he function f is defined above. If k is a positive integer, which of the following could represent the graph of y = f (x) in the xy-plane?05:00View SolutionIn the xy-plane, the graph of function f has x-intercepts at -3, -1, and 1. Which of the following could define f ?
01:17View Solution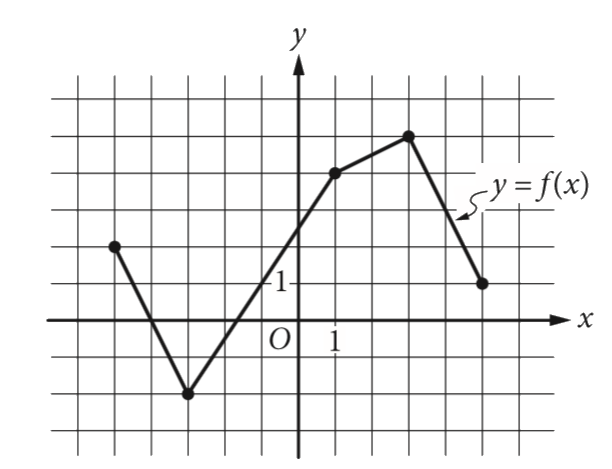
The complete graph of the function f is shown in the xy-plane above. For what value of x is the value of f(x) at its minimum?02:21View Solution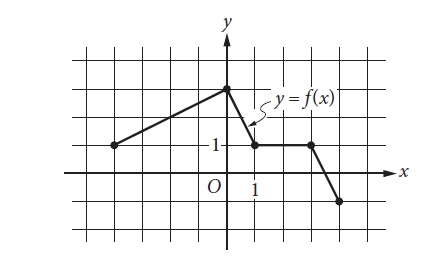
The complete graph of the function f is shown in the xy-plane above. Which of the following are equal to 1 ?
I. f(−4)
II. f(32)
III. f(3)05:16View Solutionf(x)=2x+1
The function f is defined by the equation above which of the following is the graph of y=−f(x) in the xy-plane?02:35View Solution

