A student performs an experiment to determine the acceleration due to gravity g. The student throws a steel ball up with initial velocity u and measures the height h travelled by it at different times t. The graph the student should plot on a graph paper to readily obtain the value of g is
h versus t.
h versus t2
h versus √t
ht versus t
The correct Answer is:D
Step by step video, text & image solution for A student performs an experiment to determine the acceleration due to gravity g. The student throws a steel ball up with initial velocity u and measures the height h travelled by it at different times t. The graph the student should plot on a graph paper to readily obtain the value of g is by Physics experts to help you in doubts & scoring excellent marks in Class 12 exams.
Updated on:21/07/2023Topper's Solved these Questions
Similar Questions
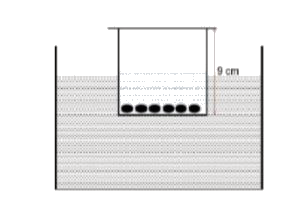
A wide bottom cylindrical massless plastic container of height 9 cm has 40 identical coins inside it and is floating on water with 3 cm inside the water. If we start putting more of such coins on its lid. It is observed that after N coins are put, its equilibrium changes from stable to unstable. Equilibrium in floating is stable if the geometric center of the submerged portion is above the center of mass of the object) The value of N is closed to

View SolutionA student performs an experiment an for determination of g(=(4pi^(2)l)/(T^(2))) . The error in length l is Deltal and in time T is DeltaT and n is number of times the reading is taken. The measurment of g is most accurate for
View SolutionA student measures the focal length of a convex lens by putting an object pin at a distance u from the lens and measuring the distance v of the image pin. The graph between u and v plotted by the student should look like
View SolutionWhile measuring acceleration due to gravity by a simple pendulum , a student makes a positive error of 2% in the length of the pendulum and a positive error of 1% in the measurement of the value of g will be
View SolutionFour students measure the height of a tower. Each student uses a different method and each measures the height many different times. The data for each are plotted below. The measurement with highest precision is
View SolutionIn an experiment on simple pendulum to determine the acceleration due to gravity, a student measures the elngth of the thread as 632 cm and diameter of the pendulum bob as 2.256 cm. The student should take the lenght of the pendulum to be
View SolutionThe distance s travelled by a particle in time t is s=ut-(1)/(2)g t^(2) The initial velocity of the particle was measured to be u = 1.11pm0.01 m/s and the time interval of the experiment was t=1.01pm0.1 s. The acceleration was taken to be g g=9.8pm0.1m//s^(2) .With these measurements, the student estimates the total distance travelled. How should the student report the result ?
View SolutionIn an experiment of determine acceleration due to gravity by simple pendulum, a student commits 1% positive error in the measurement of length and 3% negative error in the time then % error in g will be
View SolutionA student measures the focal length of a convex lens by putting an object pin at a distance u from the lens and measuring the distance V of the image pin. The graph between u and V plotted by the student should look like
View SolutionA student measures the focal length of a convex lens by putting an object pin at a distance u from the lens and measuring the distance v of the image pin. The graph between u and v plotted by the student should look like
View SolutionA student measures the focal length of a convex lens by putting an object pin at a distance u from the lens and measuring the distance v of the image pin. The graph between u and v plotted by the student should look like
View SolutionAn object is projected vertifxlly up with an initial velocity u and is allowed to fallunder gravity. Draw its Acceleration-time graph
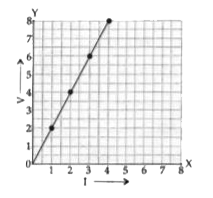
View SolutionA student while conducting an experiment on Ohm's law, plotted the graph according to the given data. Find the slope of the line obtained.


View SolutionDraw a velocity-time graph for a body moving with an initial velocity u and uniform acceleration a. Use this graph to find the distance travelled by the body in time t.
View SolutionWhile measuring acceleration due to gravity by a simple pendulum , a student makes a positive error of 2% in the length of the pendulum and a positive error of 1% in the measurement of the value of g will be
View Solution