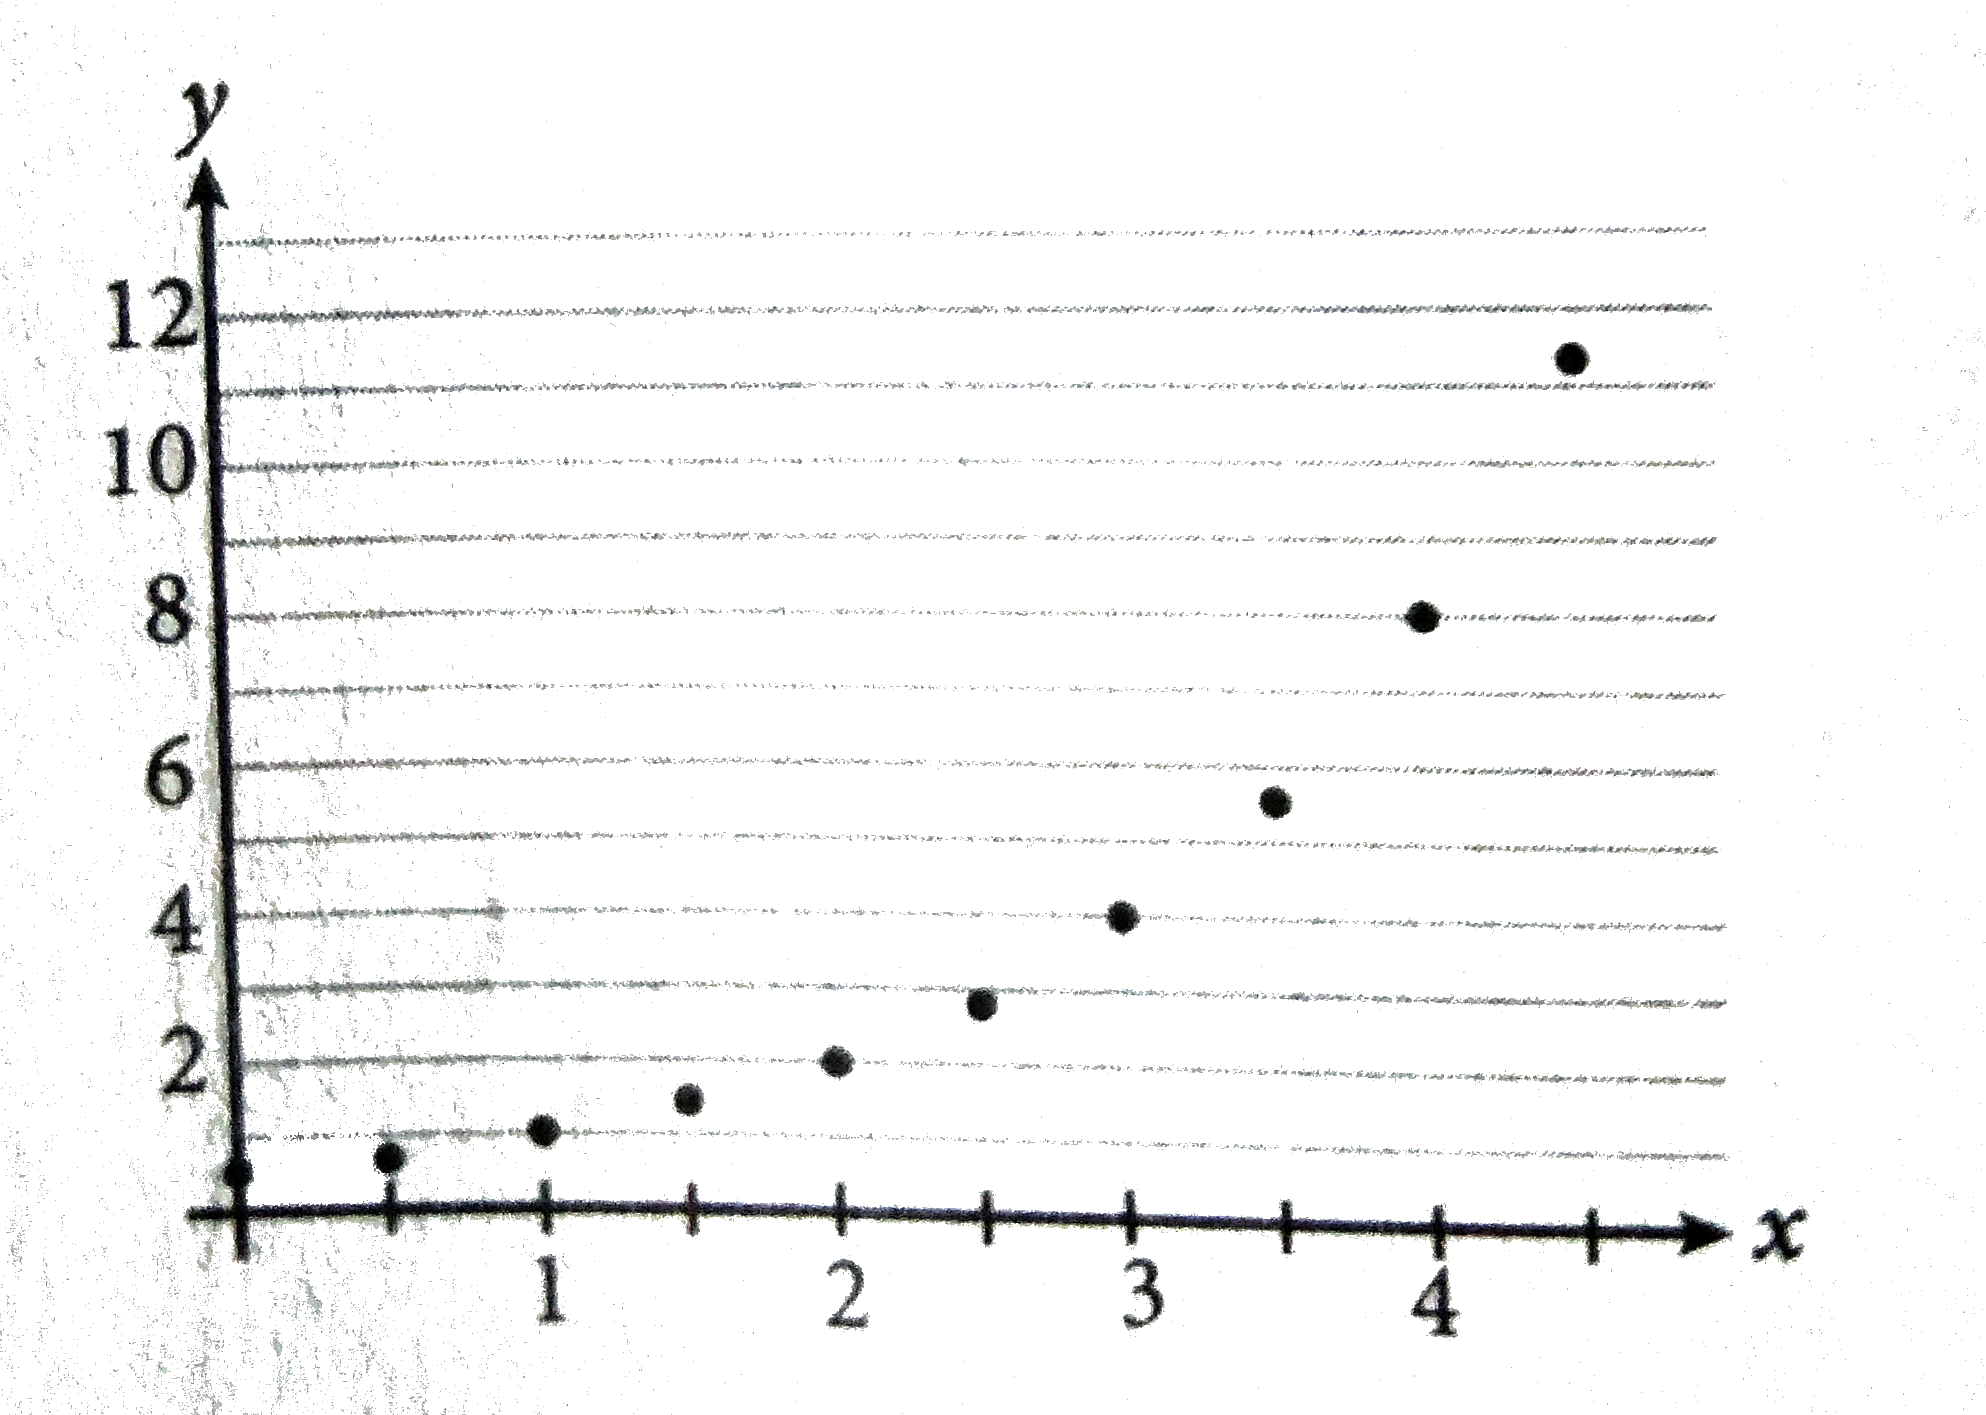
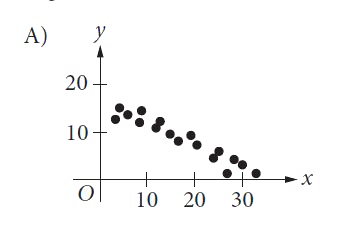
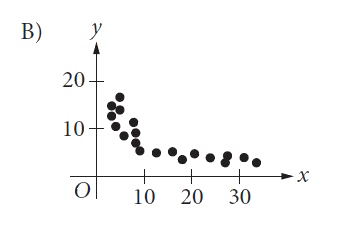
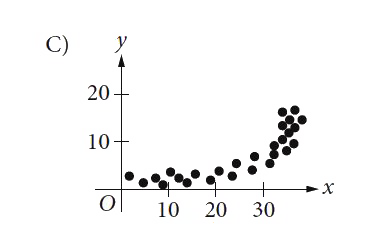
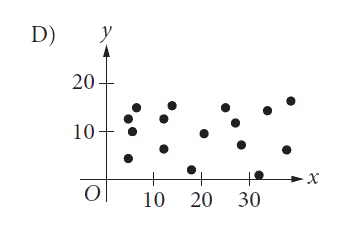
Which of the following scatterplots shows a relationship that is appropriately modeled with the equation y=axb , where a is positive and b is negative?
A
B
C
D
Text Solution
The correct Answer is:B
The graph of y=axb , where a is positive and b is negative, has a positive y-intercept and rapidly decreases (in particular, decreases at a faster rate than a linear function) toward the x-axis as x increases. Of the scatterplots shown, only the one in choice B would be appropriately modeled by such a function.
Choice A is incorrect, as this scatterplot is appropriately modeled by a linear function. Choice C is incorrect, as this scatterplot is appropriately modeled by an increasing function. Choice D is incorrect, as this scatterplot shows no clear relationship between x and y.
|
Similar Questions
Knowledge Check
Which of the following scatterplots shows a ralationship that is appropriately modeled with the equation y=−ax2+bx−c, where a and c are negative and b is positive ?
A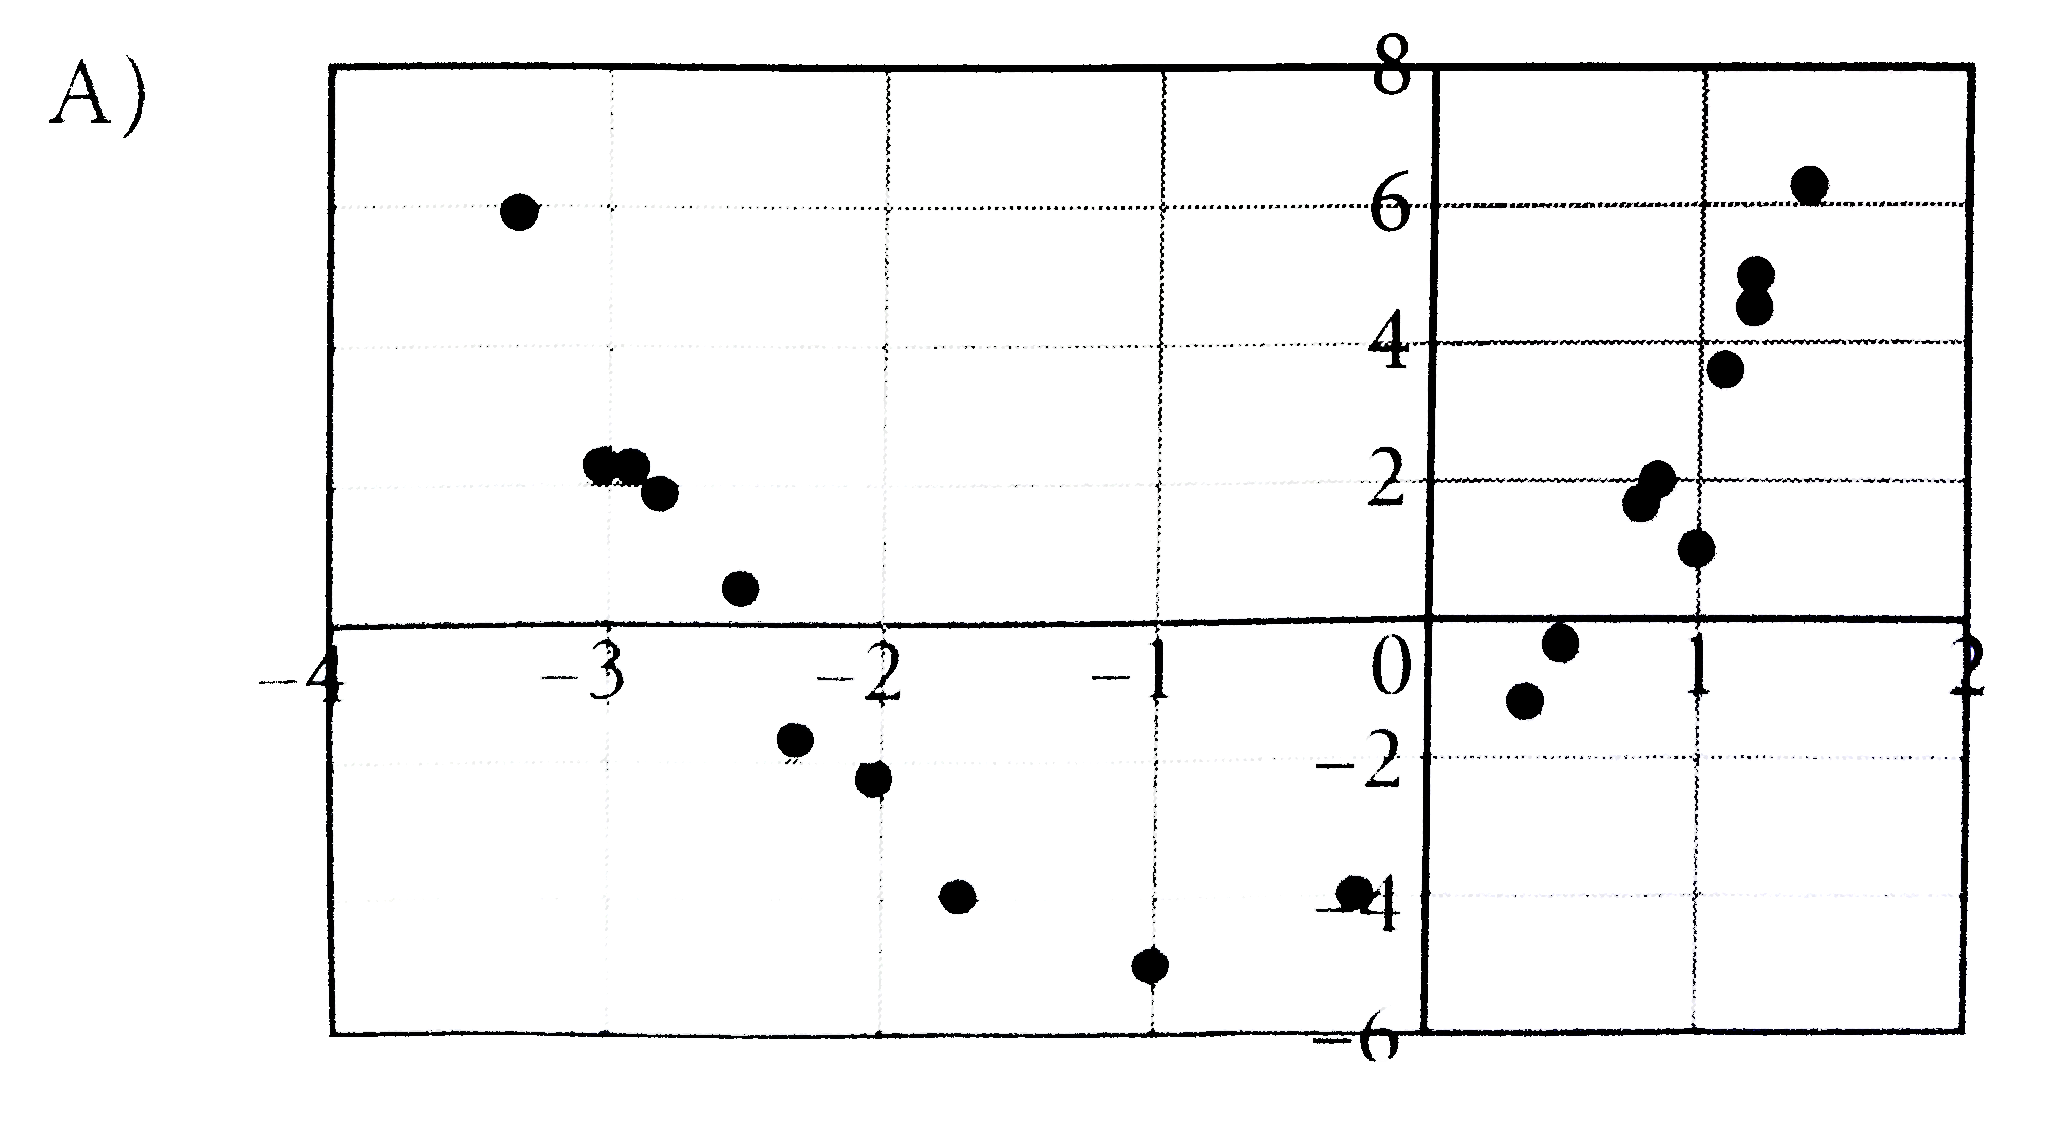 B
B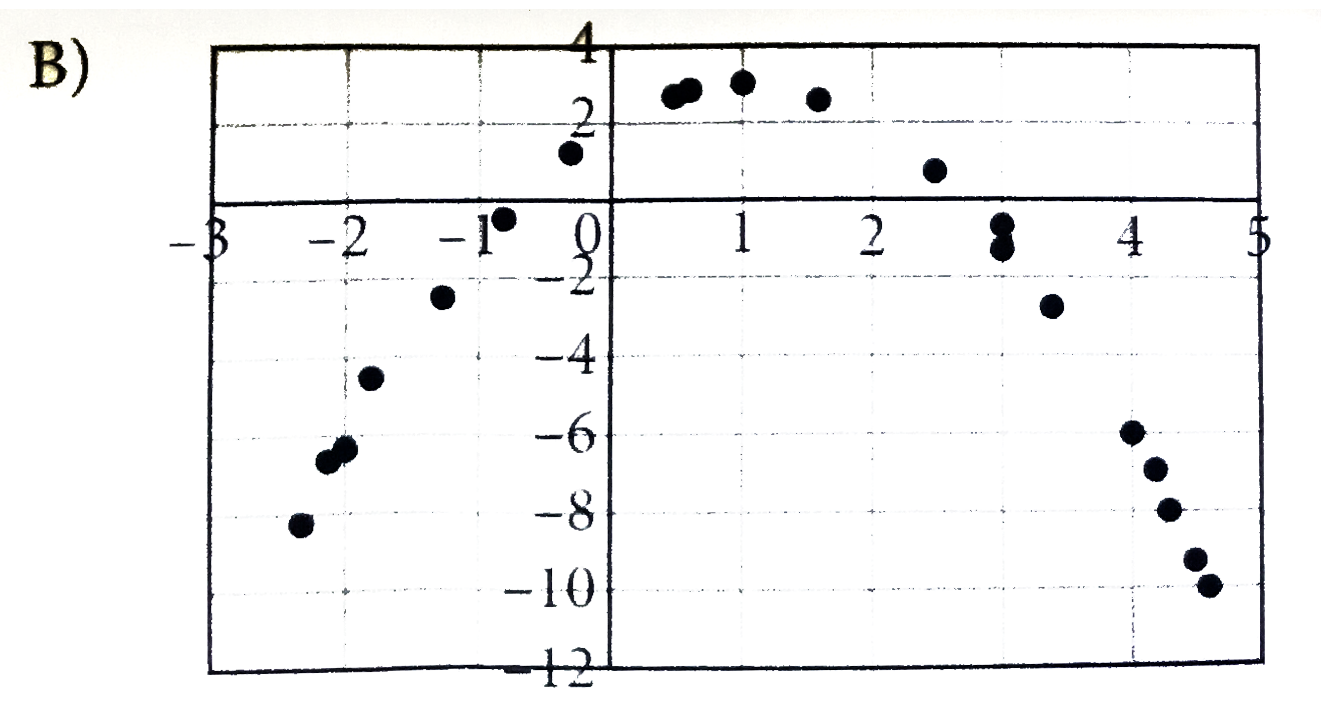 C
C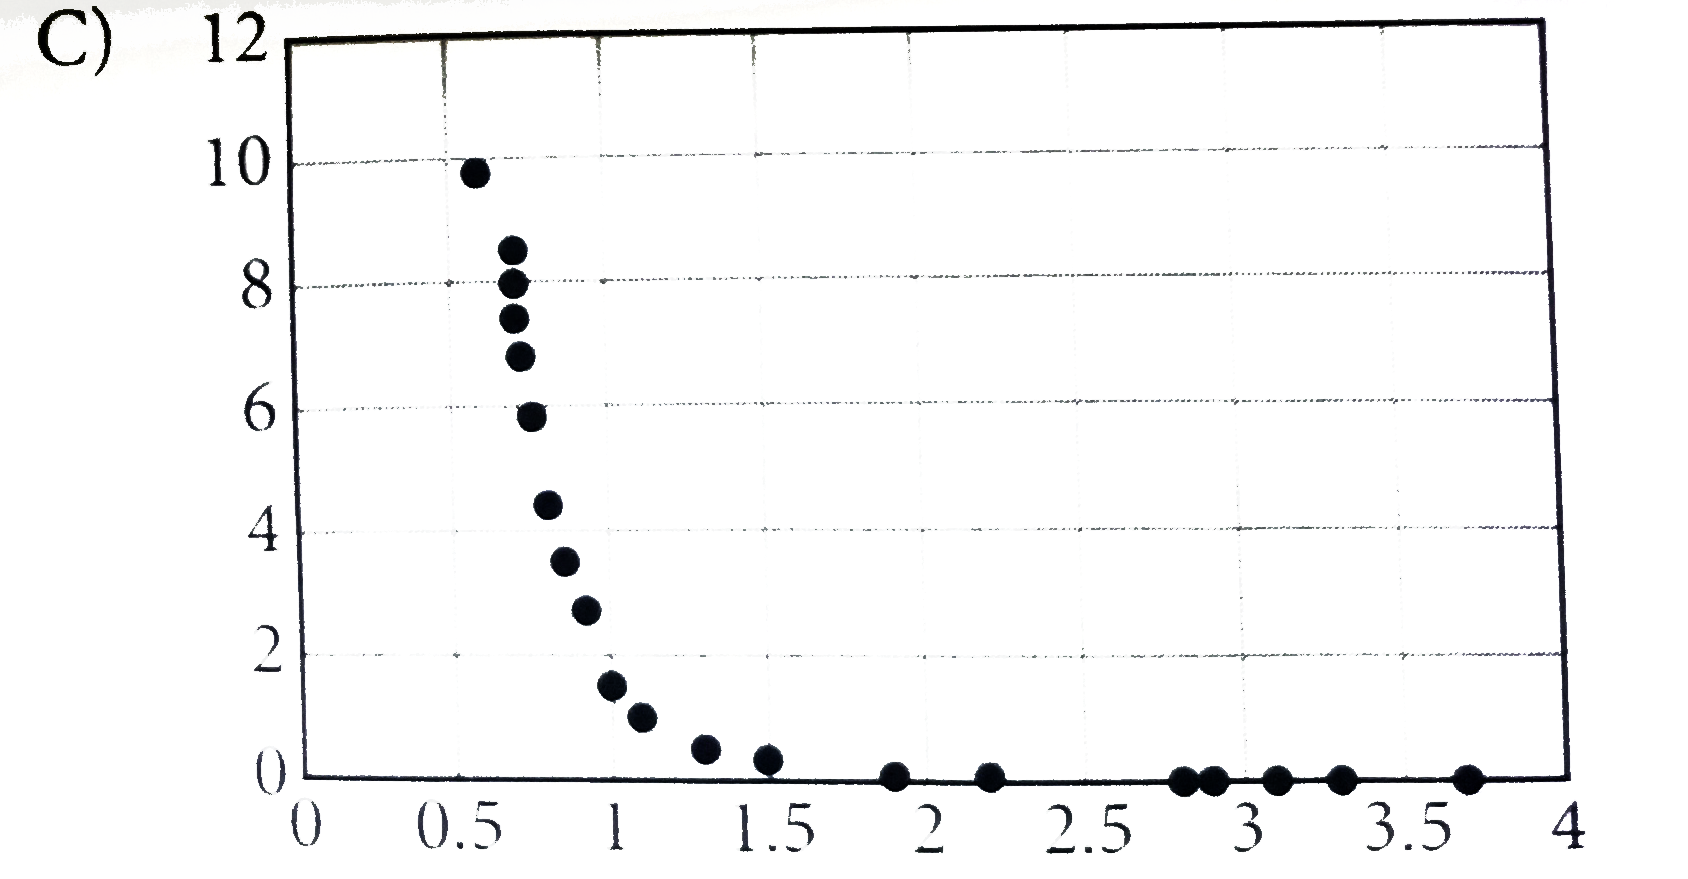 D
D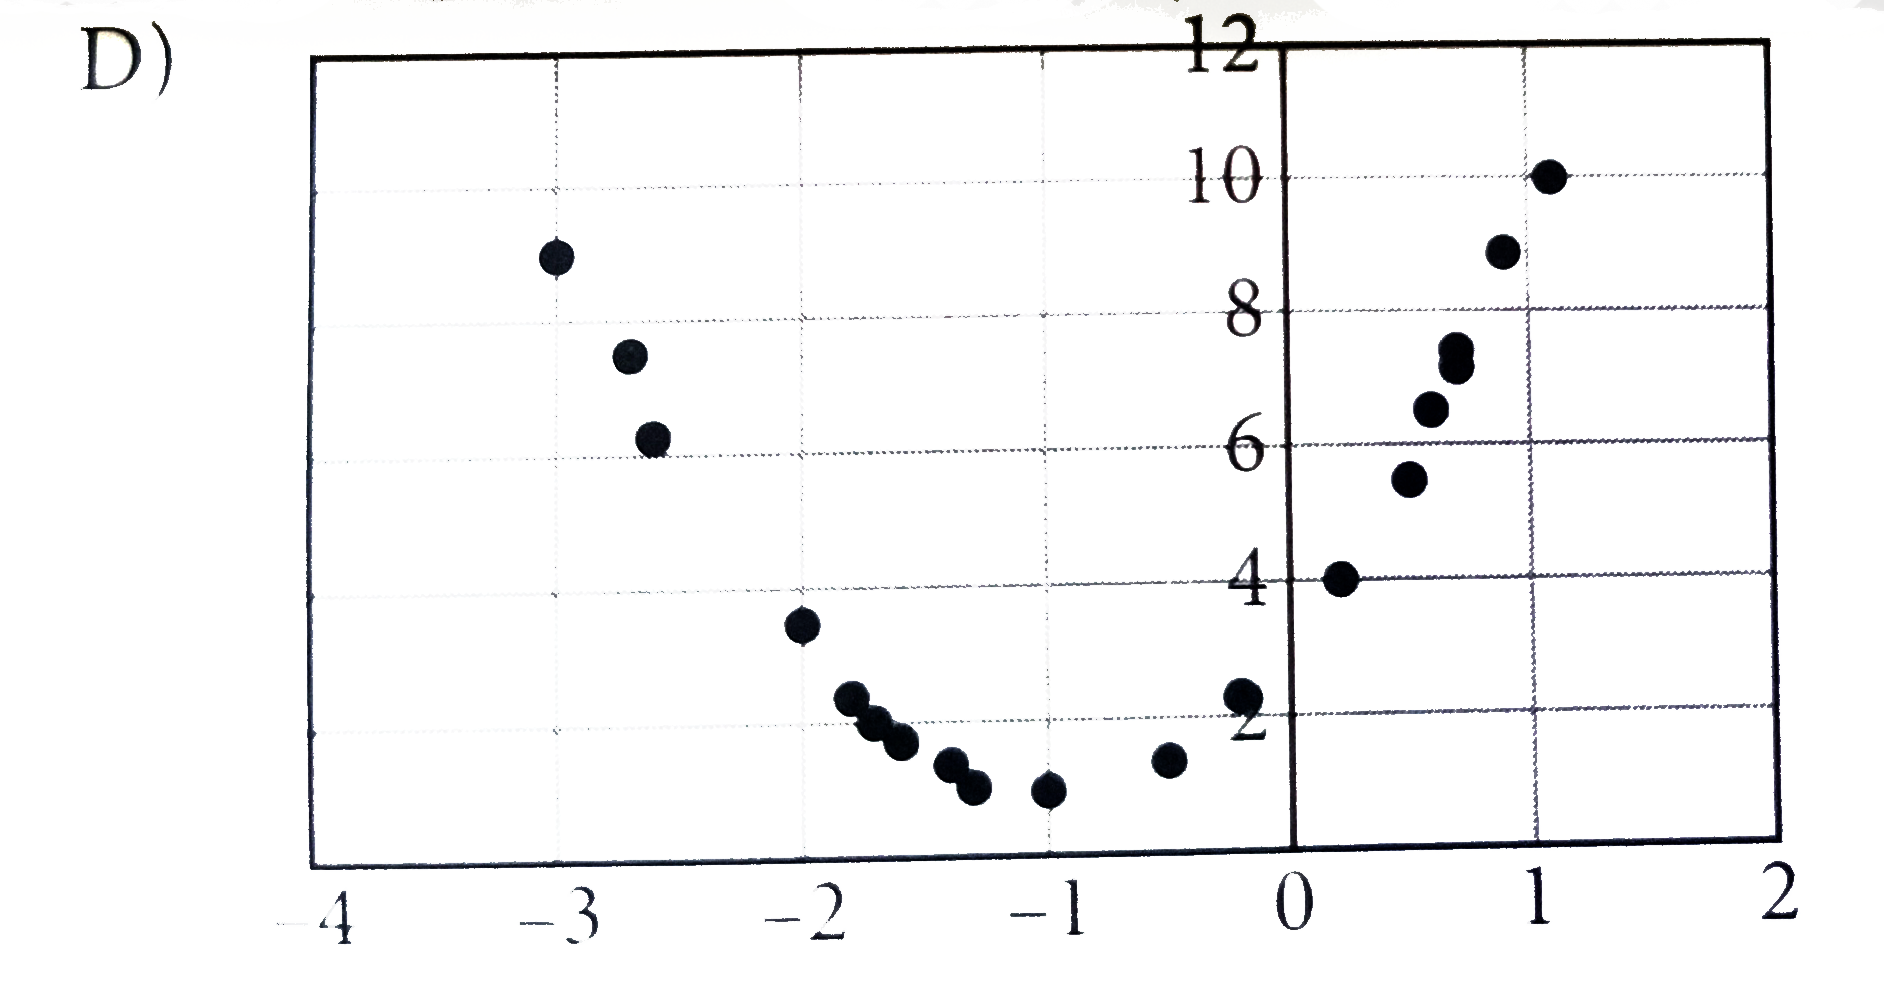
Which of the following scatterplot could be modeled by the equation y=abx, where a and b are constant such that a>1andx<−1?
A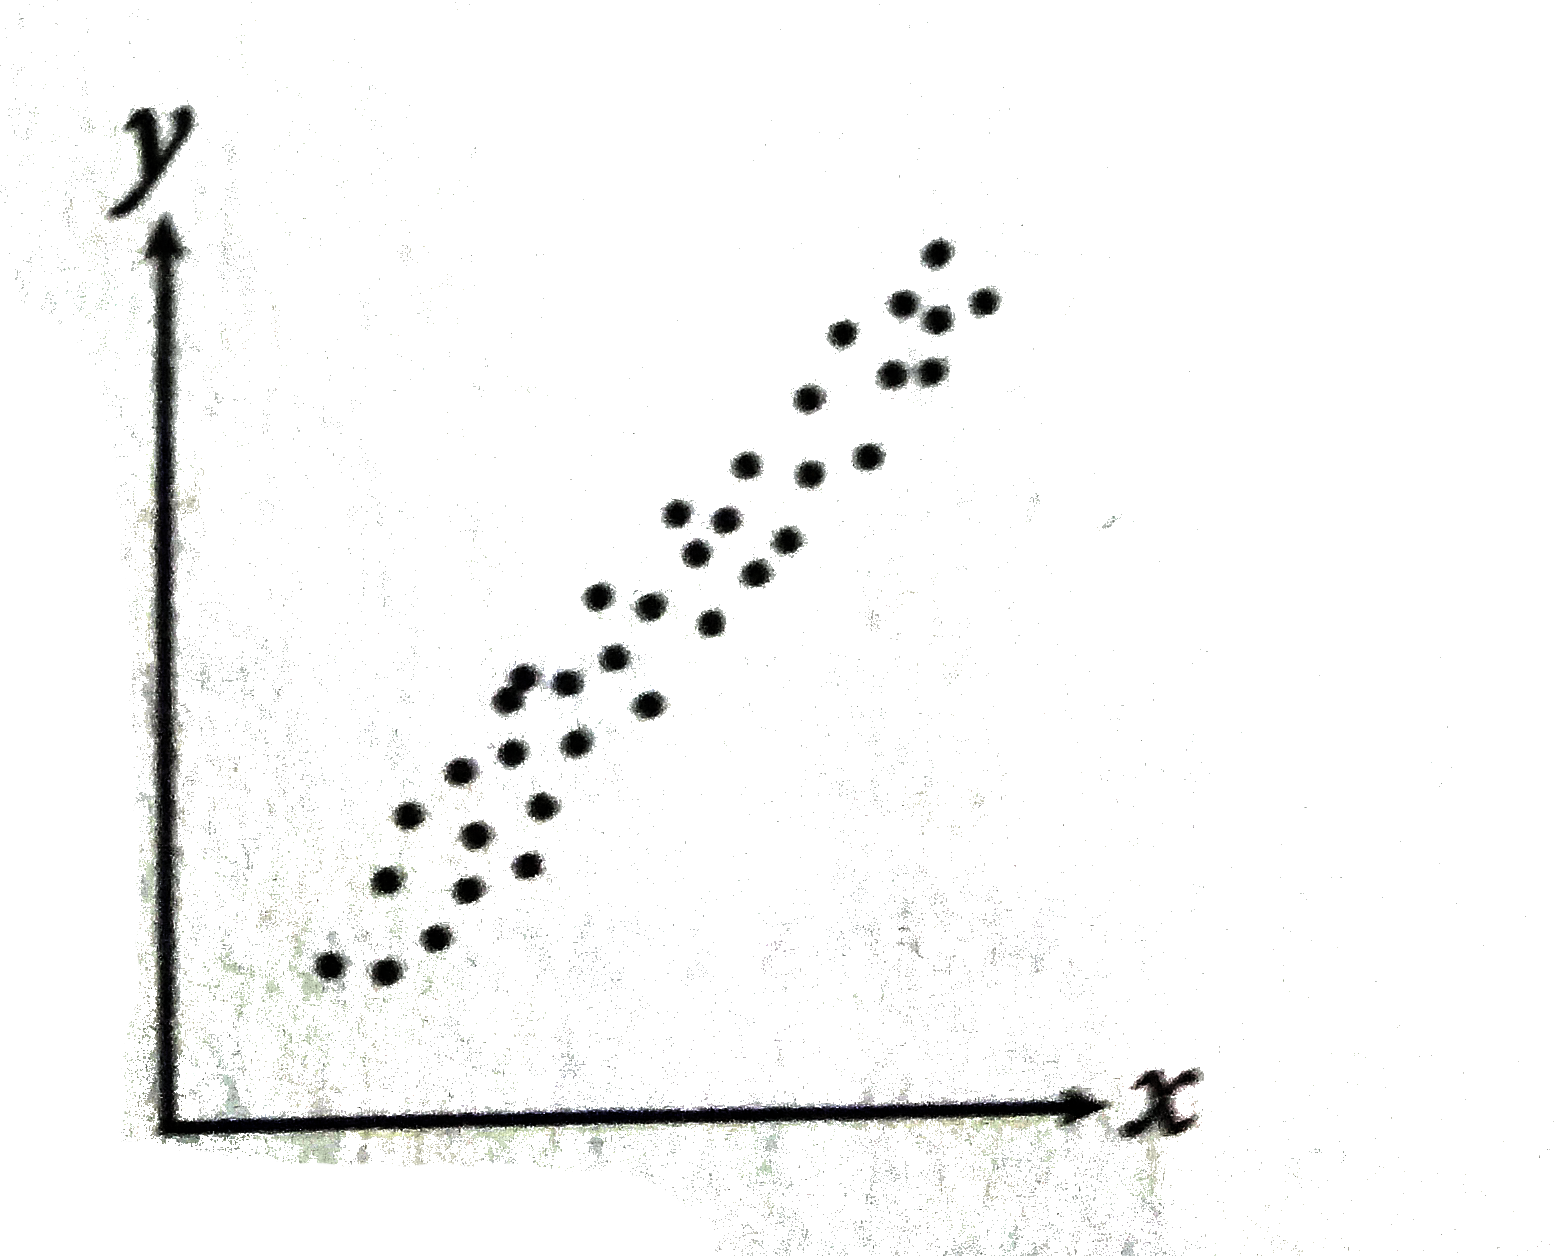 B
B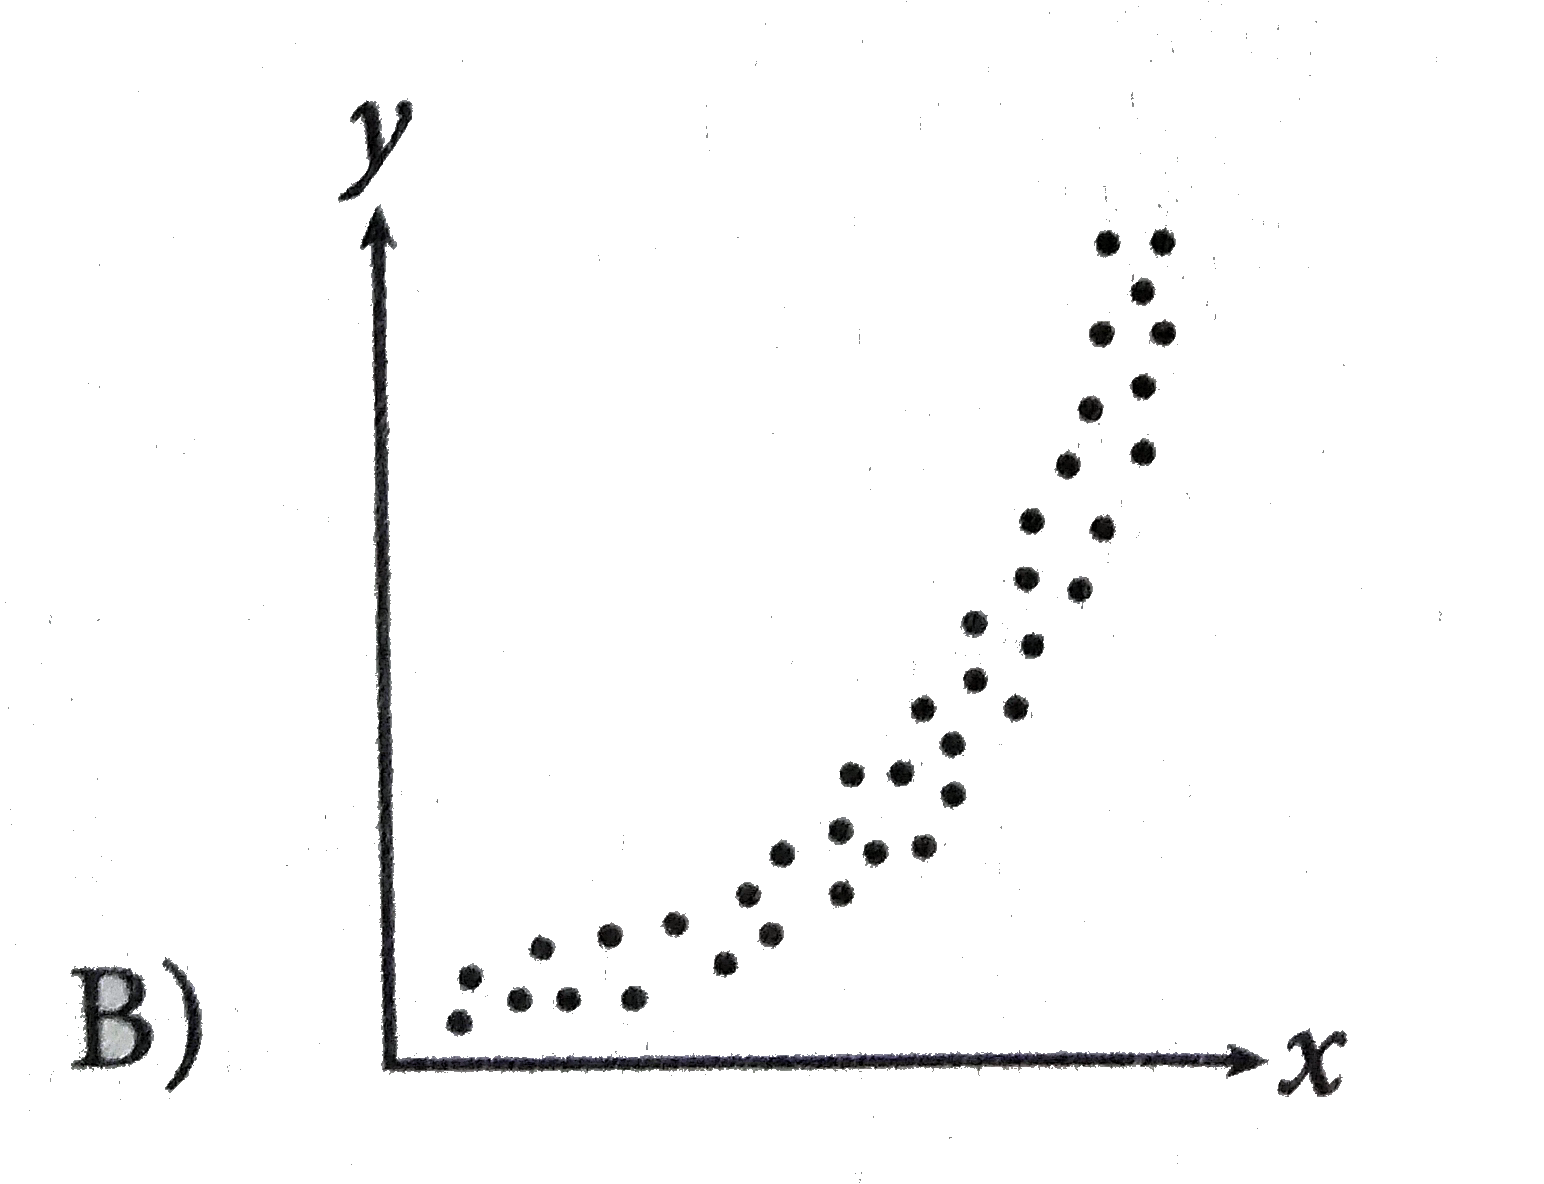 C
C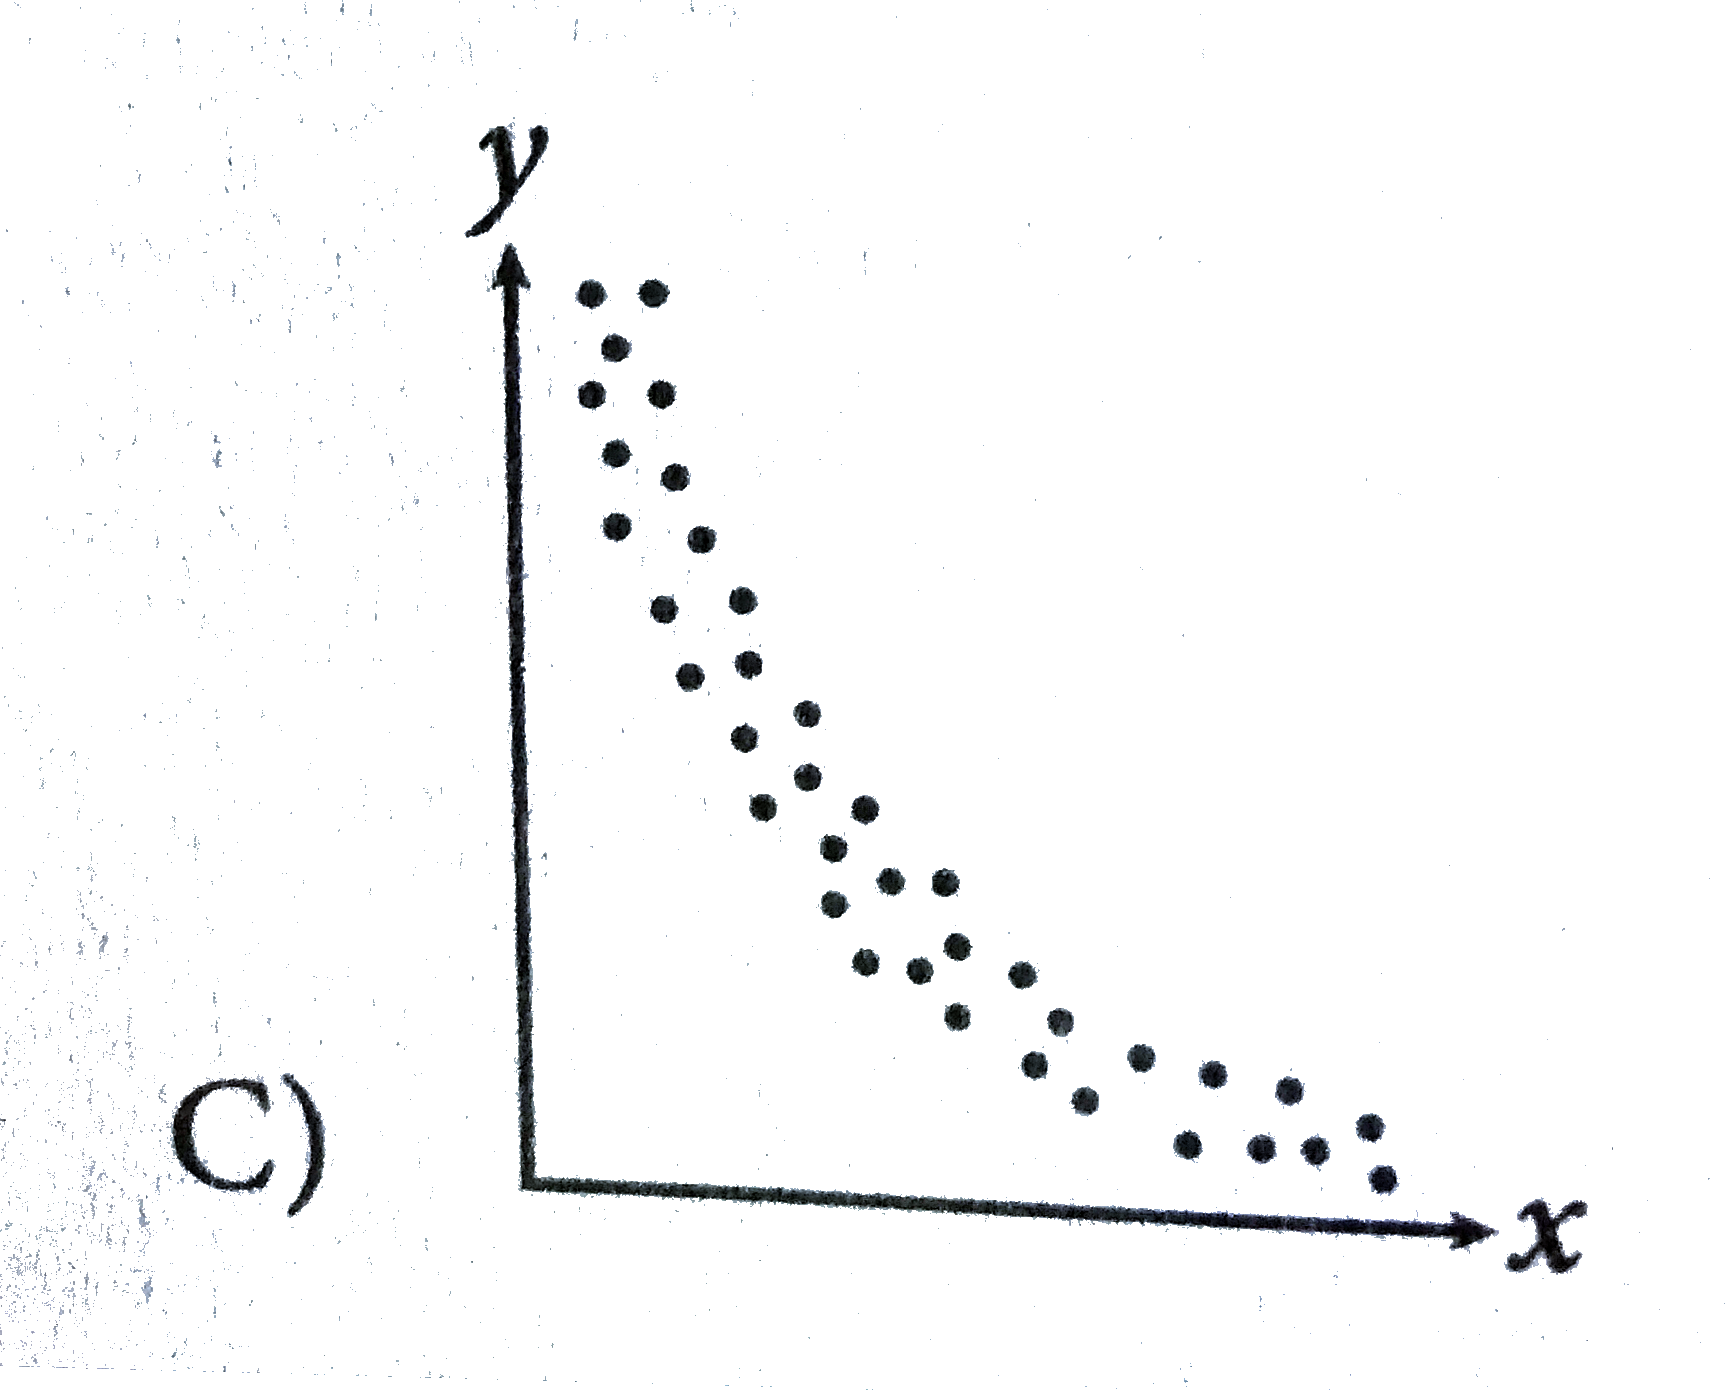 D
D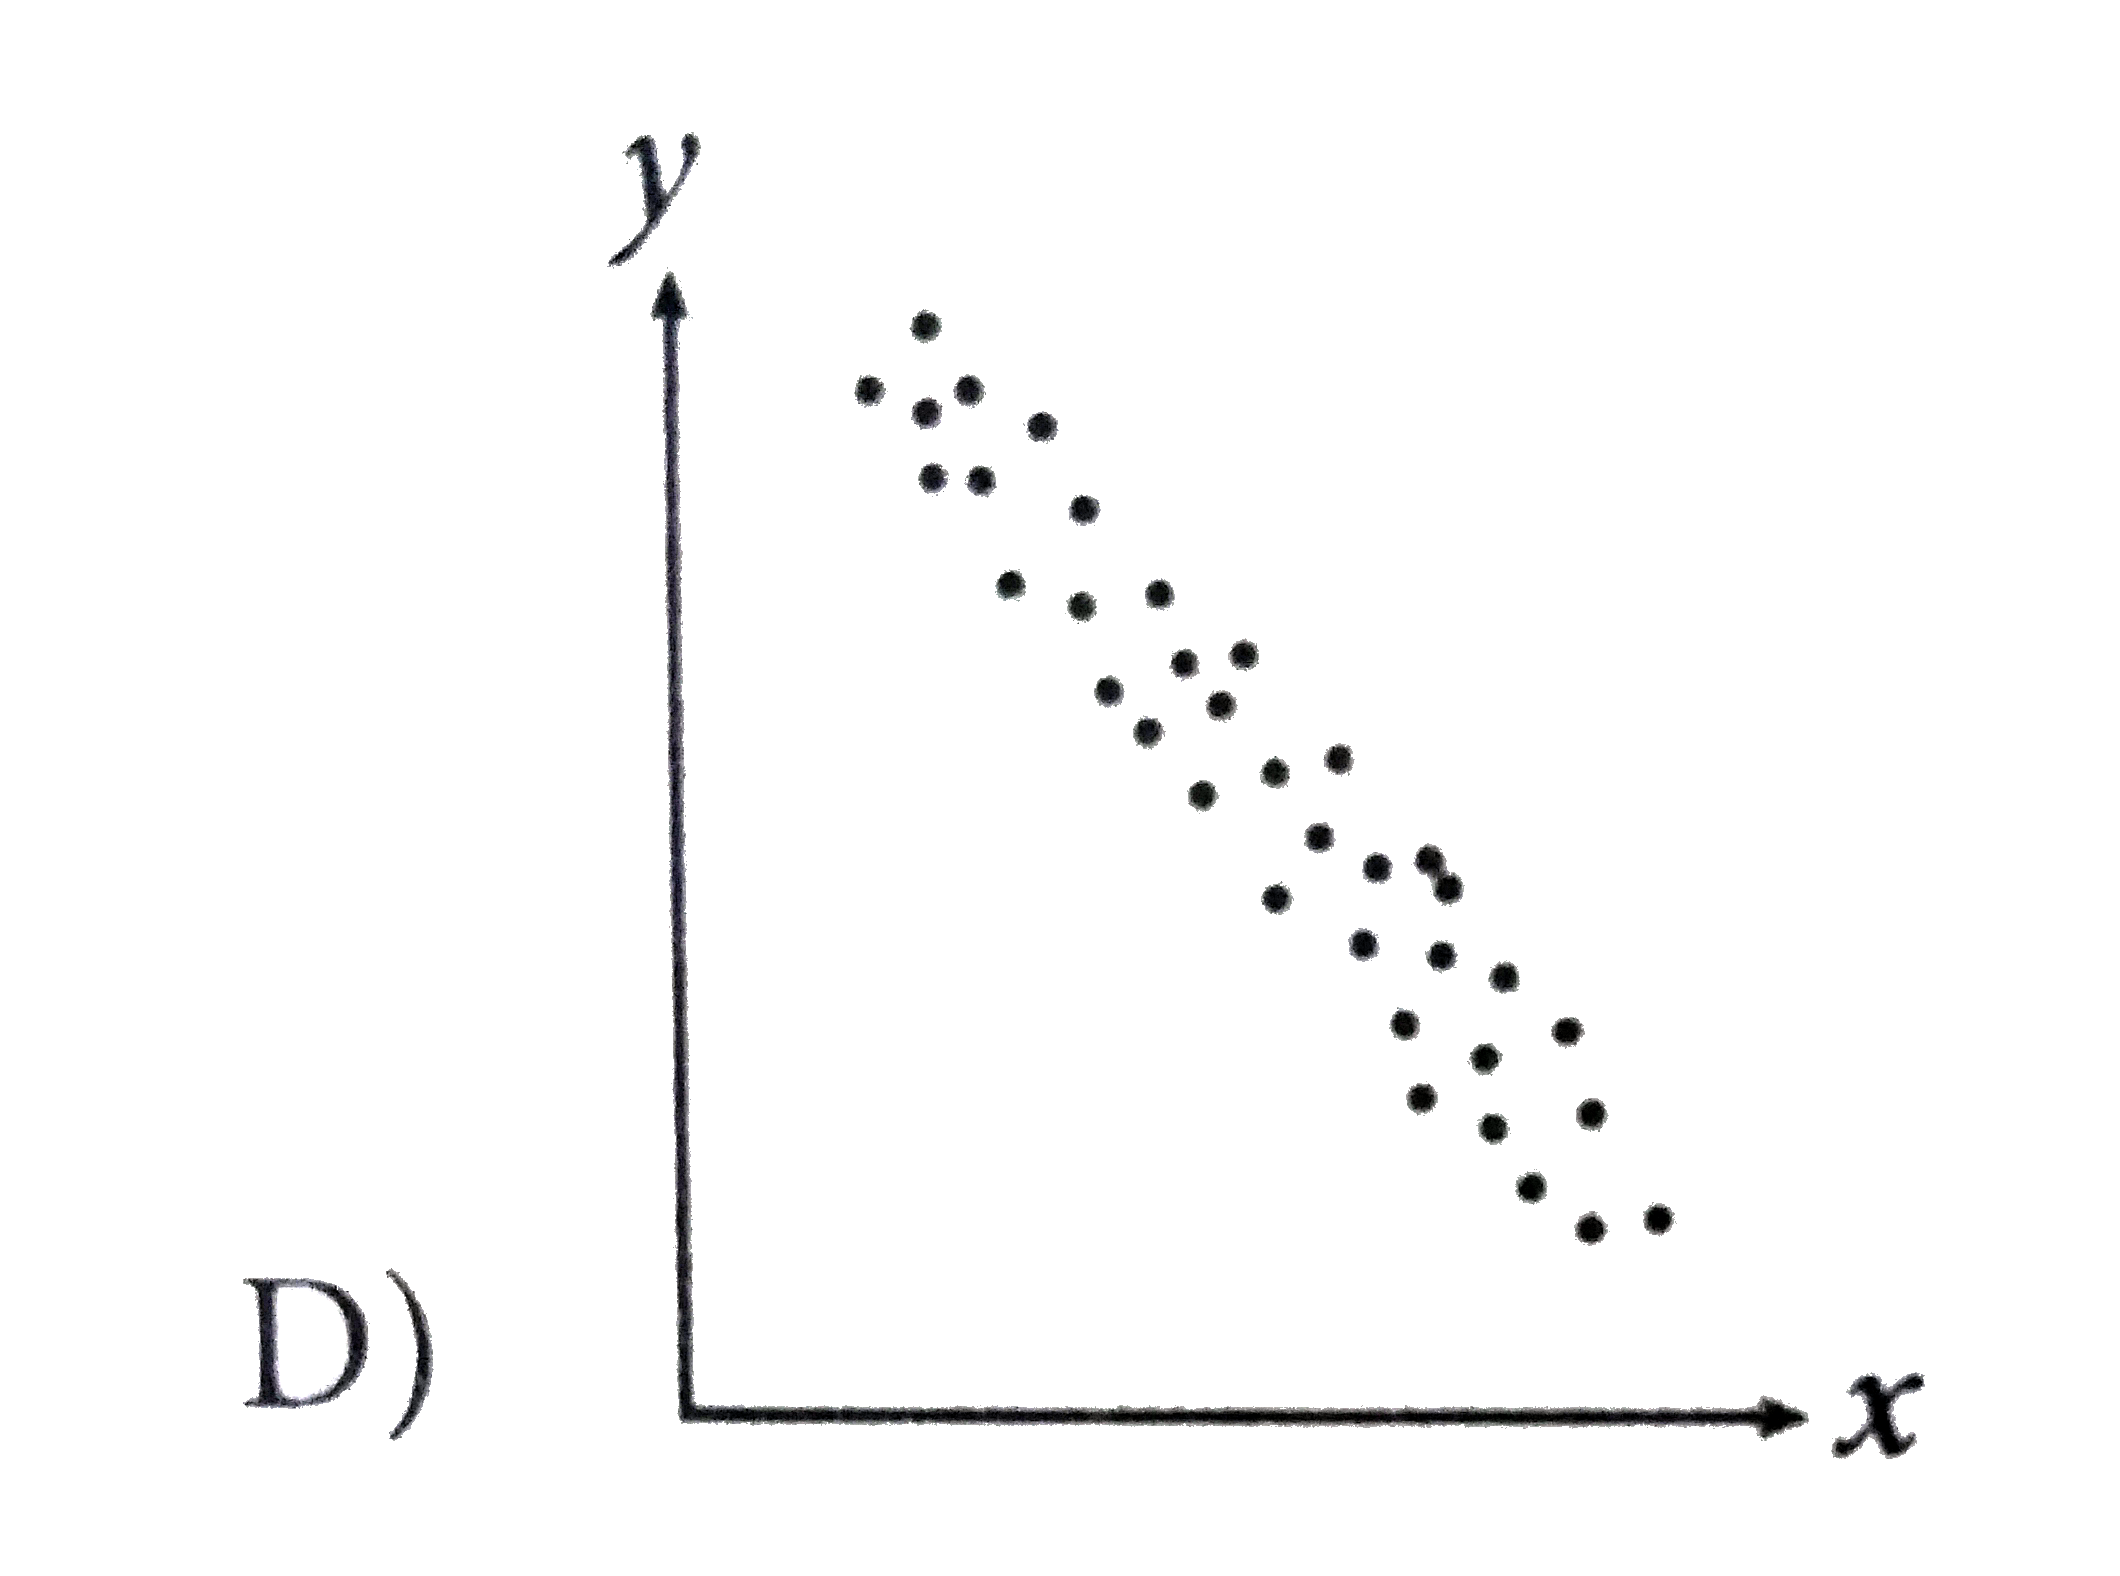
Which one of the following elements shows both positive and negative oxidation states?
ACesiumBFluorineCIodineDXenon
Which one of the following elements shows both positive and negative oxidation states?
View Solution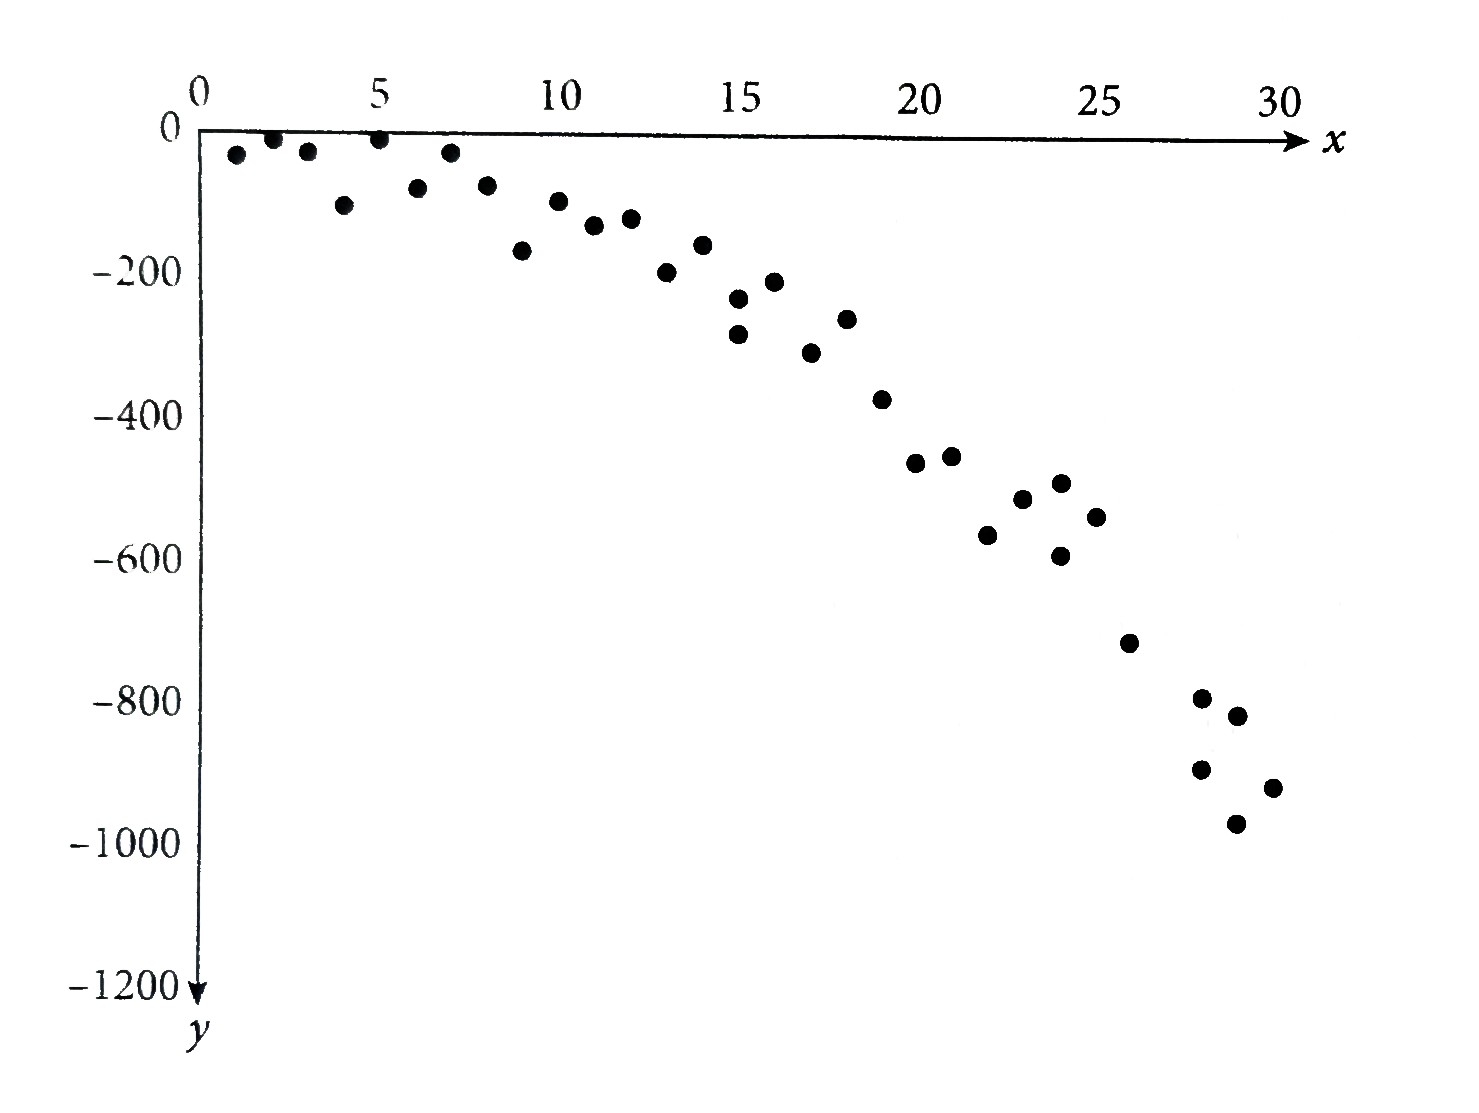
For which of the following values of a and b does the equation y=axb model the data in the scatterplot above ?
View SolutionFor which of the following graphs of the quadratic expression y=ax2+bx+c, the product a.b.c is negative.
View SolutionThe data in which of the following scatterplots would be best modeled by a quadratic function in which the x2 term has a negative coefficient?
View SolutionDuring a snowstorm, the relationship between the depth of accumulated snow , y inches, and the elapsed time, x hours, was modeled by the equation 2x−5y=−5. One of the following graphs in the standard (x,y) coordinate plane models the equation for positive values of x and y. Which one?
View Solution

