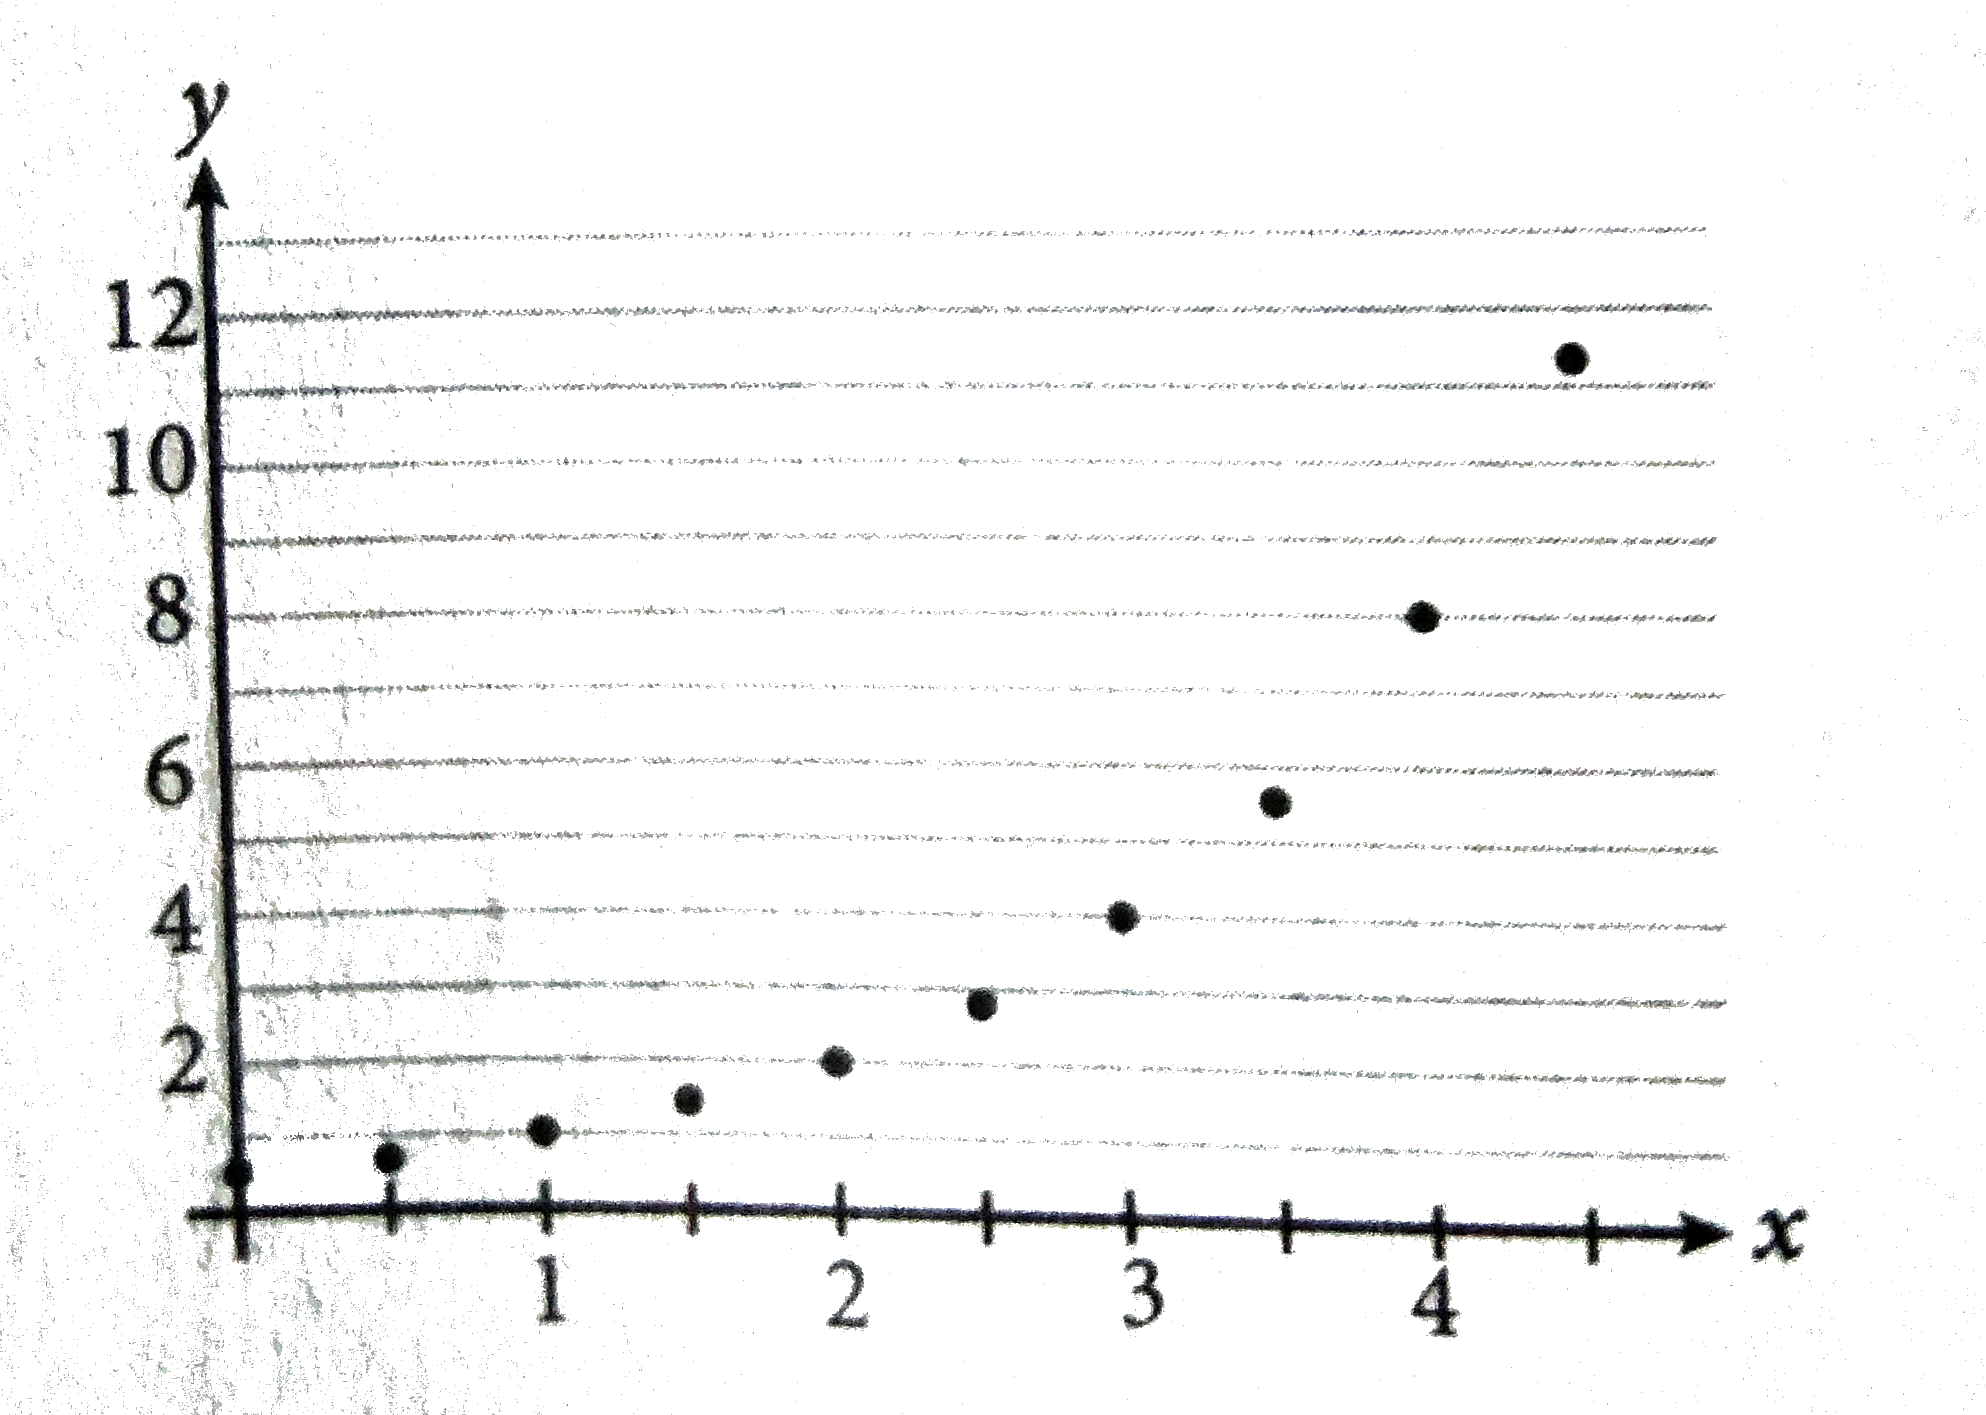
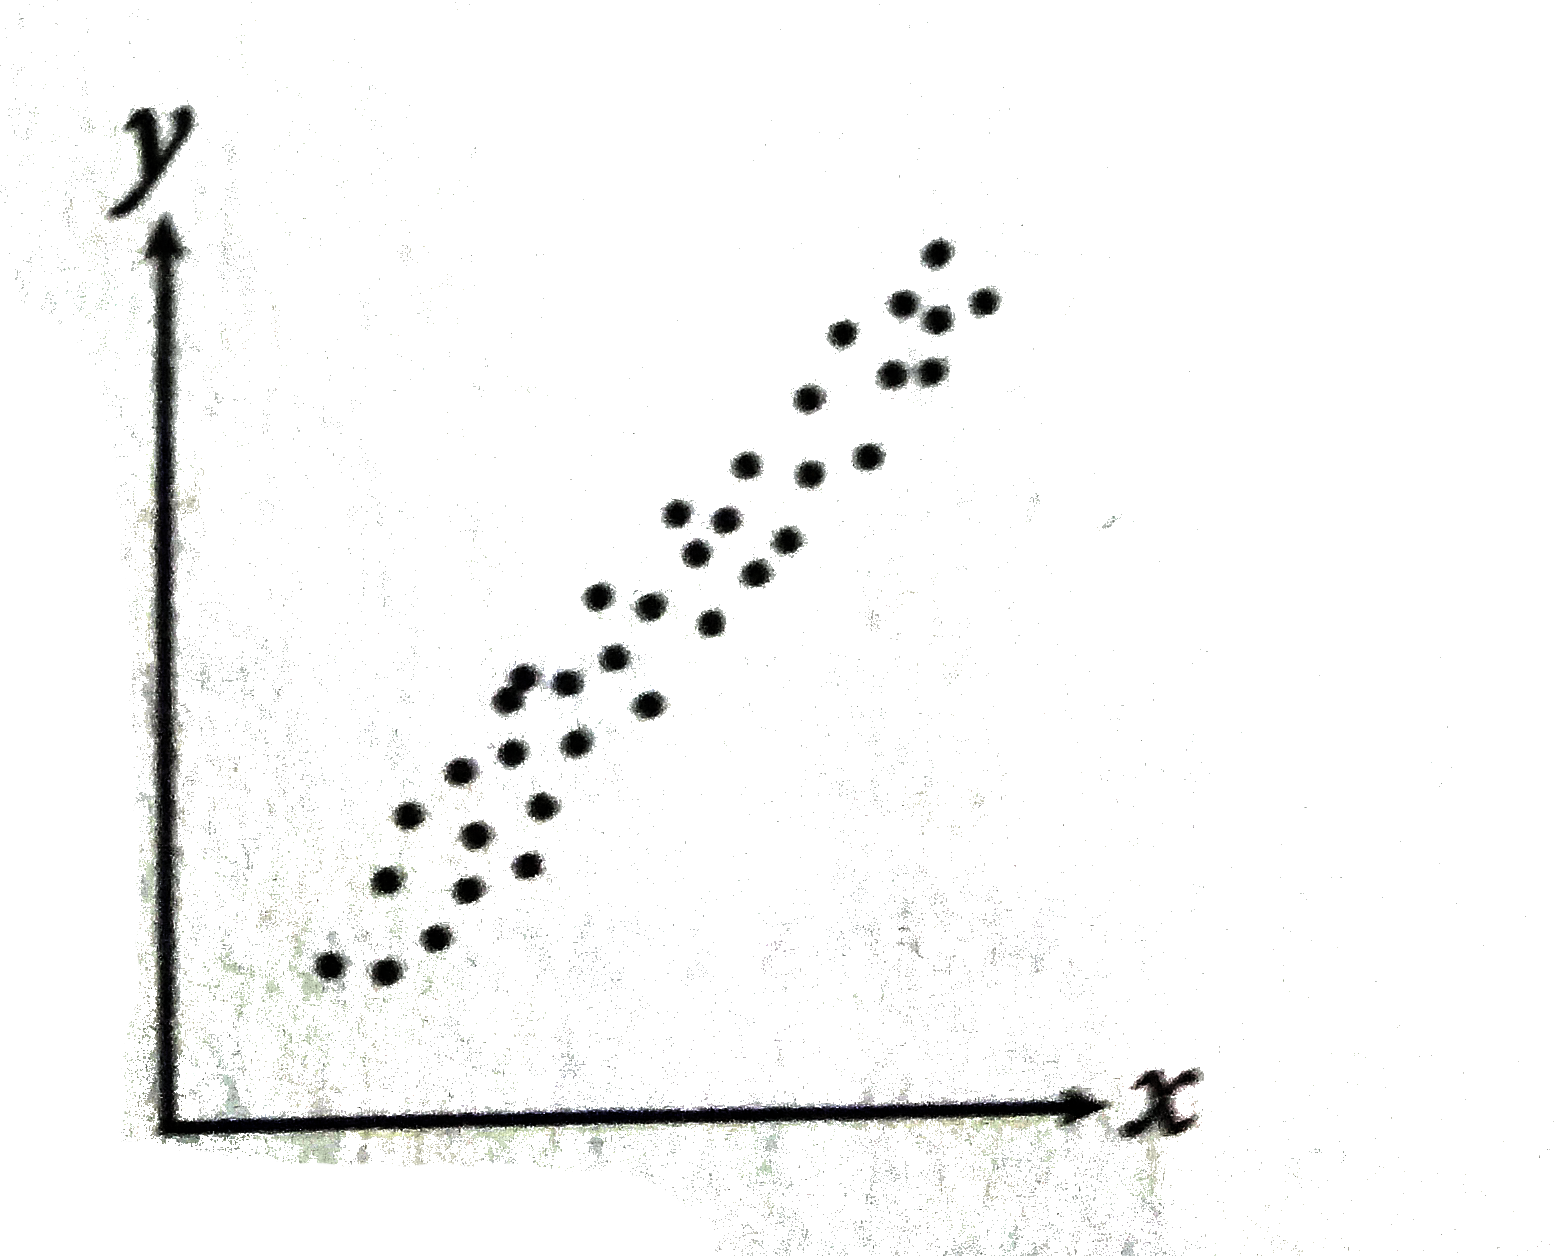
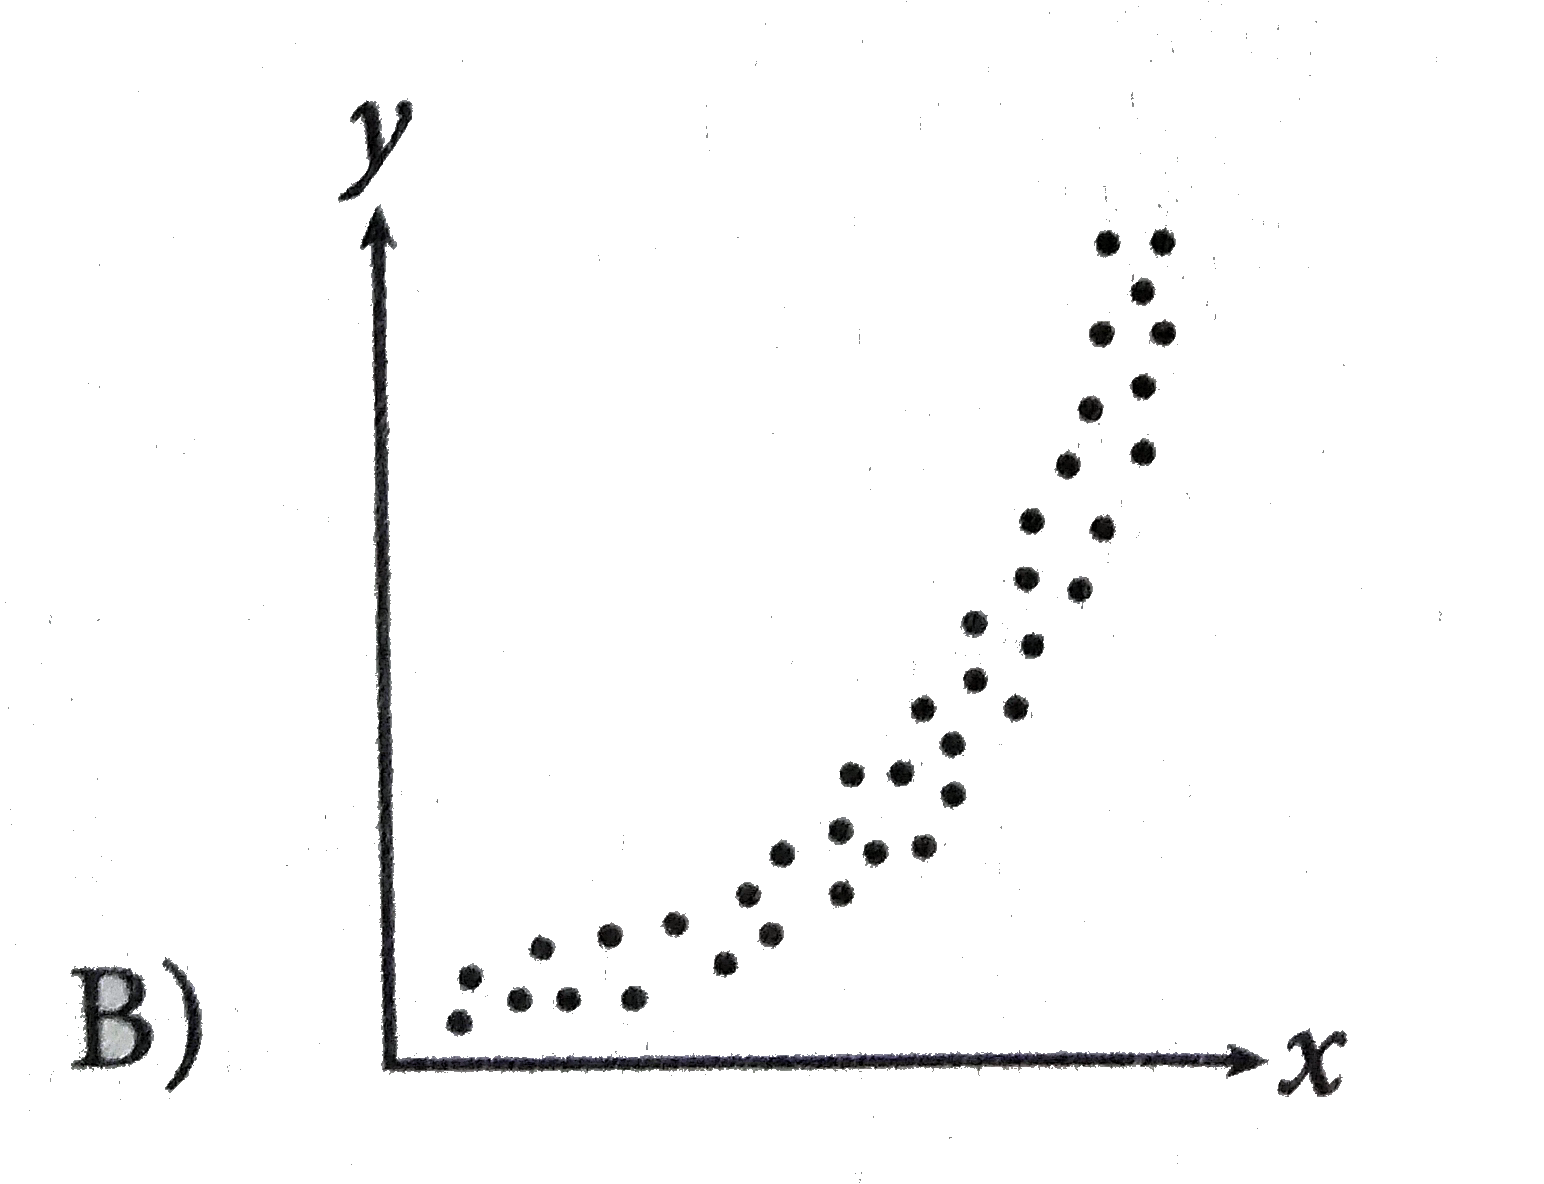
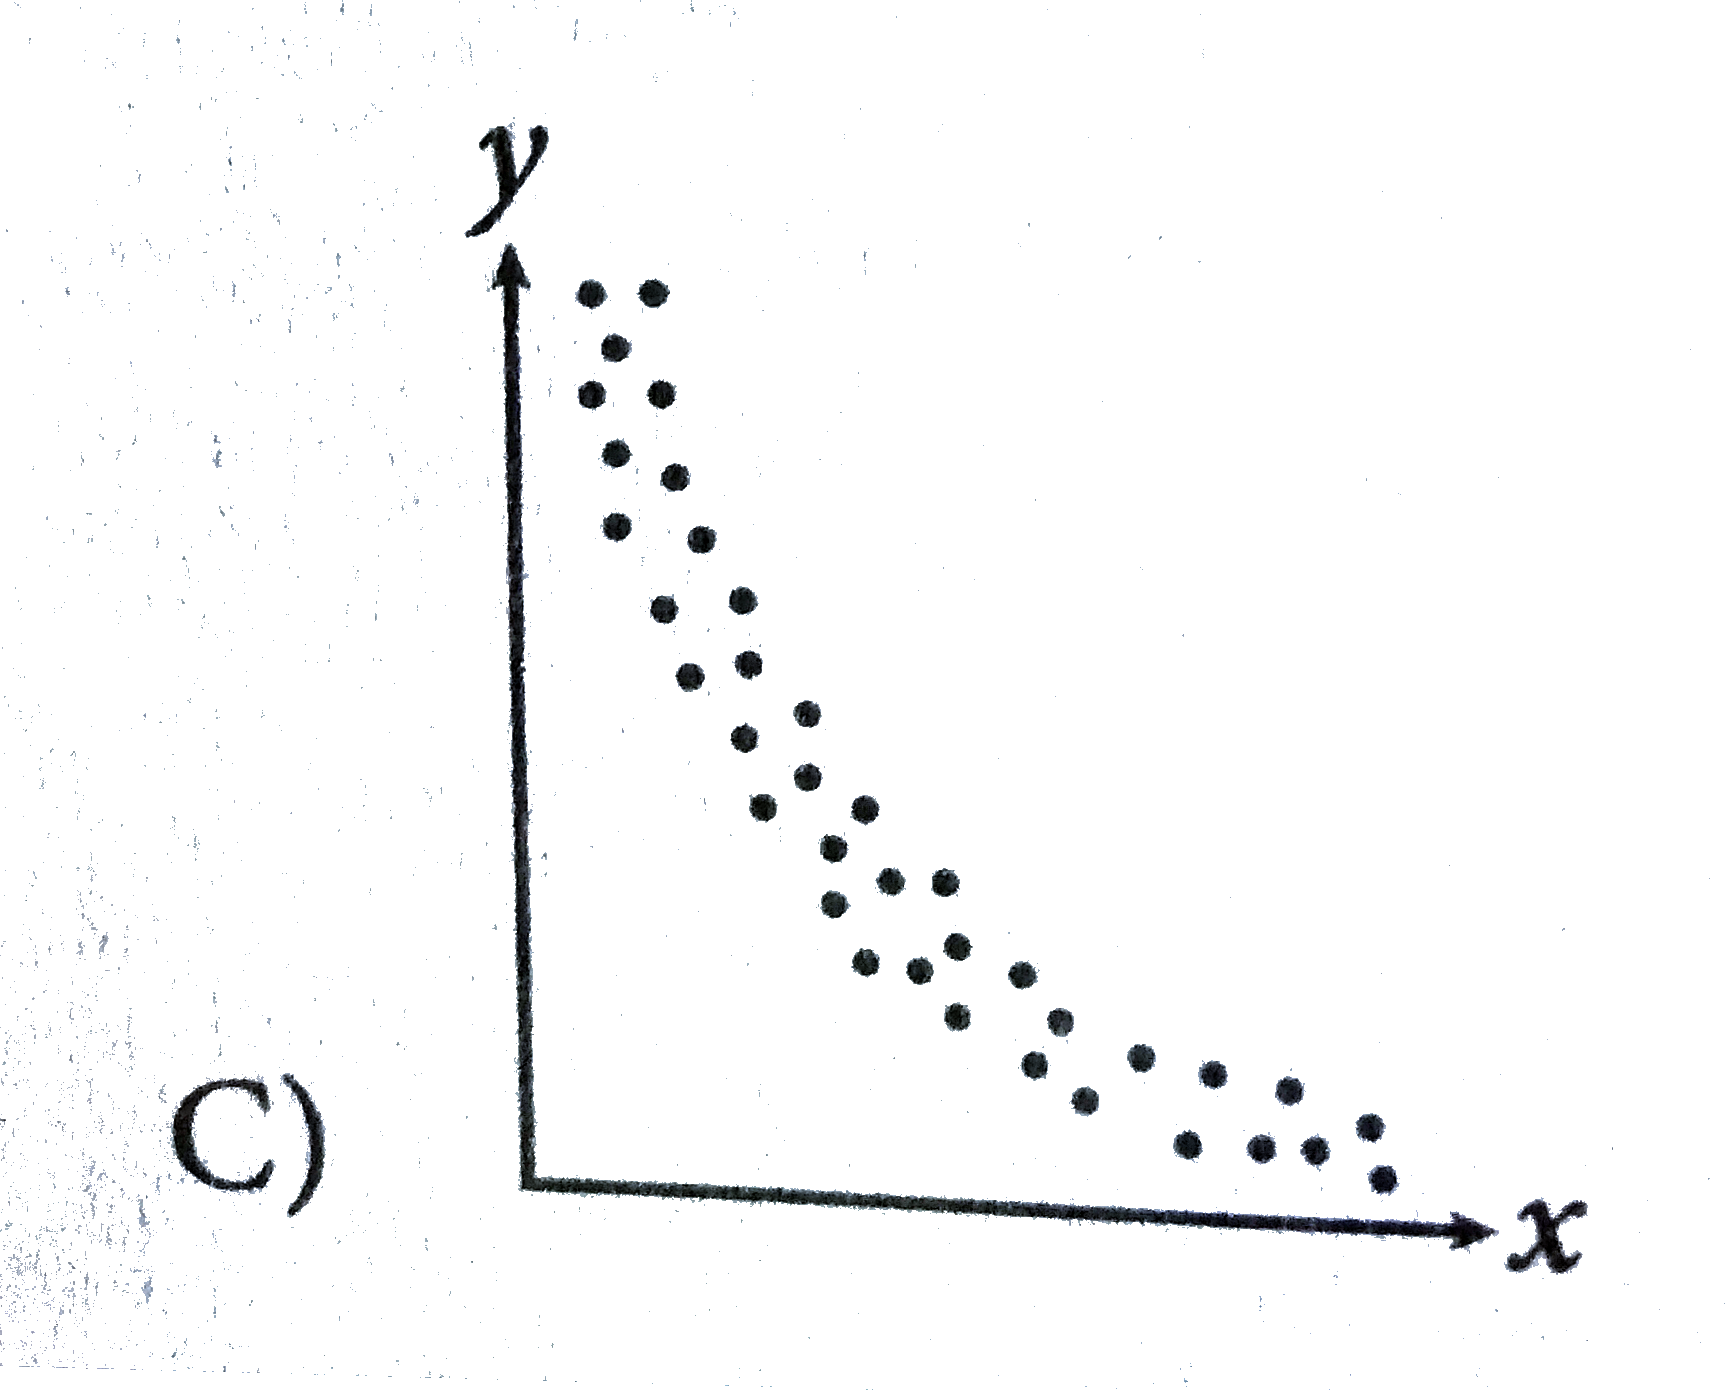
Which of the following scatterplot could be modeled by the equation y=abx, where a and b are constant such that a>1andx<−1?
The correct Answer is:B
To solve the problem of identifying which scatterplot could be modeled by the equation y=abx where a>1 and x<−1, we can follow these steps:
Step 1: Understand the Equation
The equation y=abx can be rewritten as y=a⋅b−x. This shows that as x increases (becomes less negative), y will decrease because b−x will increase.
Hint: Rewrite the equation in a form that makes it easier to analyze the behavior of y as x changes.
Step 2: Analyze the Conditions
Given that a>1 and x<−1, we know:
- a is a positive constant greater than 1.
- Since x<−1, the values of x are negative, which means −x is positive.
Hint: Consider how the value of x affects the output y based on the conditions provided.
Step 3: Determine the Behavior of the Function
As x becomes more negative (i.e., x approaches negative infinity), b−x will grow larger. Thus, y will increase without bound. Conversely, as x approaches -1 from the left, y will be at a finite value.
Hint: Think about how the graph of the function behaves as x changes, especially for values less than -1.
Step 4: Evaluate the Scatterplots
Now, we need to look at the provided scatterplots (let's assume they are labeled A, B, C, D) and determine which one reflects the behavior we analyzed:
- The correct scatterplot should show an increasing trend for x<−1.
Hint: Look for a scatterplot that shows an upward trend as x values become less negative.
Step 5: Eliminate Incorrect Options
From the analysis, we can eliminate options that do not show the expected behavior:
- If a scatterplot shows a decreasing trend or is flat for x<−1, it cannot be modeled by our equation.
Hint: Cross out any scatterplots that do not match the increasing behavior for negative x.
Step 6: Identify the Correct Scatterplot
After evaluating the options, we find that scatterplot B shows the correct increasing trend for x<−1, while scatterplots A, C, and D do not fit the model.
Final Answer: The correct scatterplot that could be modeled by the equation y=abx is B.
The equation y=abx can be rewritten as y=a⋅b−x. This shows that as x increases (becomes less negative), y will decrease because b−x will increase.
Given that a>1 and x<−1, we know:
- a is a positive constant greater than 1.
- Since x<−1, the values of x are negative, which means −x is positive.
As x becomes more negative (i.e., x approaches negative infinity), b−x will grow larger. Thus, y will increase without bound. Conversely, as x approaches -1 from the left, y will be at a finite value.
Now, we need to look at the provided scatterplots (let's assume they are labeled A, B, C, D) and determine which one reflects the behavior we analyzed:
- The correct scatterplot should show an increasing trend for x<−1.
From the analysis, we can eliminate options that do not show the expected behavior:
- If a scatterplot shows a decreasing trend or is flat for x<−1, it cannot be modeled by our equation.
After evaluating the options, we find that scatterplot B shows the correct increasing trend for x<−1, while scatterplots A, C, and D do not fit the model.
Topper's Solved these Questions
Similar Questions
Knowledge Check
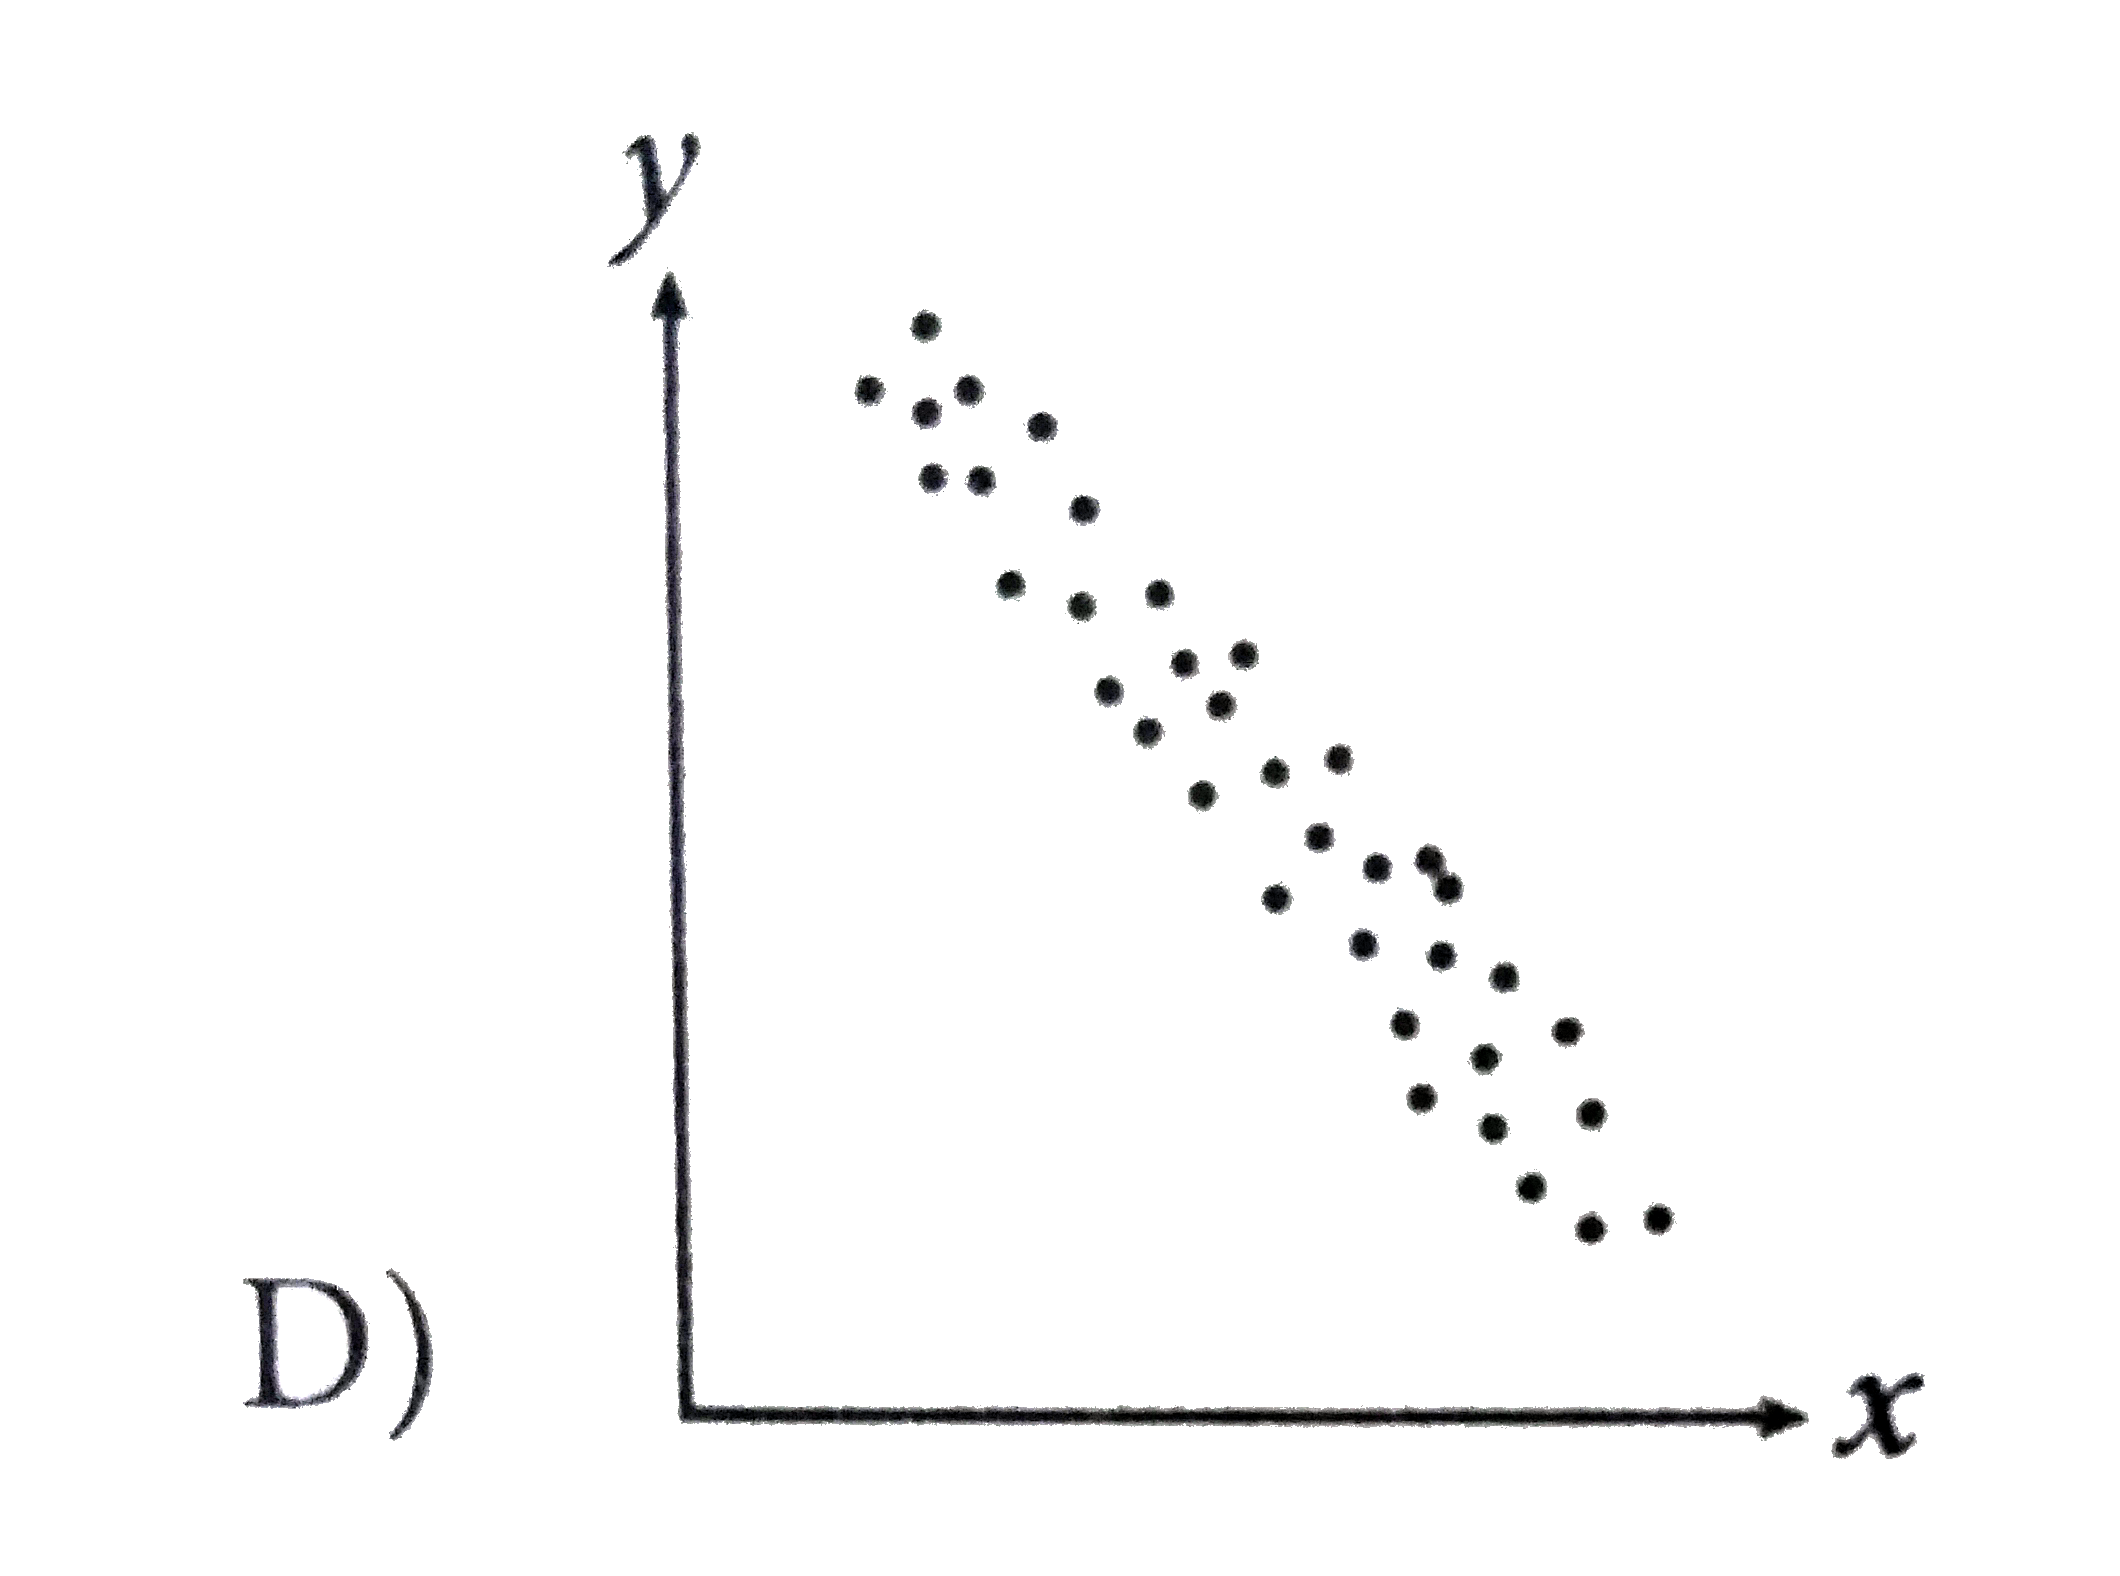
Which of the following is best modeled using a linear regression equation, y=ax+b, where a<0?
A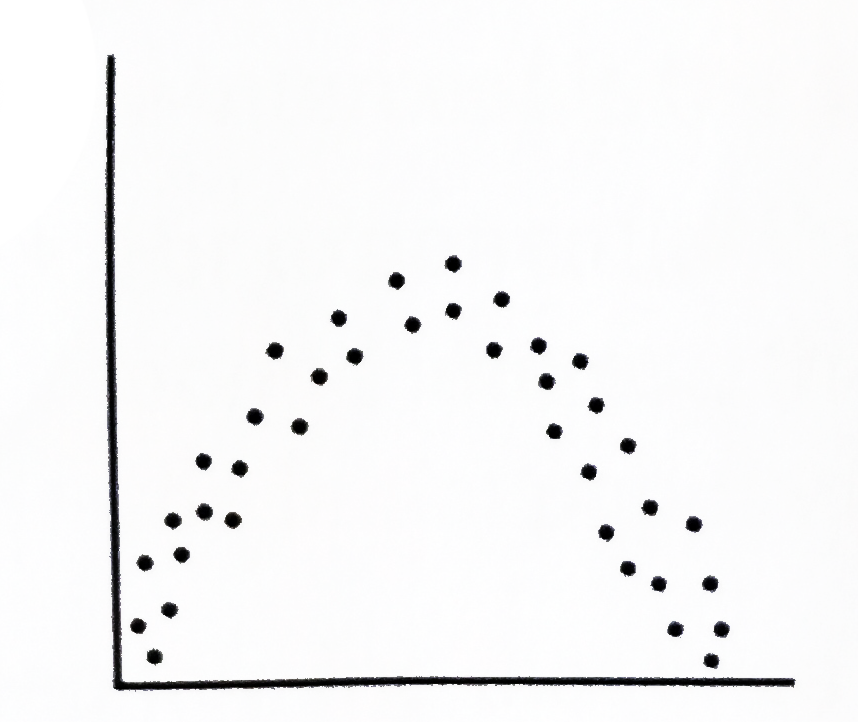 B
B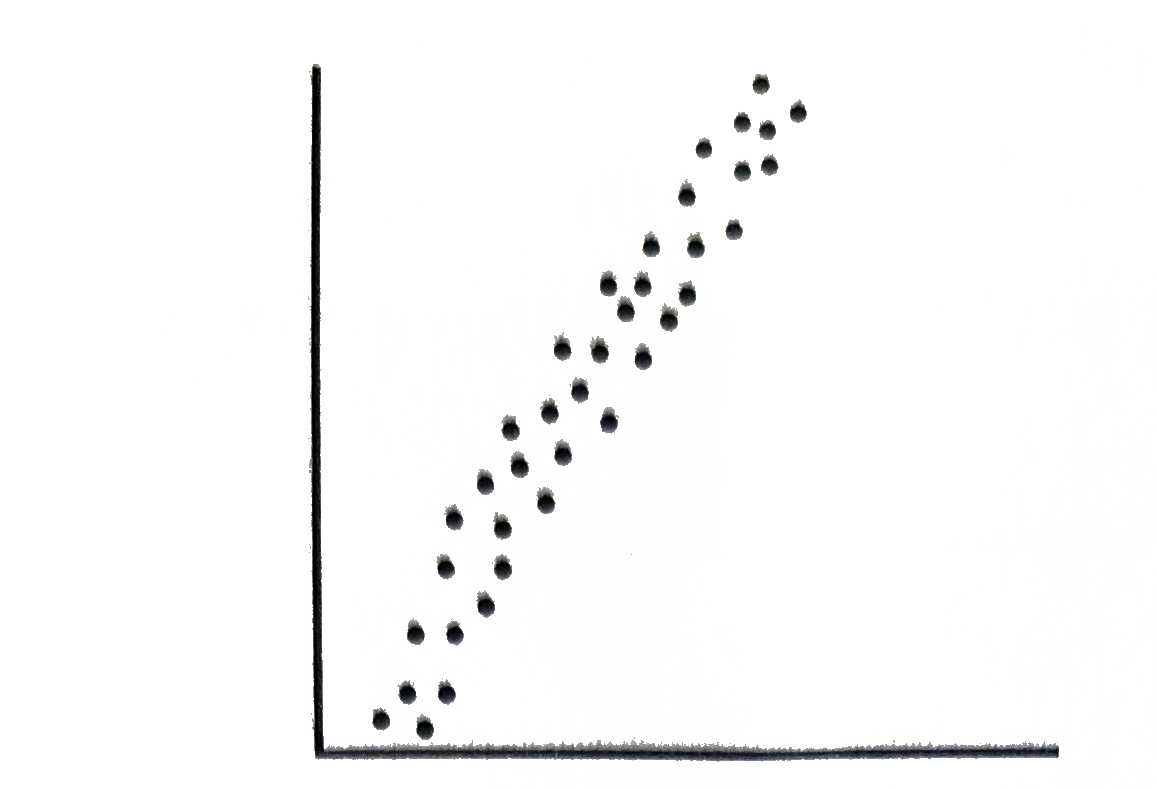 C
C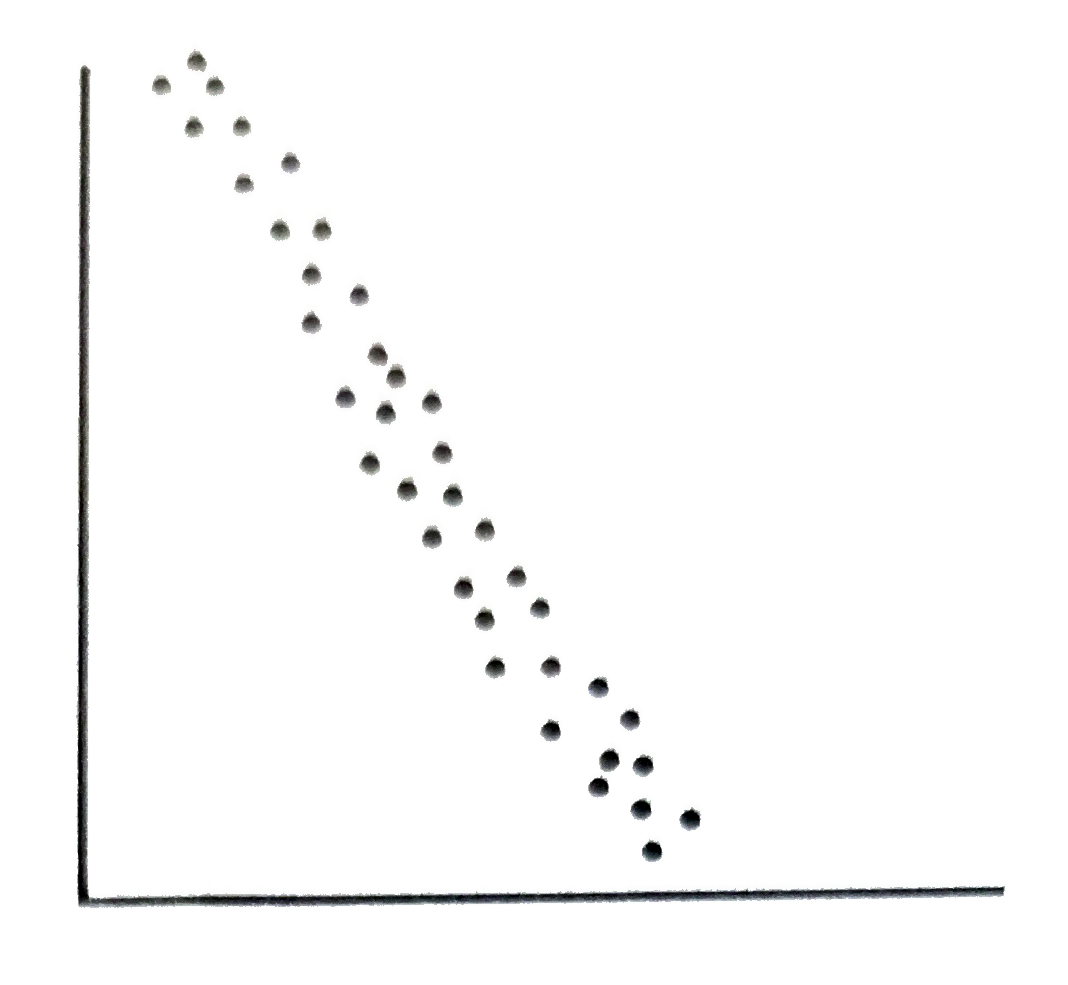 D
D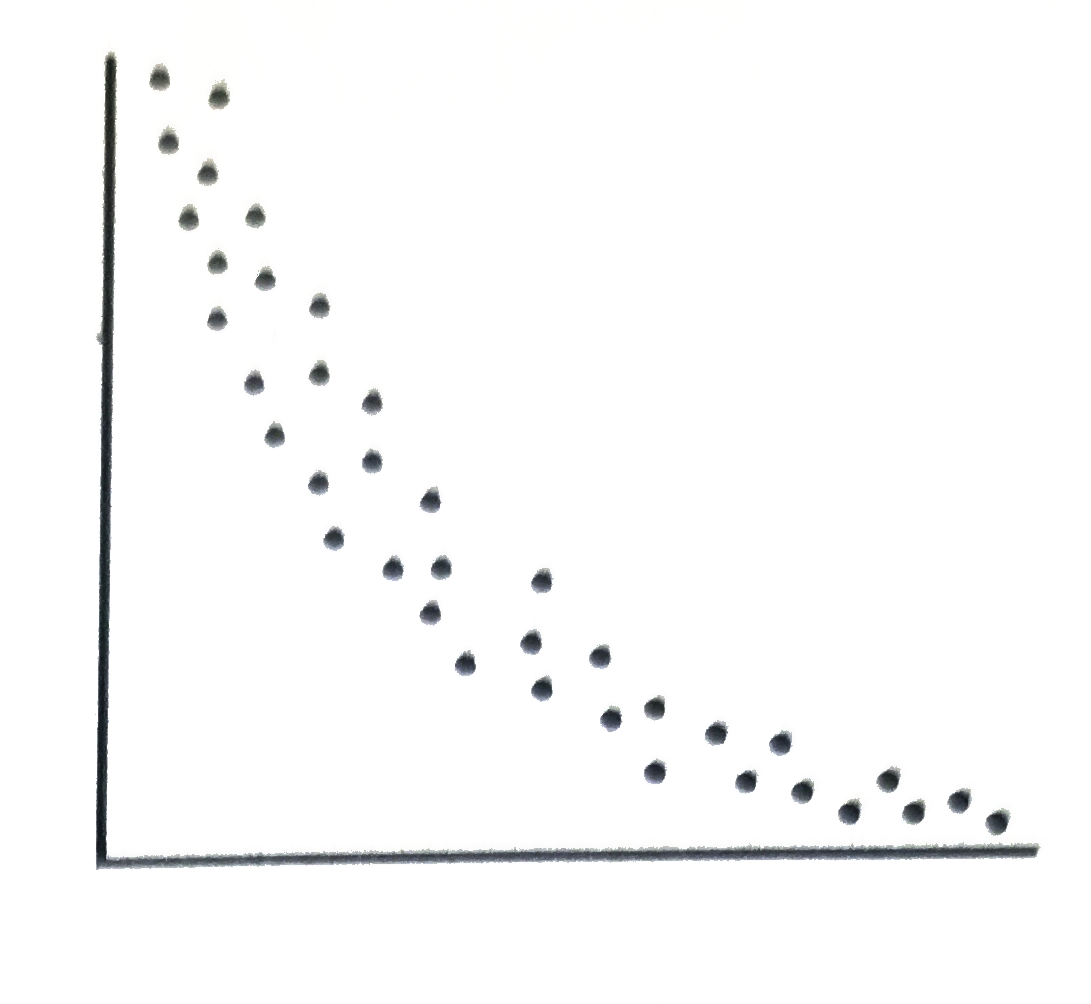
Which of the following scatterplots shows a relationship that is appropriately modeled with the equation y=axb , where a is positive and b is negative?
A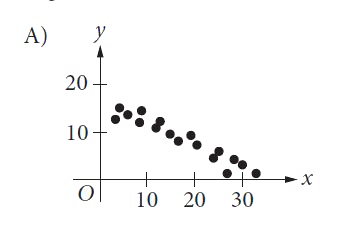 B
B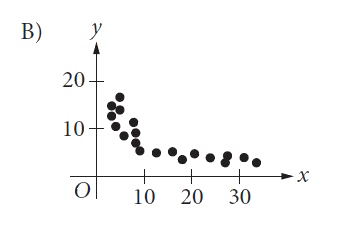 C
C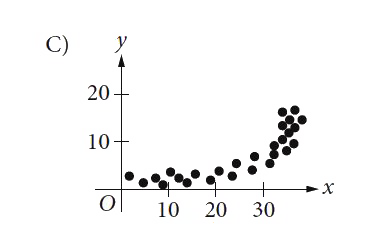 D
D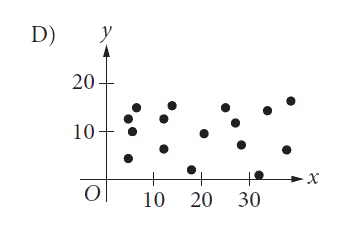
The data in which of the following scatterplots would be best modeled by a quadratic function in which the x2 term has a negative coefficient?
A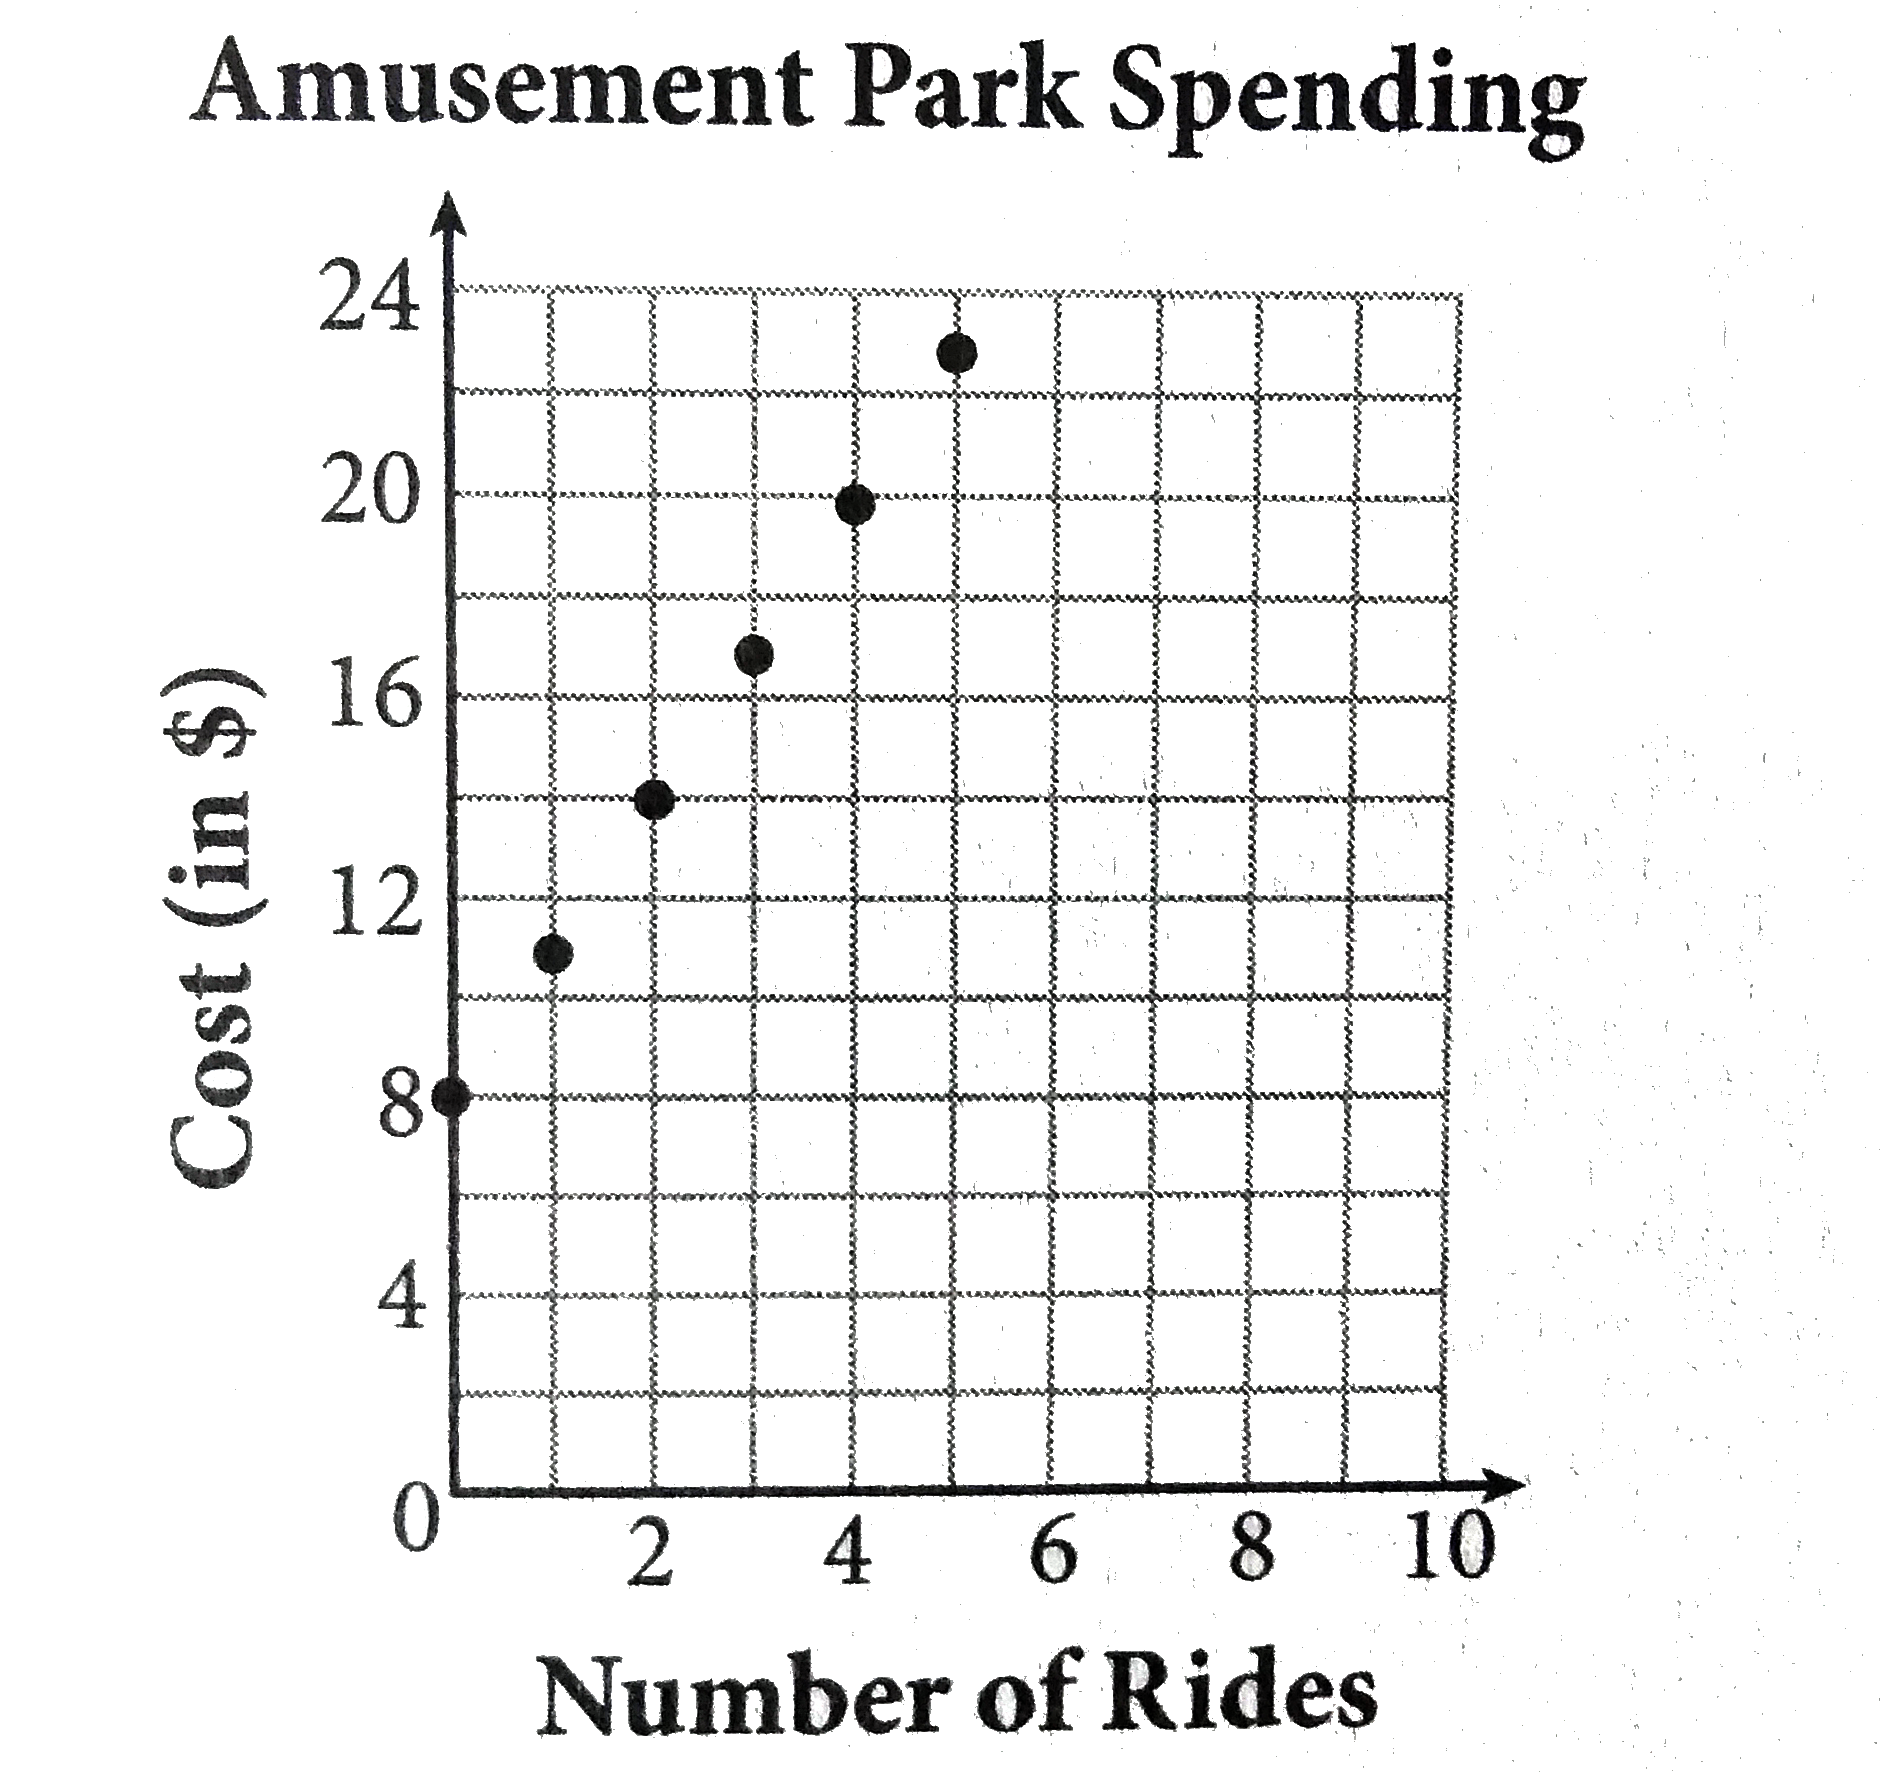 B
B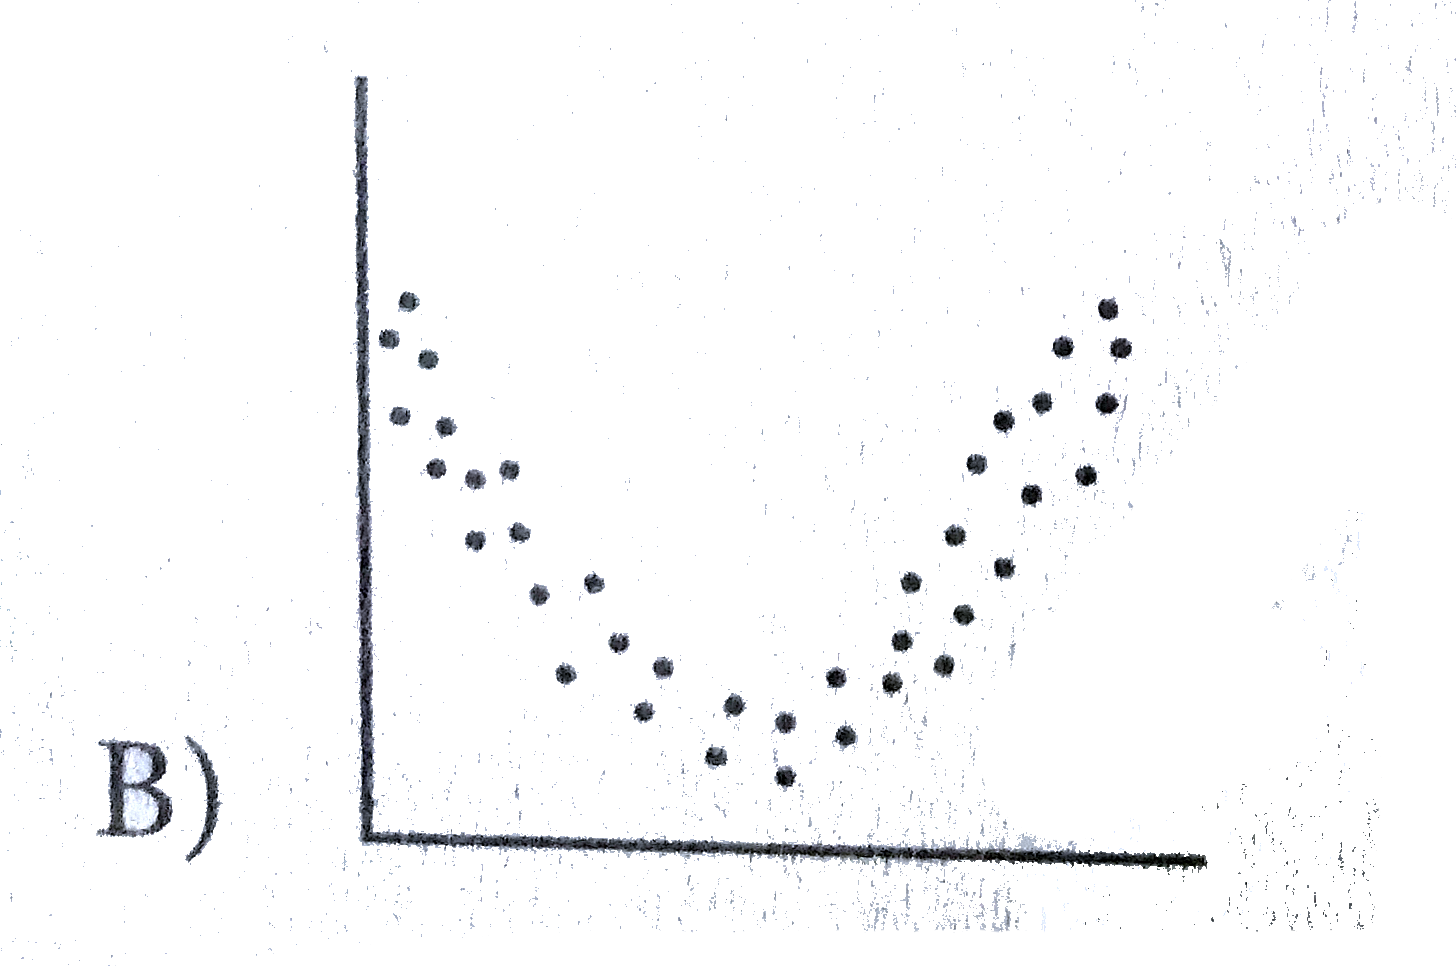 C
C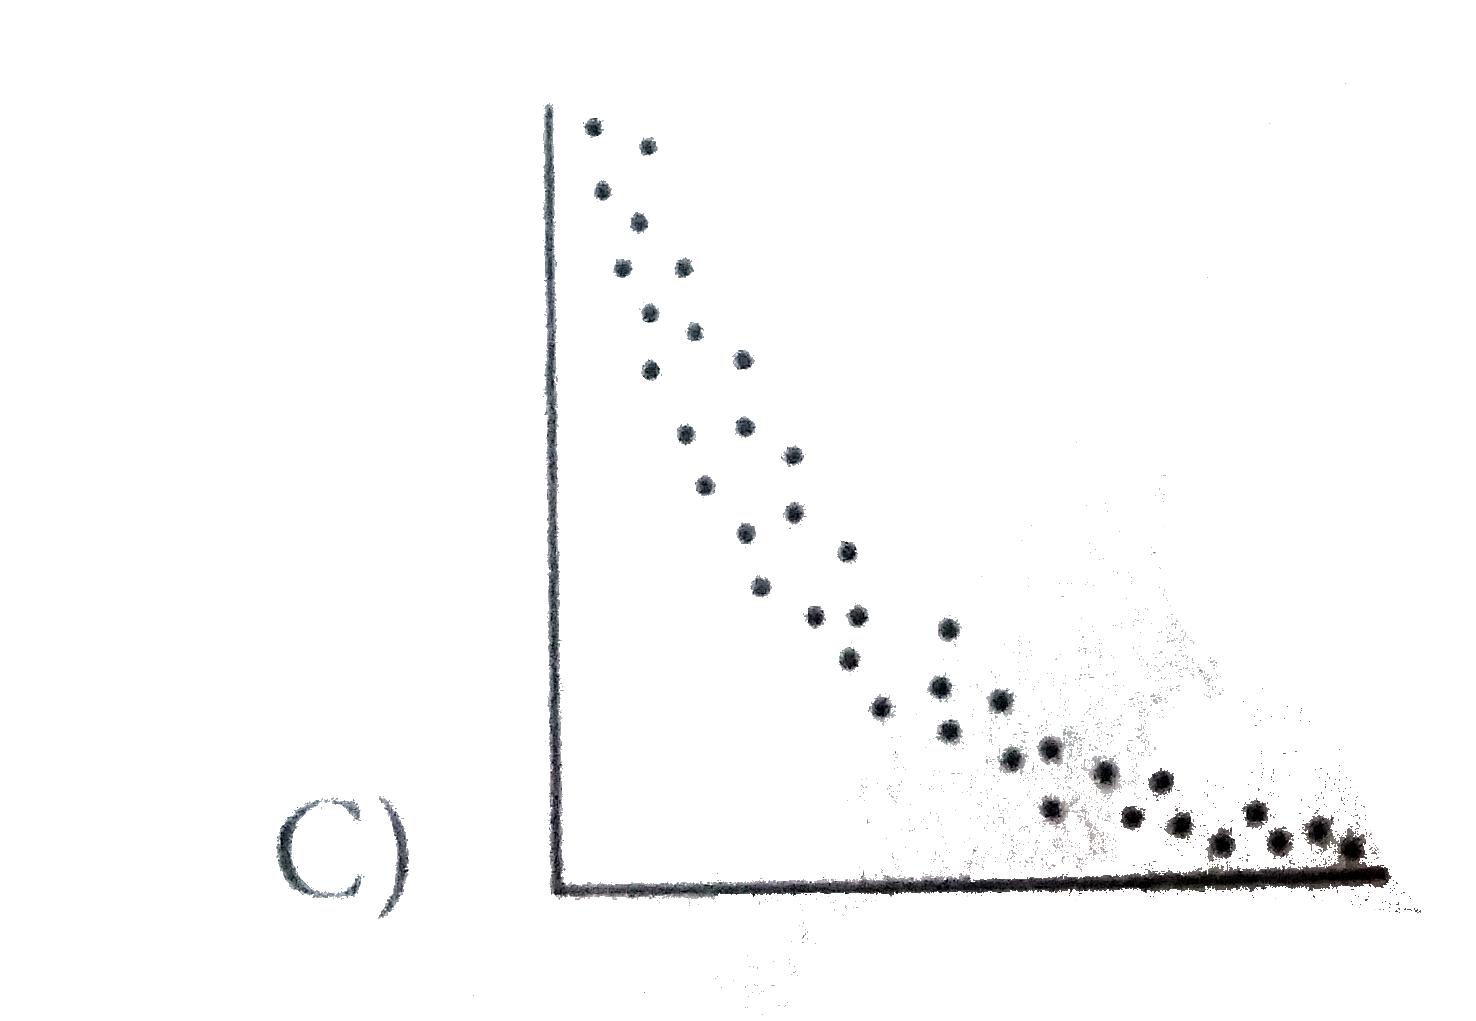 D
D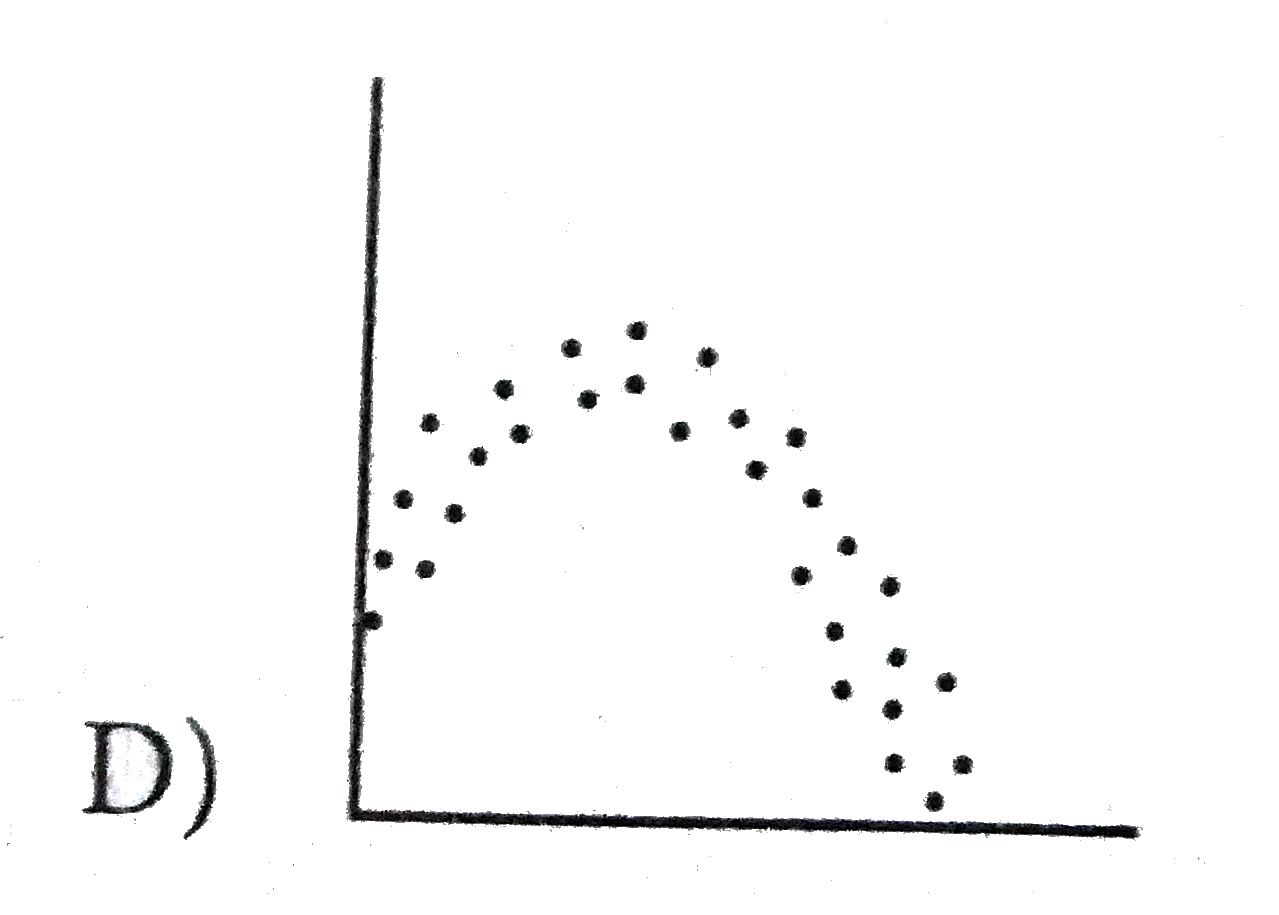
Let f:(0,1)→R be defined by f(x)=b−x1−bx, where b is constant such that 0<b<1 .then ,
View SolutionFrom the differential equation of the family of curves y=asin(x+b), where a and b are arbitrary constants.
View SolutionWhich of the following scatterplots shows a ralationship that is appropriately modeled with the equation y=−ax2+bx−c, where a and c are negative and b is positive ?
View Solution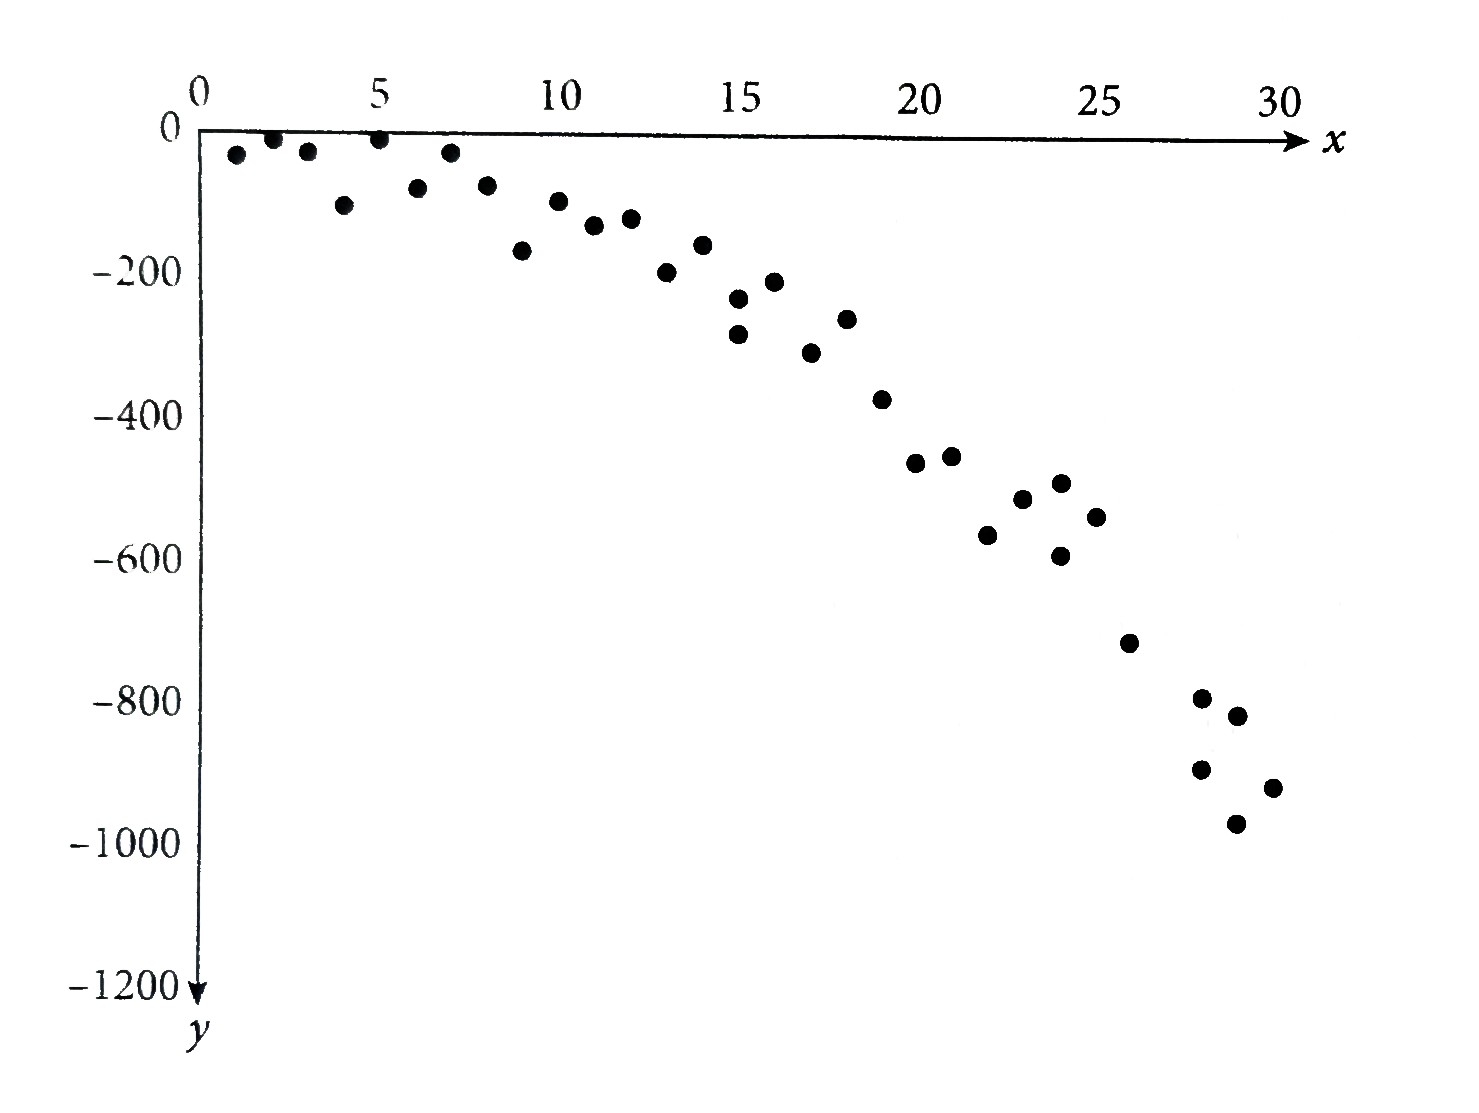
For which of the following values of a and b does the equation y=axb model the data in the scatterplot above ?
View SolutionWhich of the following equivalent to the expressions ⎛⎝a14b3a2b12?
Where a>1andb>1
View Solution
