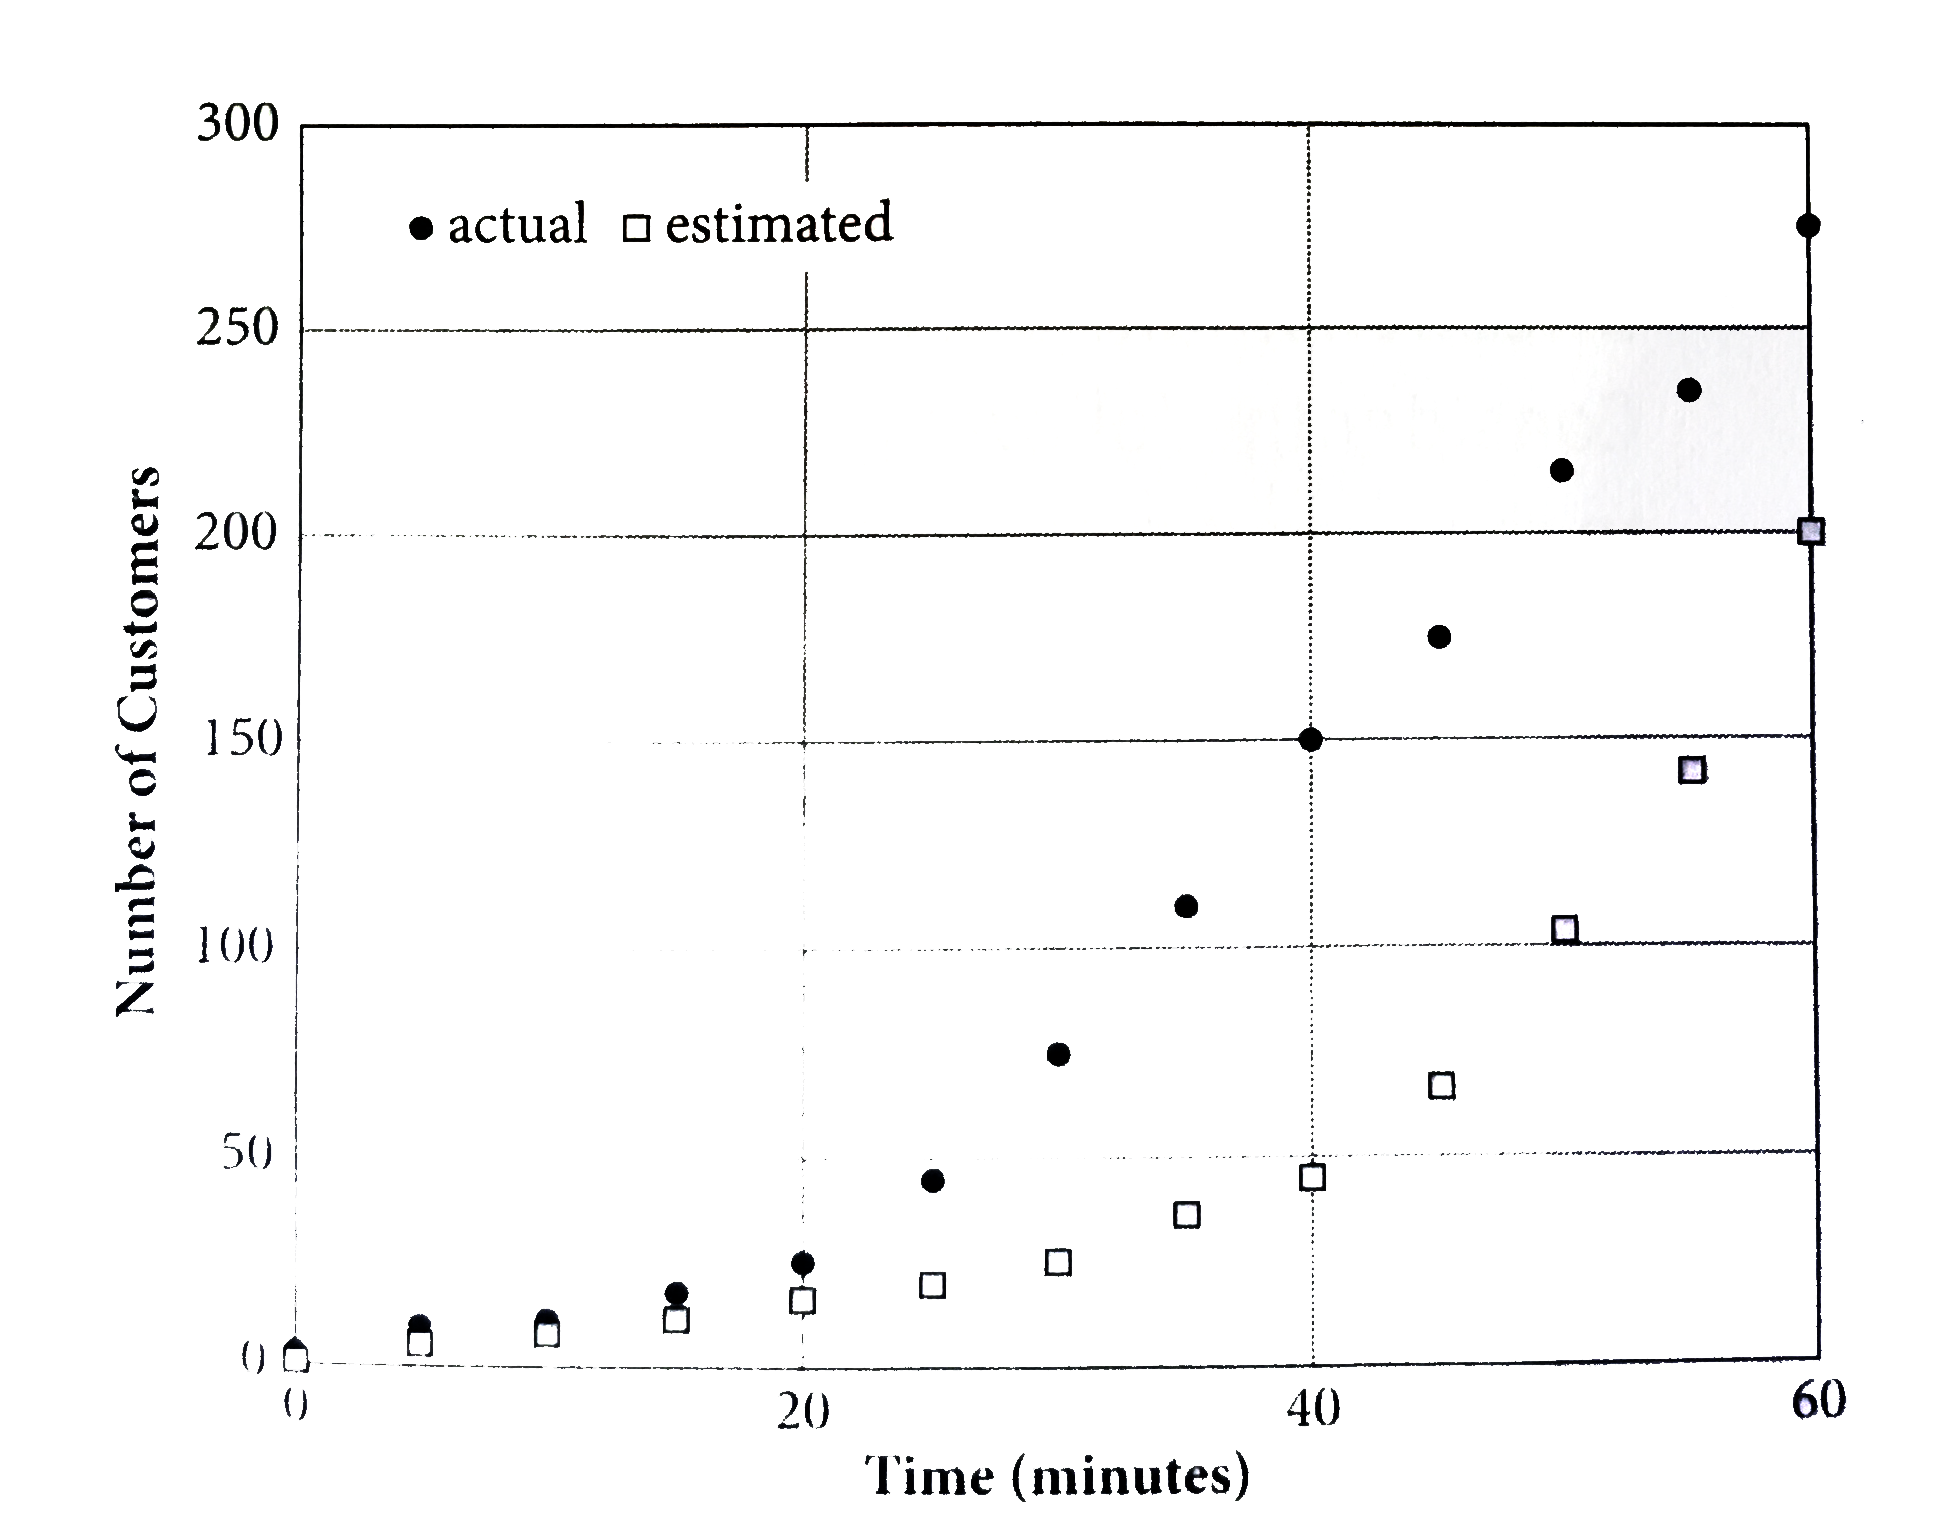
The scatterplot above shows the actual and estimated number of customers visiting a new shopping plaza within the first hour of opening. Which of the following statements correctly compares the rates of incresase for the actual and estimated numbers of customers ?
The rate of increases for the actual number of customeers is greater than that of the estimated number is grater than that of the estimatted number in every 20-minute interval.
The rate of increase for the actual number of customers is less than that of the estimated number in every 20-minute interval.
The rate of incrases for the acutal number of customers is greater than that of the estimated number in the interval from 20 to 40 minutes and less in the interval 40 to 60 minutes.
The rate of increase for the actual number of customers is less than that of the estimated number in the interval from 20 to 40 minutes and greater in the interval 40 to 60 minutes.
The correct Answer is:C
For every 20 minute interval, draw a line of best fit through the data for the actual number of costomeers and similarly for the estimated number of costomers. Then compare the slopes of the lines of best fit for actual and estimated for each 20-minutte interval to compare the rates of increase.
In the interval from 0 to 20 minutes, the slope of the line of best fit for the actual number of costomers is slightly greater (steeper) than that of the estimated model. In the interval from 20 to 40 minutes, the slope of the line of best fit fot the actual data is greater than that of the estimated data. In the interval from 40 to 60 minutes, the slope of the line of best fit for the actual data is less than that of the estimated data. Thus, (C ) is correct.
Topper's Solved these Questions
- BOOK - KAPLANCHAPTER - SCATTERPLOTSEXERCISE - LINE OF BEST FIT1videos
SCATTERPLOTS
- BOOK - KAPLANCHAPTER - SCATTERPLOTSEXERCISE - SCATTERPLOT MODELING1videos
SCATTERPLOTS
- BOOK - KAPLANCHAPTER - SCATTERPLOTSEXERCISE - SCATTERPLOT MODELING1videos
SCATTERPLOTS
- BOOK - KAPLANCHAPTER - SAT MATH: TIMING ANS SECTION MANAGEMENT STRATEGIESEXERCISE - TRY ON YOU OWN5videos
SAT MATH: TIMING ANS SECTION MANAGEMENT STRATEGIES
- BOOK - KAPLANCHAPTER - SYSTEMS OF LINEAR EQUATIONSEXERCISE - NUMBER OF POSSIBLE SOLUTIONS1videos
SYSTEMS OF LINEAR EQUATIONS
Similar Questions

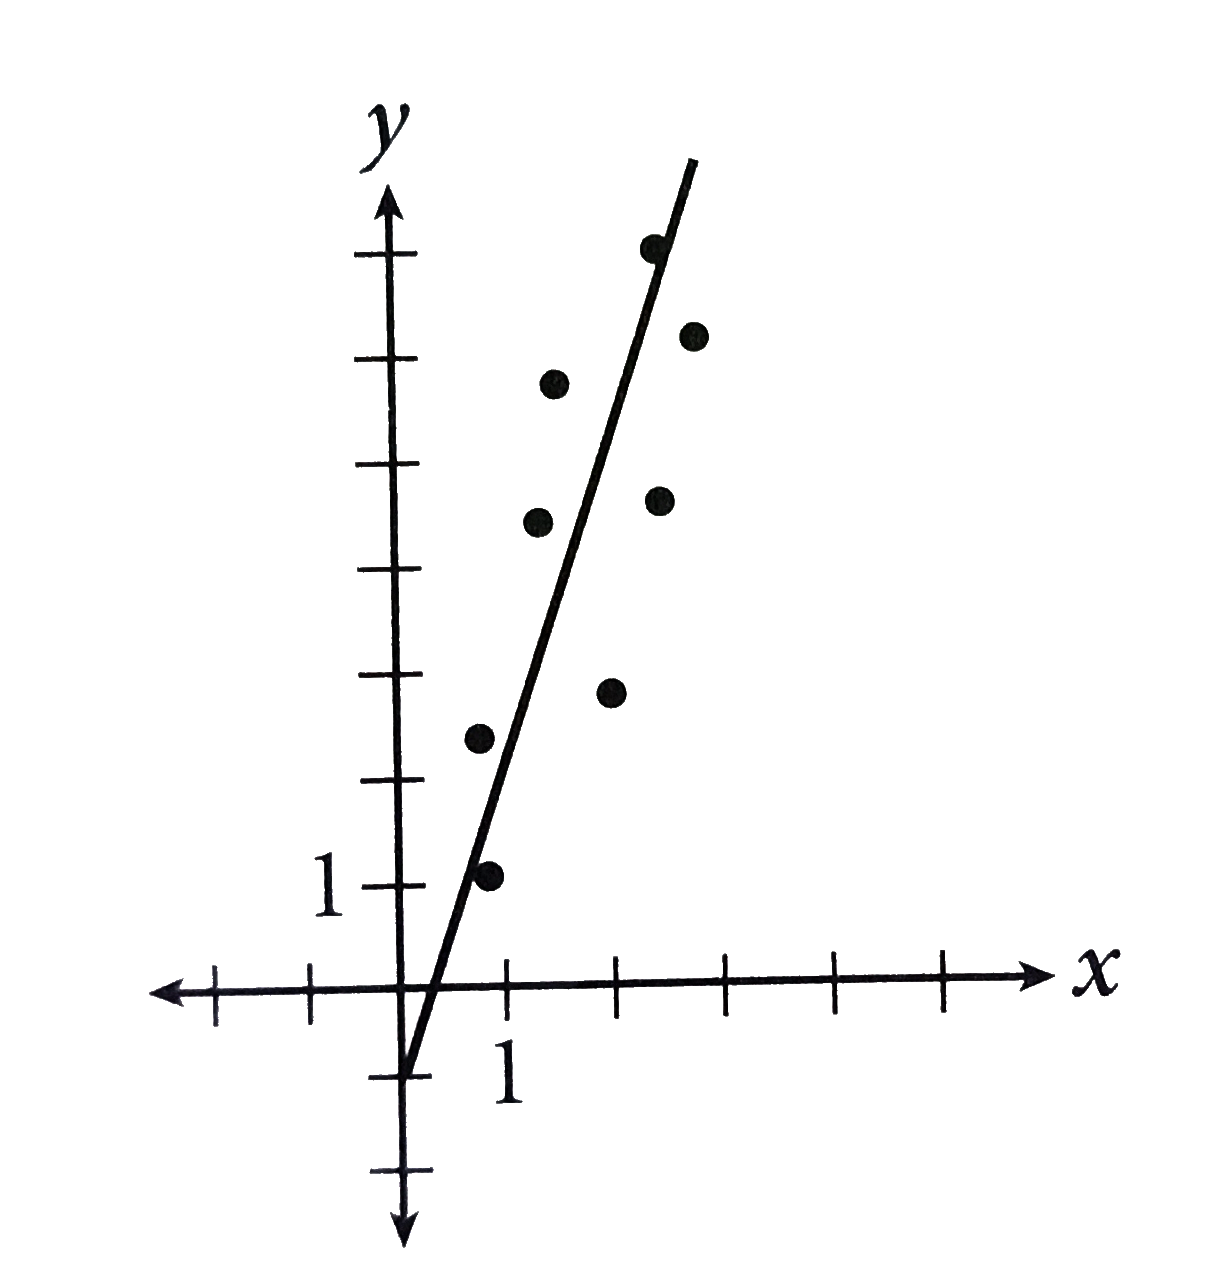
Which of the following equation corresponds to the line of best fit for the data set shown above ?View Solution
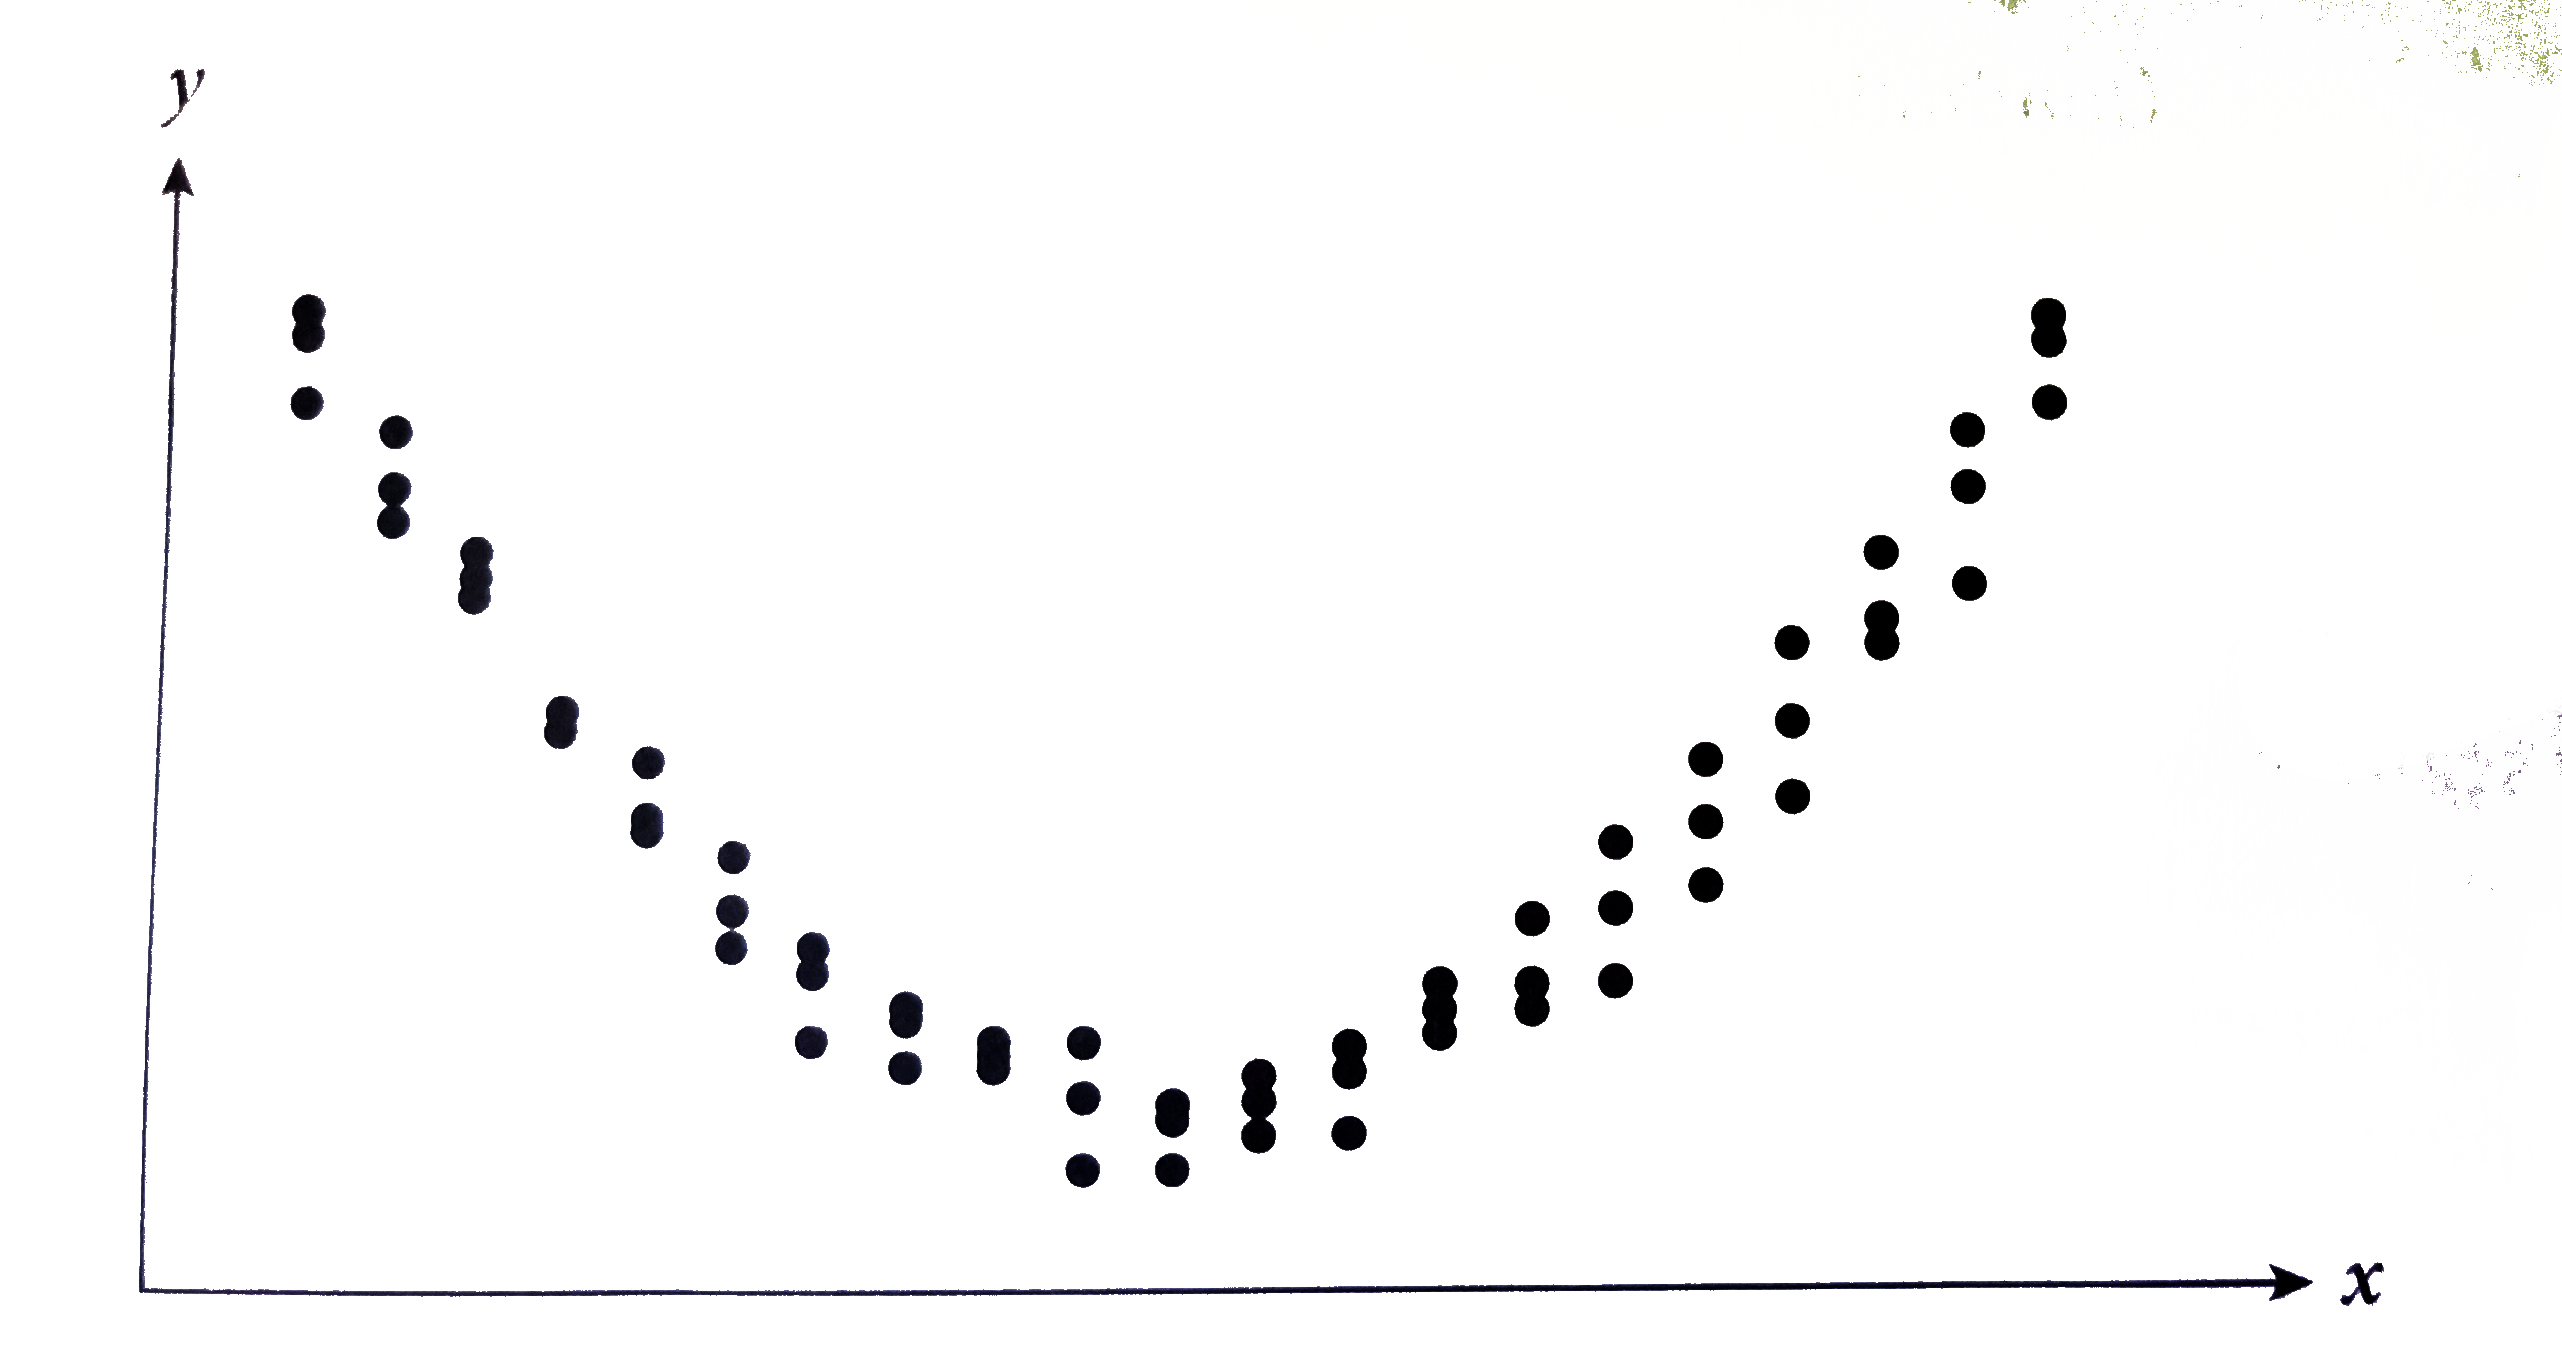
Given that a,b, and c are constants and that a>0, which of the following is the equation for the line of best fit for the above scatterplot ?01:37View Solution
Given that a,b, and c are constants and that a>0, which of the following is the equation for the line of best fit for the above scatterplot ?06:07View SolutionIf 79x−16x=13+12, what is the value of x ?
02:11View Solution{5x−3y=106y=kx−42
In the system of linear equations above, k represents a constant. If the system of equations has no solution, what is the value of 2k?01:31View SolutionMatch the following lists:
 02:45View Solution
How many lines of symmetry does the above figure have ?
02:17View SolutionWhich of the following are correct chain isomers of butane ? (i)
05:41View SolutionDetermine the point of symmetry of a regular hexagon.
02:10View SolutionDtermine the images of the following figure about the given line :
02:17View SolutionMatch the following Column A to Column B
 02:10View Solution
Match the following Column A to Column B
 04:23View Solution
Match the following Column A to Column B
 02:41View Solution
The inequation represented by the graph given below is :
03:12View SolutionThe inequation that best describes the graph given below is _________
08:58View Solution

