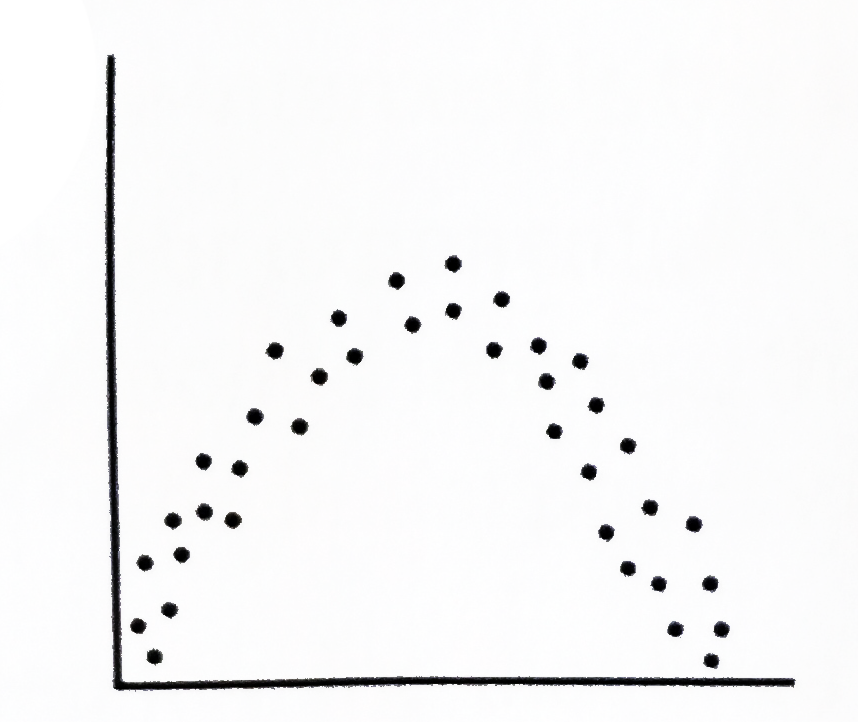
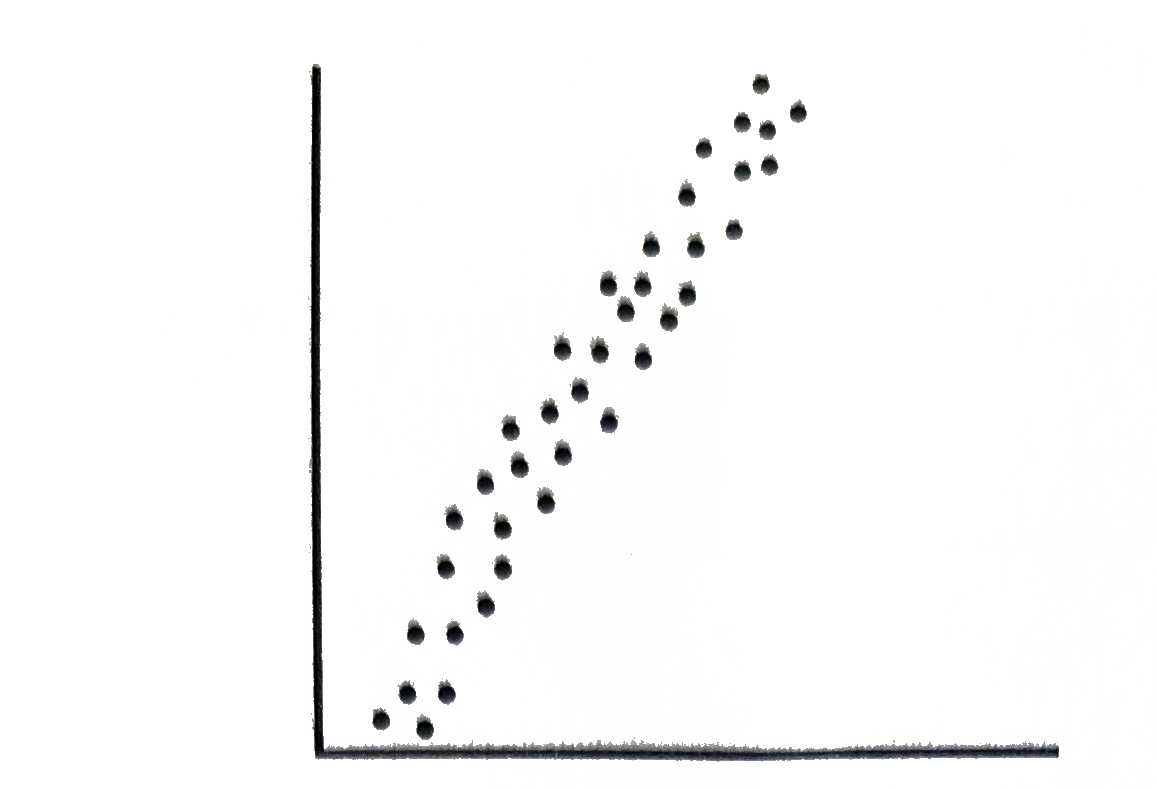
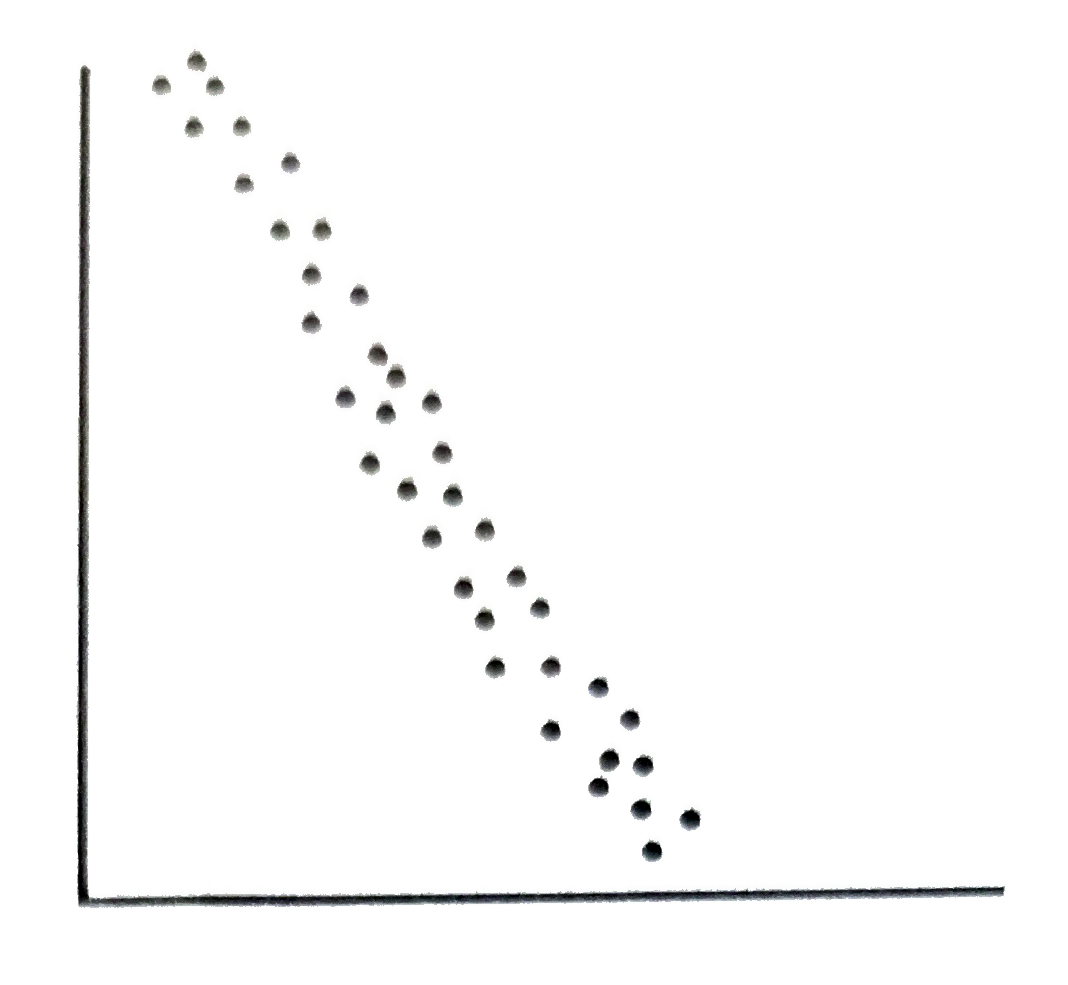
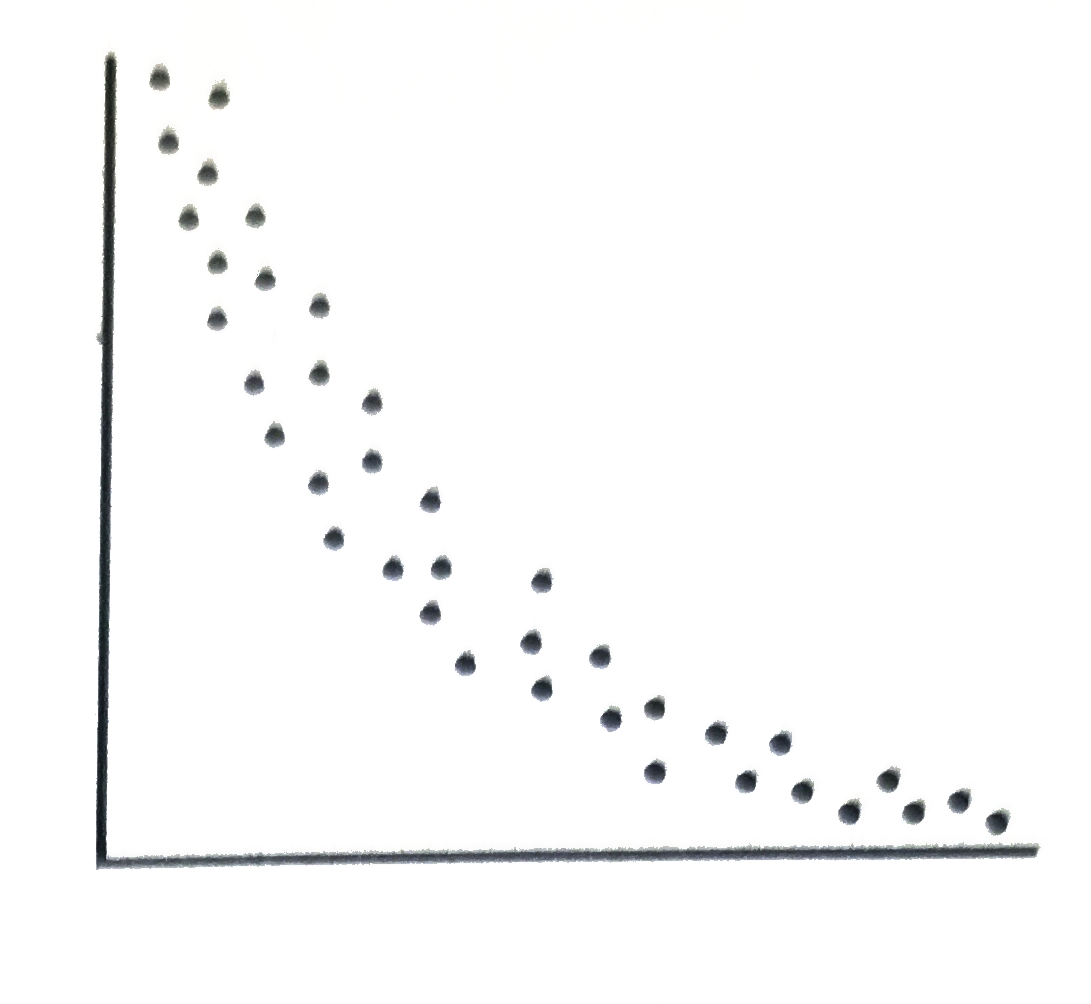
Which of the following is best modeled using a linear regression equation, y=ax+b, where a<0?
A
B
C
D
Video Solution
Text Solution
The correct Answer is:C
A regression equation is the equation of the line (or curve) that best fits the data. A linear regression is used to model data that follows the path of a straight line. In the equation given, a represents the slope of the linear regreswsion (the line of best fit), so you are looking for data that is linear and is decreasing, or falling from left to right, which happens with a is negative, or as the question states, when a<0. You can eliminate (A), which is a quadratic curve, and (D), an exponential cuirve. You can also eliminate (B) because it is increasing (rising from left to right) instead of decreasing (falling from left to right). (C ) is correct.
|
Updated on:21/07/2023
Topper's Solved these Questions
- BOOK - KAPLANCHAPTER - SCATTERPLOTSEXERCISE - LINE OF BEST FIT1videos
SCATTERPLOTS
- BOOK - KAPLANCHAPTER - SCATTERPLOTSEXERCISE - SCATTERPLOT MODELING1videos
SCATTERPLOTS
- BOOK - KAPLANCHAPTER - SCATTERPLOTSEXERCISE - SCATTERPLOT MODELING1videos
SCATTERPLOTS
- BOOK - KAPLANCHAPTER - SAT MATH: TIMING ANS SECTION MANAGEMENT STRATEGIESEXERCISE - TRY ON YOU OWN5videos
SAT MATH: TIMING ANS SECTION MANAGEMENT STRATEGIES
- BOOK - KAPLANCHAPTER - SYSTEMS OF LINEAR EQUATIONSEXERCISE - NUMBER OF POSSIBLE SOLUTIONS1videos
SYSTEMS OF LINEAR EQUATIONS
Similar Questions
Knowledge Check
- Question 1 - Select One
Which of the following scatterplot could be modeled by the equation y=abx, where a and b are constant such that a>1andx<−1?
A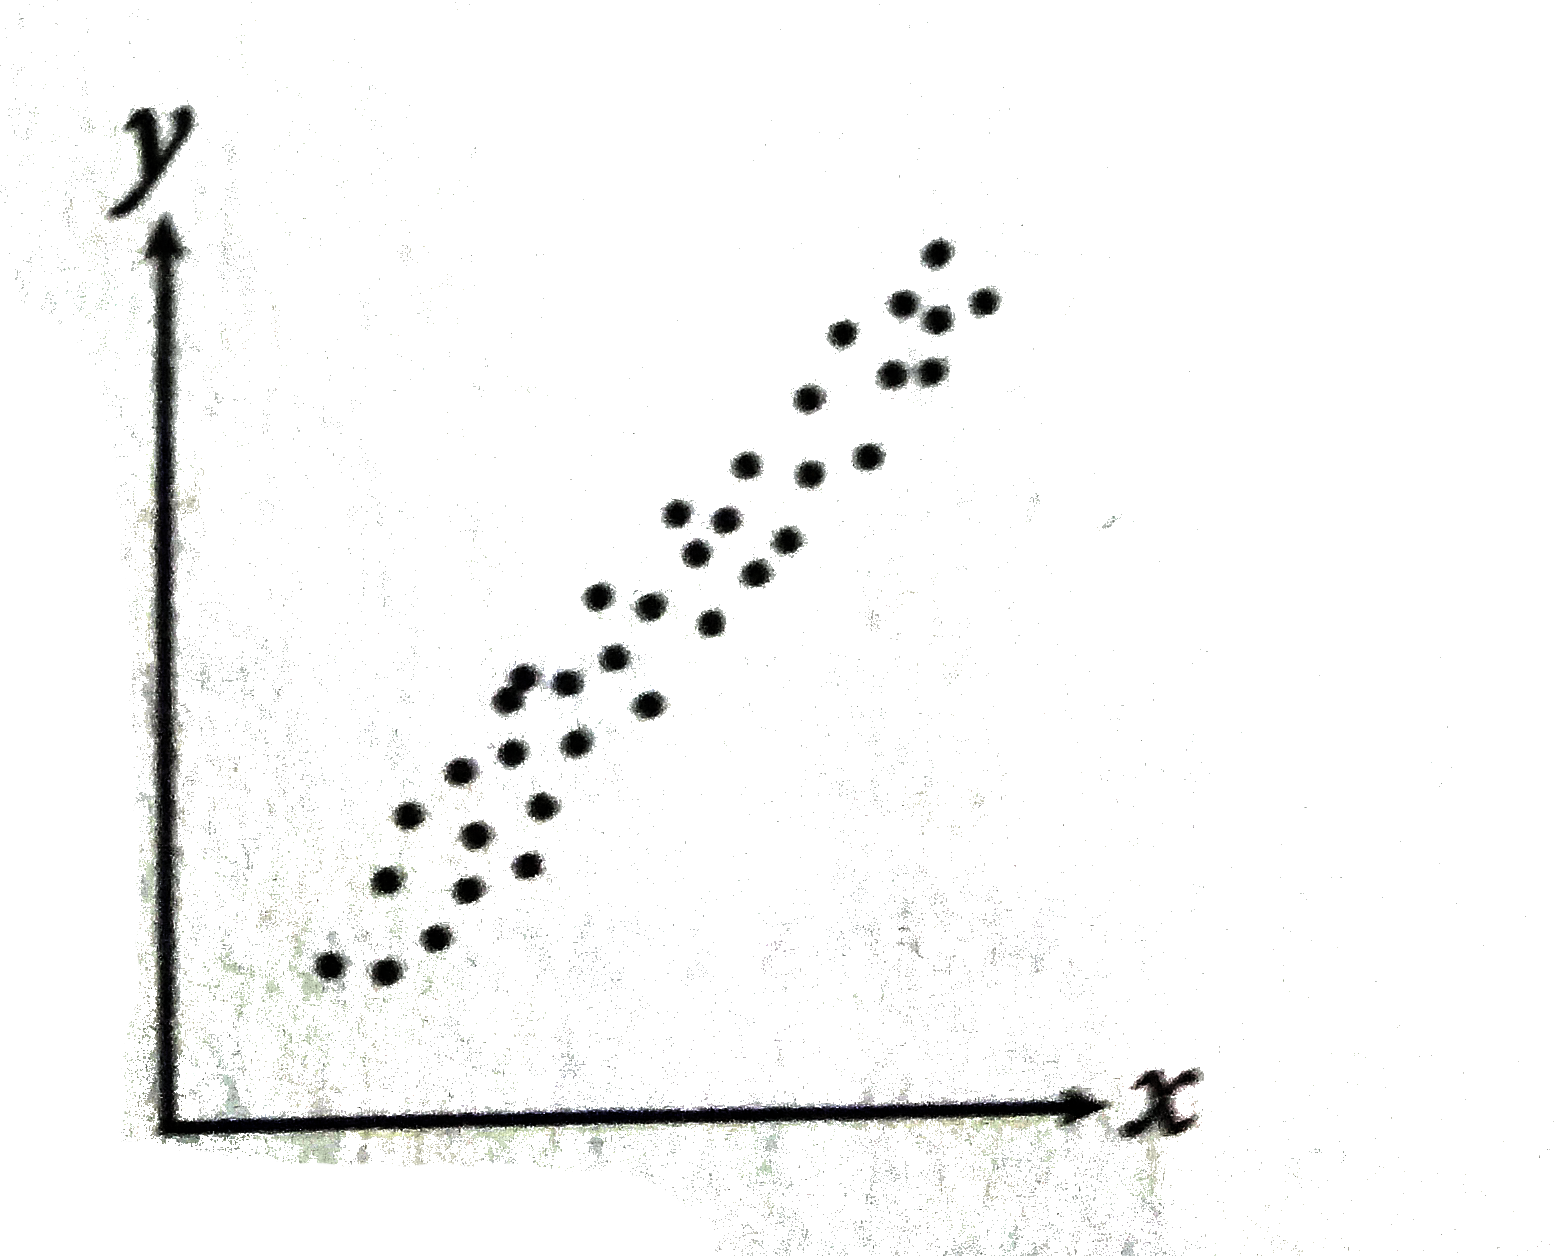 B
B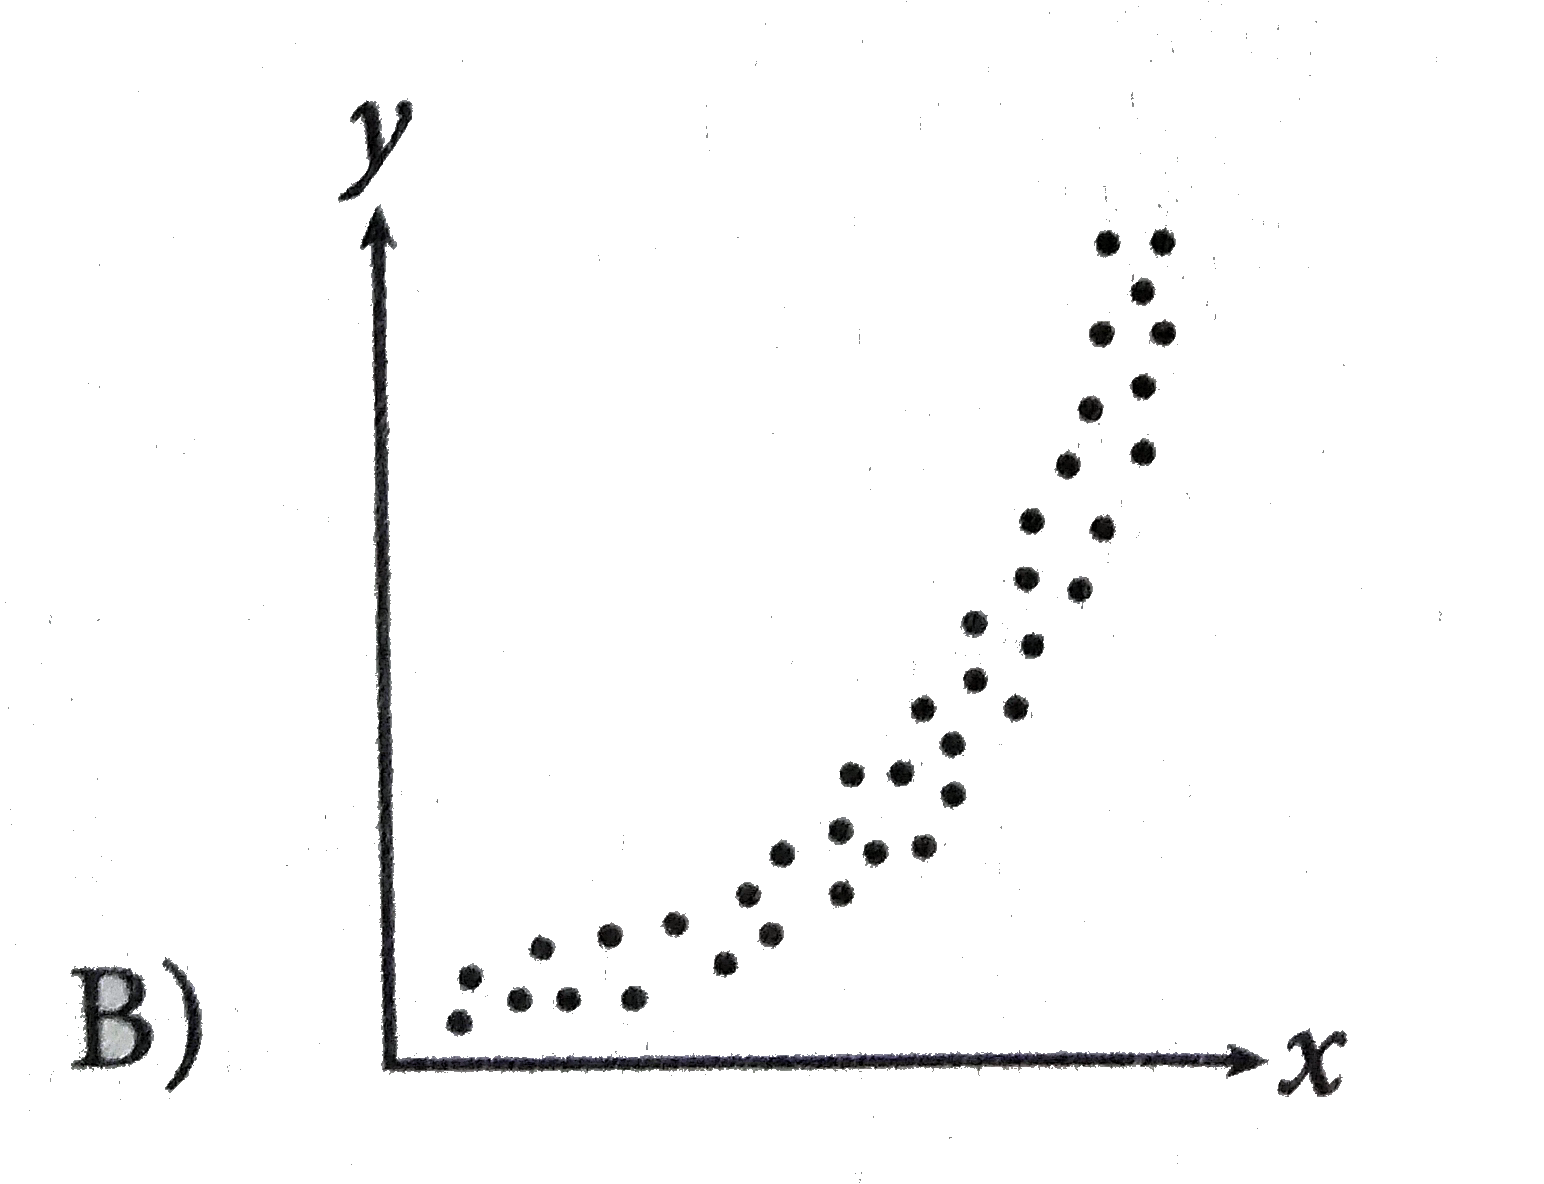 C
C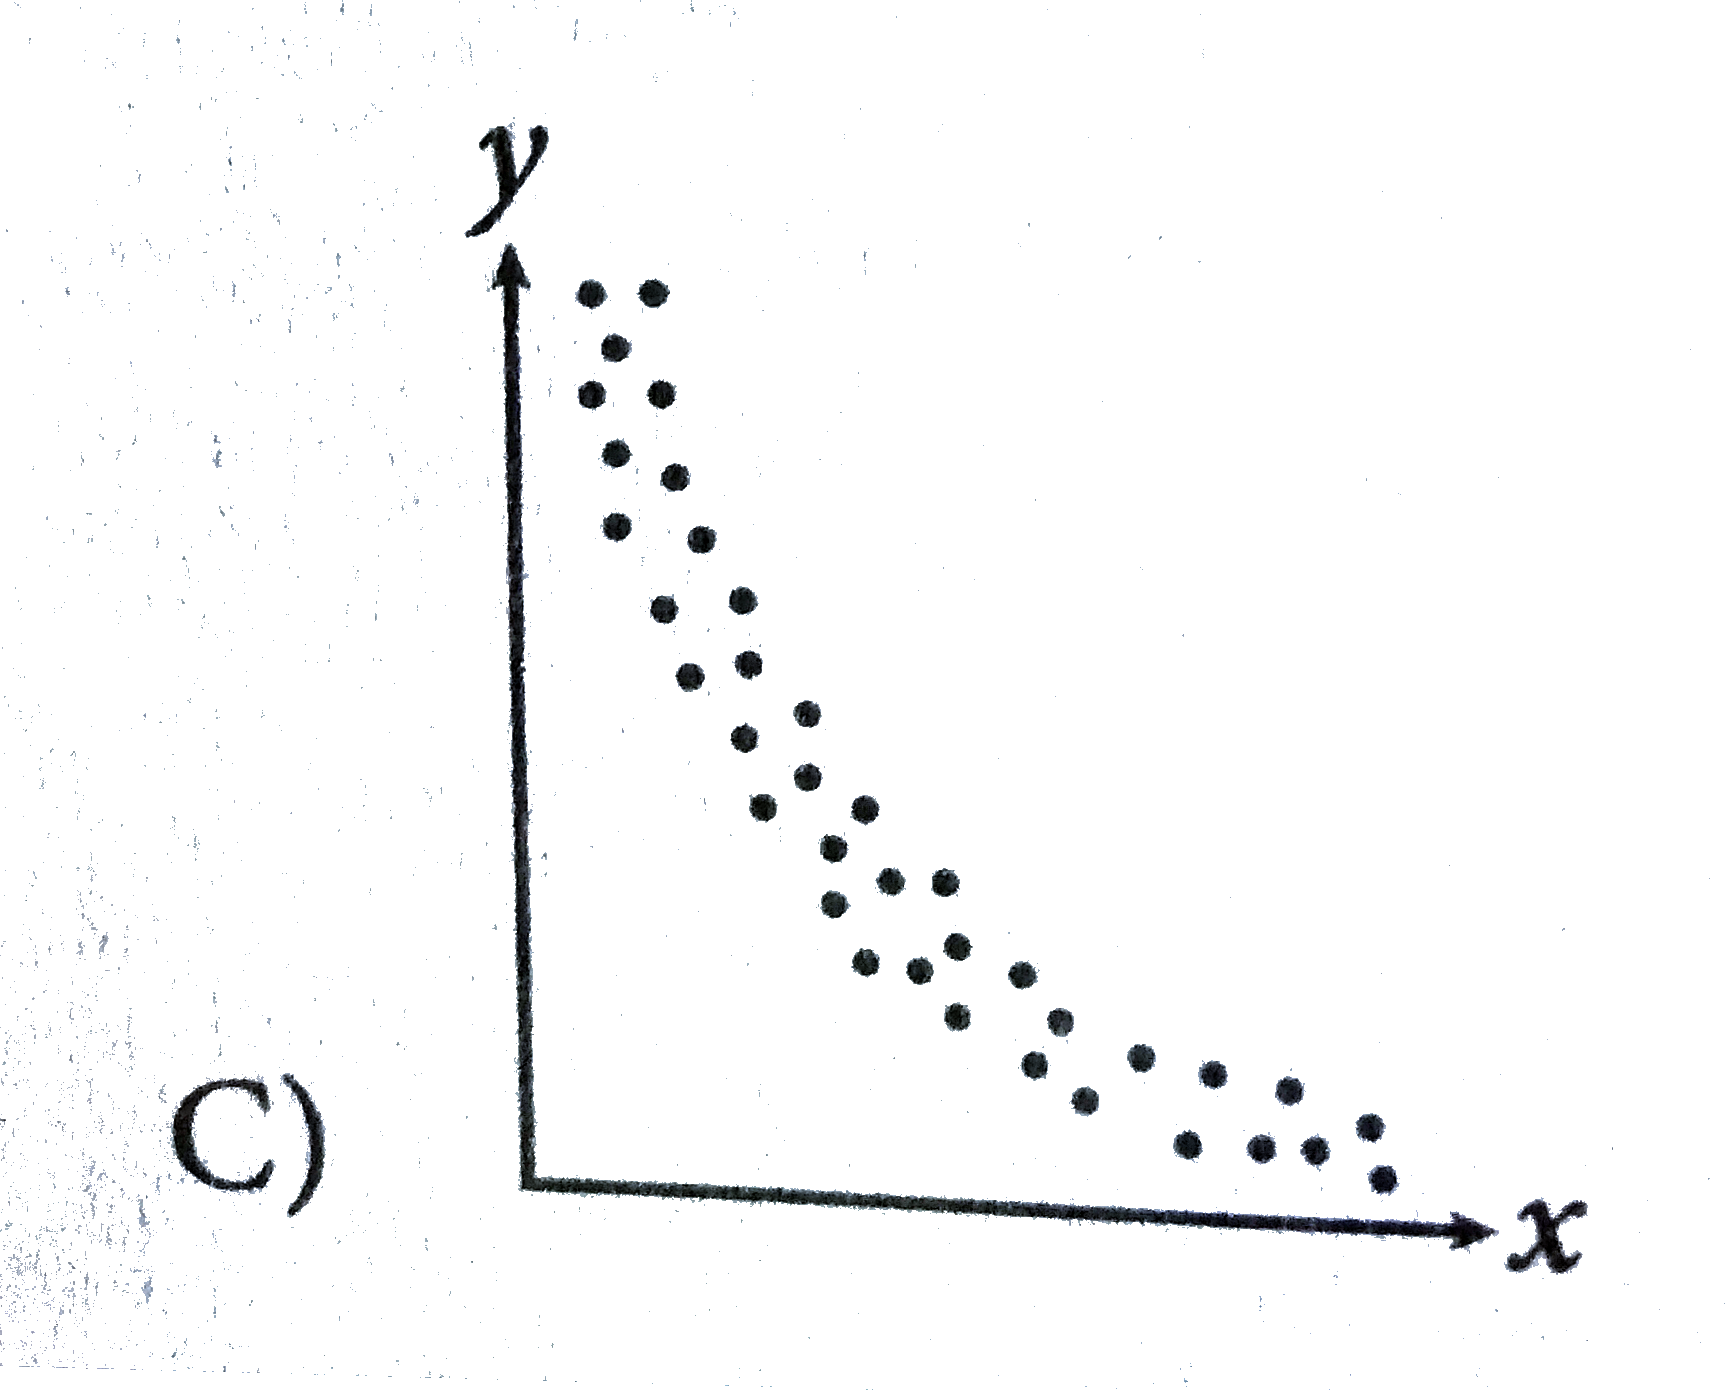 D
D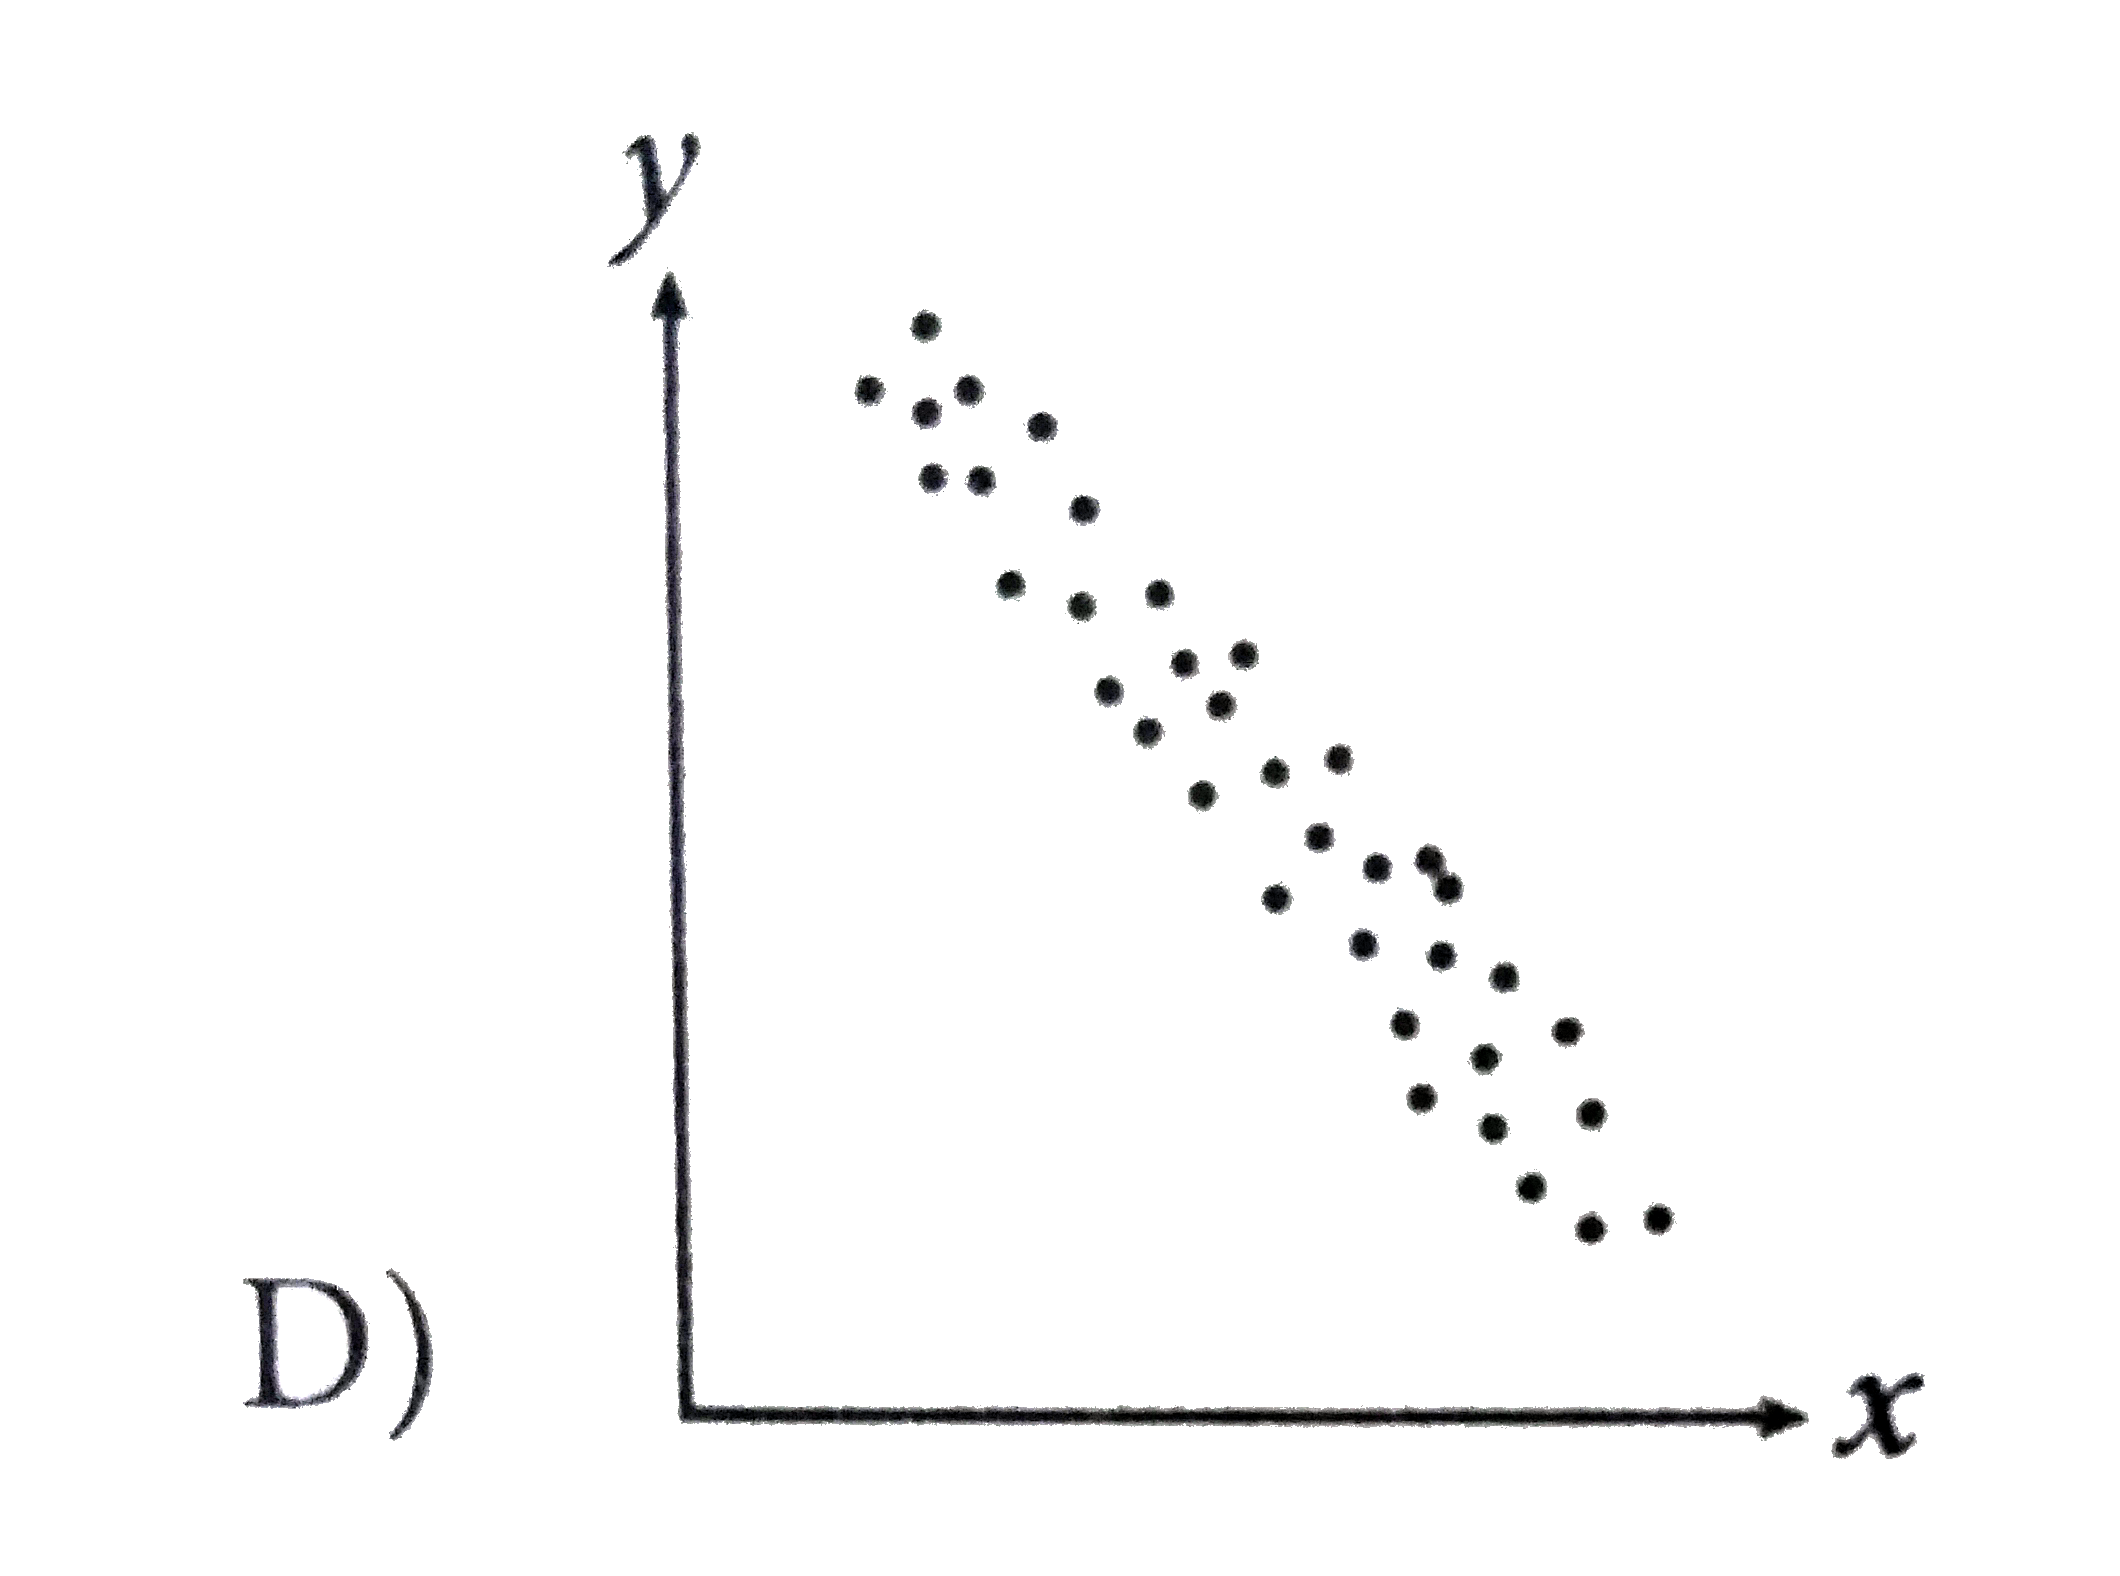
- Question 2 - Select One
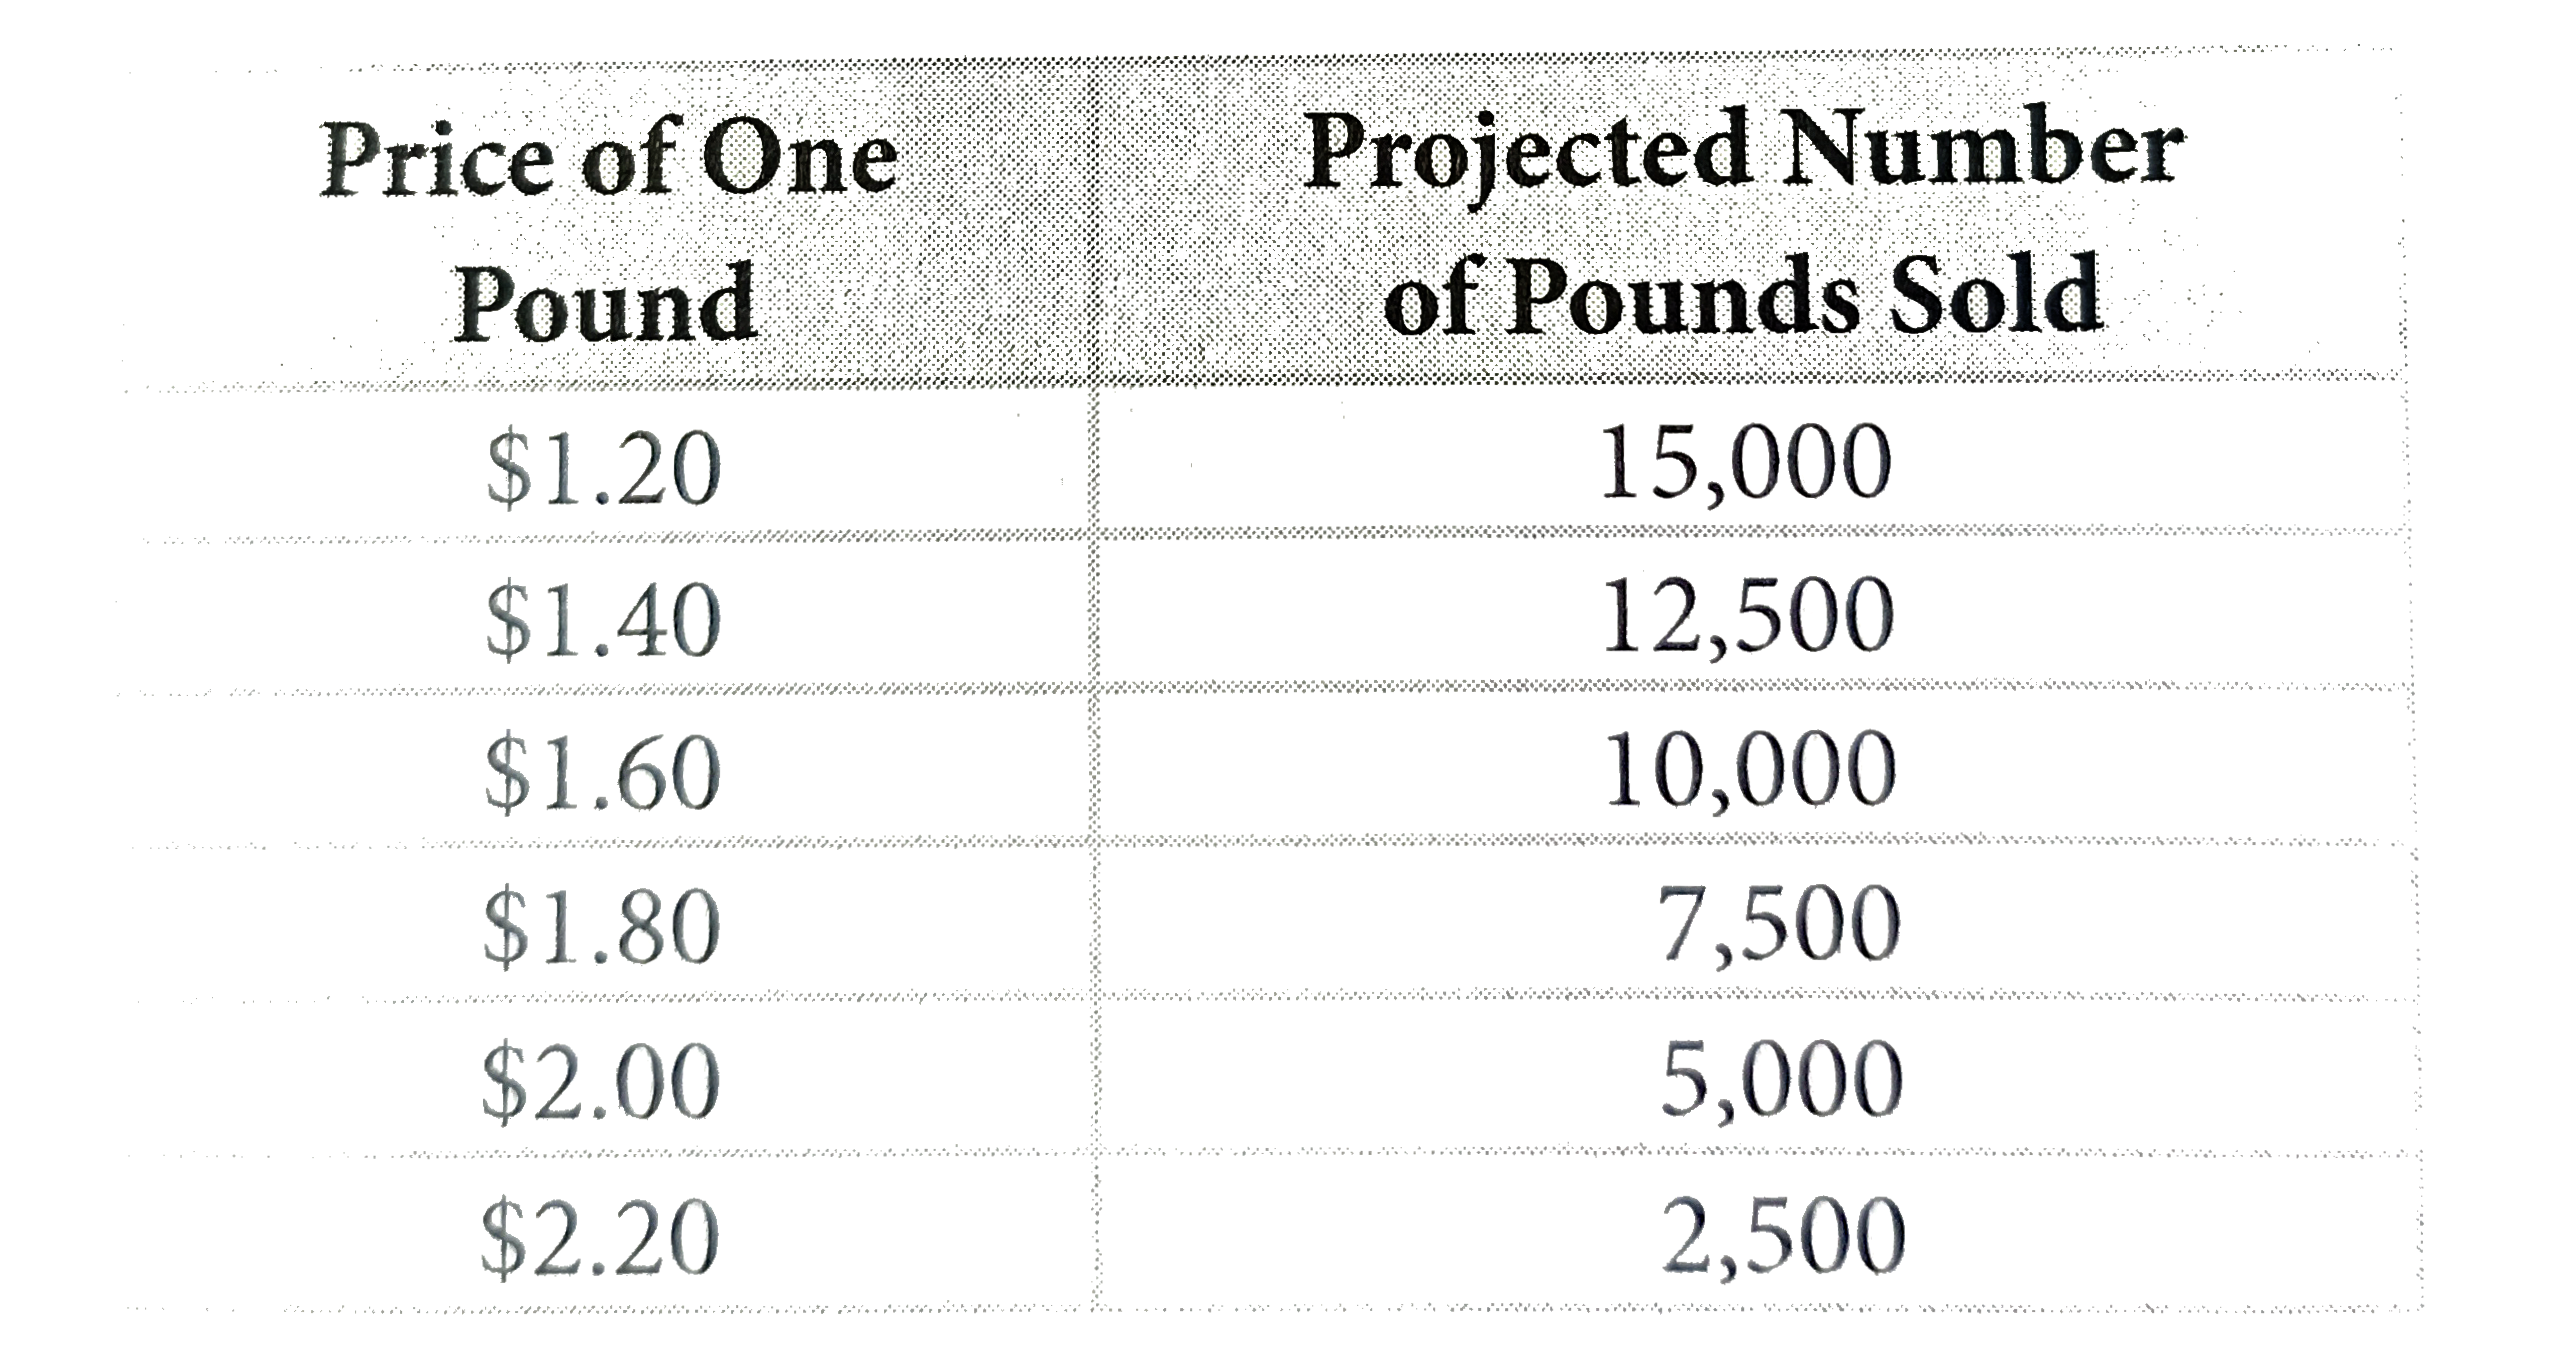
Which of the following equations best, describes the linear relationship shown in the table, where g represents the number of pounds of grain sold and d represnets the price in dollars of one pound of grain ?Ag=1.2d+12.500Bg=12,500d+15,000Cg=−12,500d+17,500Dg=−12,500d+30,000 - Question 3 - Select One
The population, p of a town can be modeled by the equation P=750(1.15)d, where d is the number of decades after the year 1980. Which of the following equations can be used to model the population of the town y years after 1980?
AP=750(4.046)yBP=750(1.15)10yCP=750(1.15)(y10)DP=750(1.015)10y
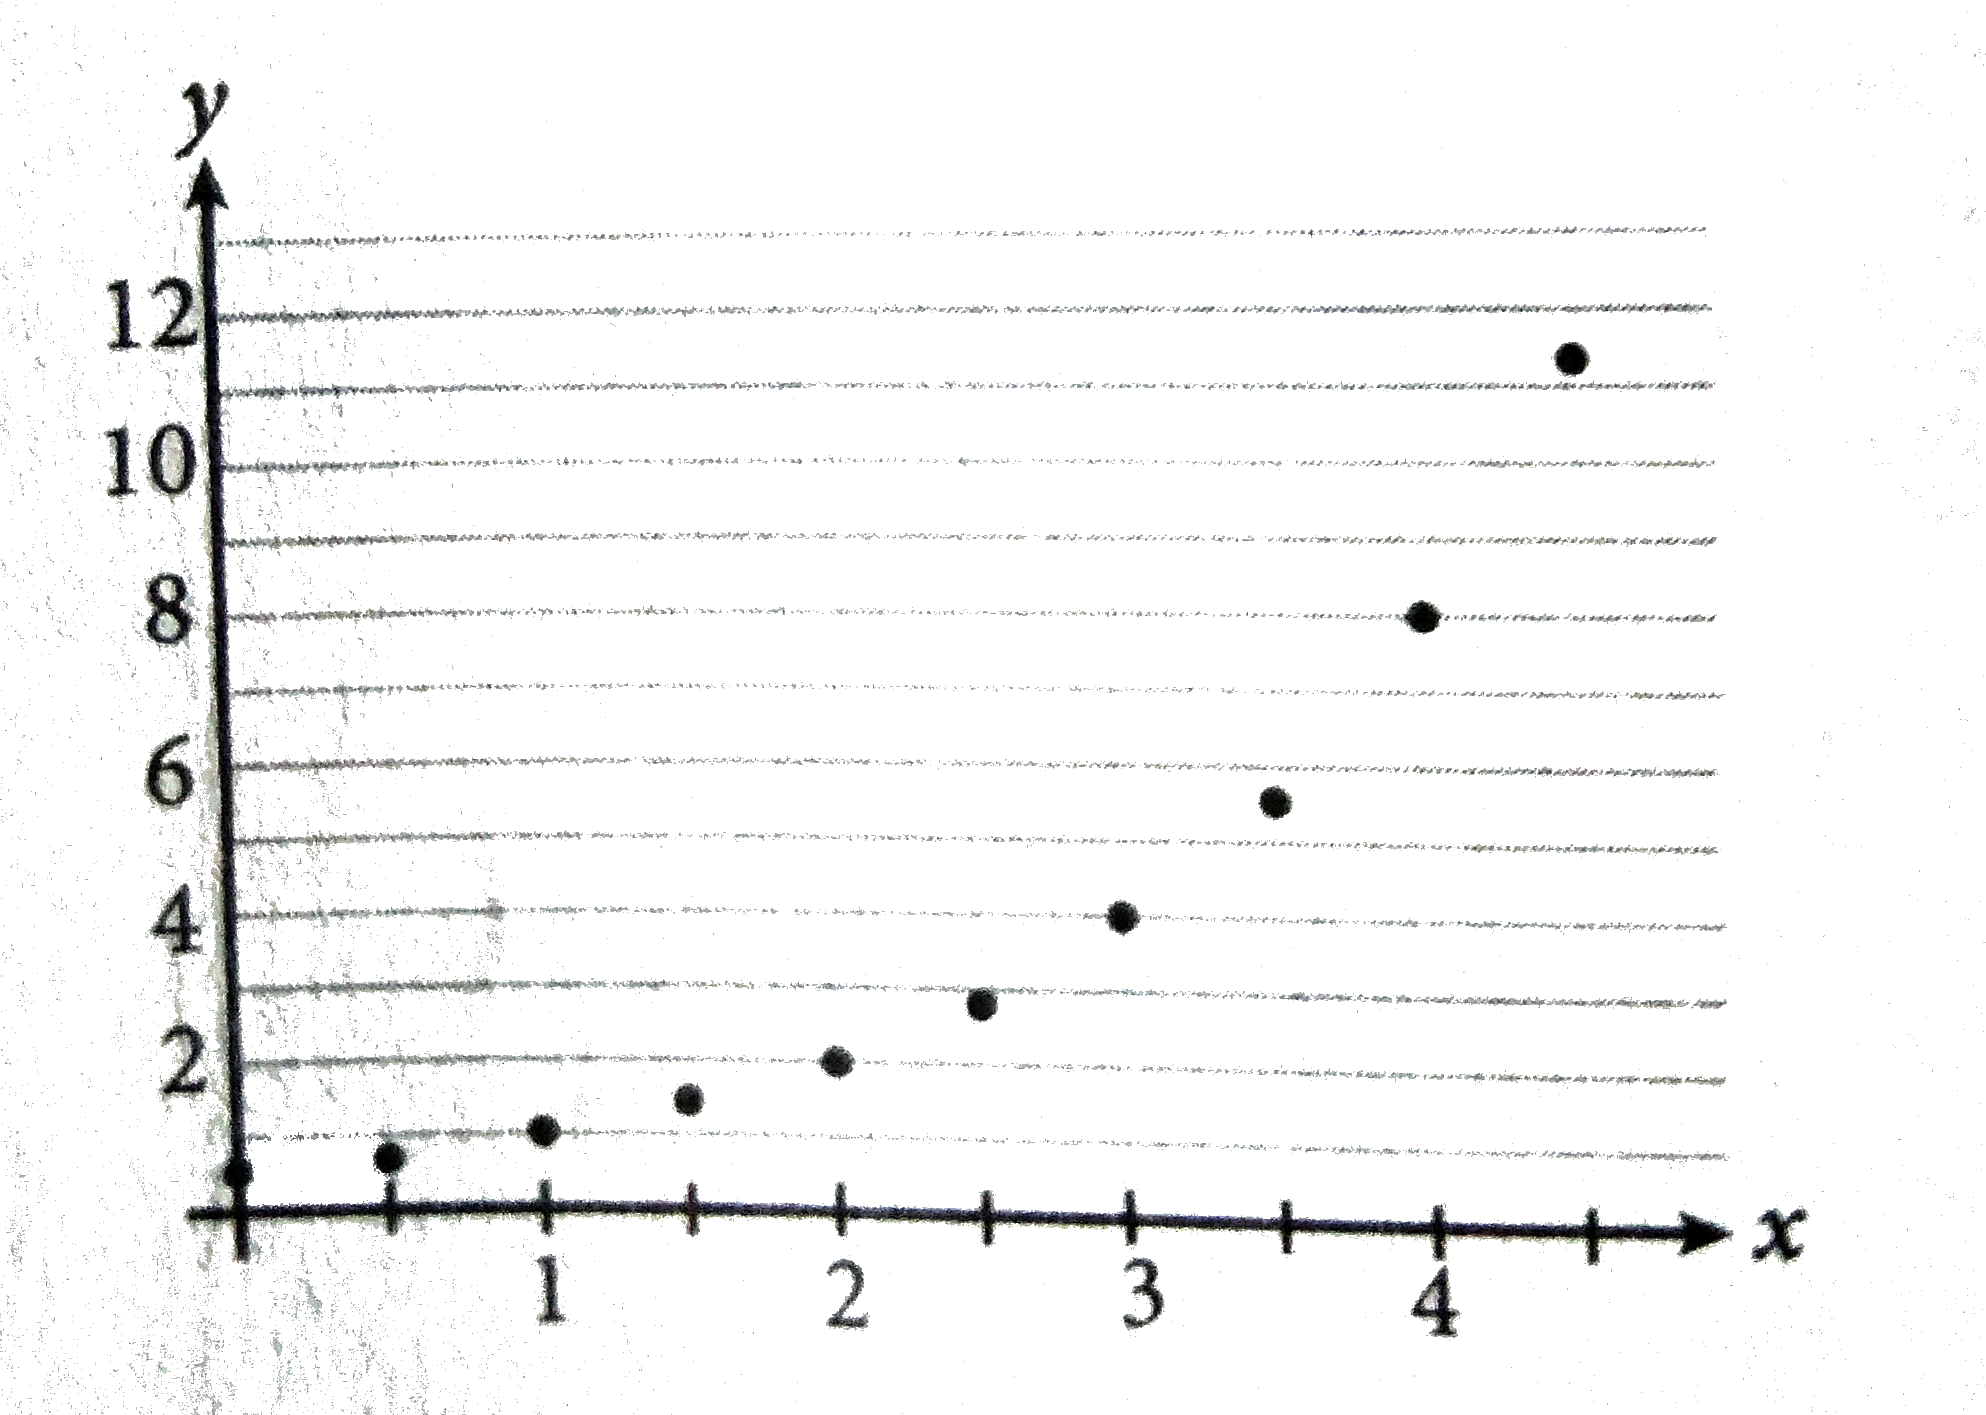
Which of the following equations best models the data shown in the scatterplot above?View SolutionFind the line of best fit for the following data, treating x as dependent variable (Regression equation x on y).

Hence estimate the value of x whey y=16.View SolutionSolve the following system of linear equations graphically. 2x−y−4=0, x+y+1=0
View SolutionSolve the following linear inequation: 2x−4≤0
View Solution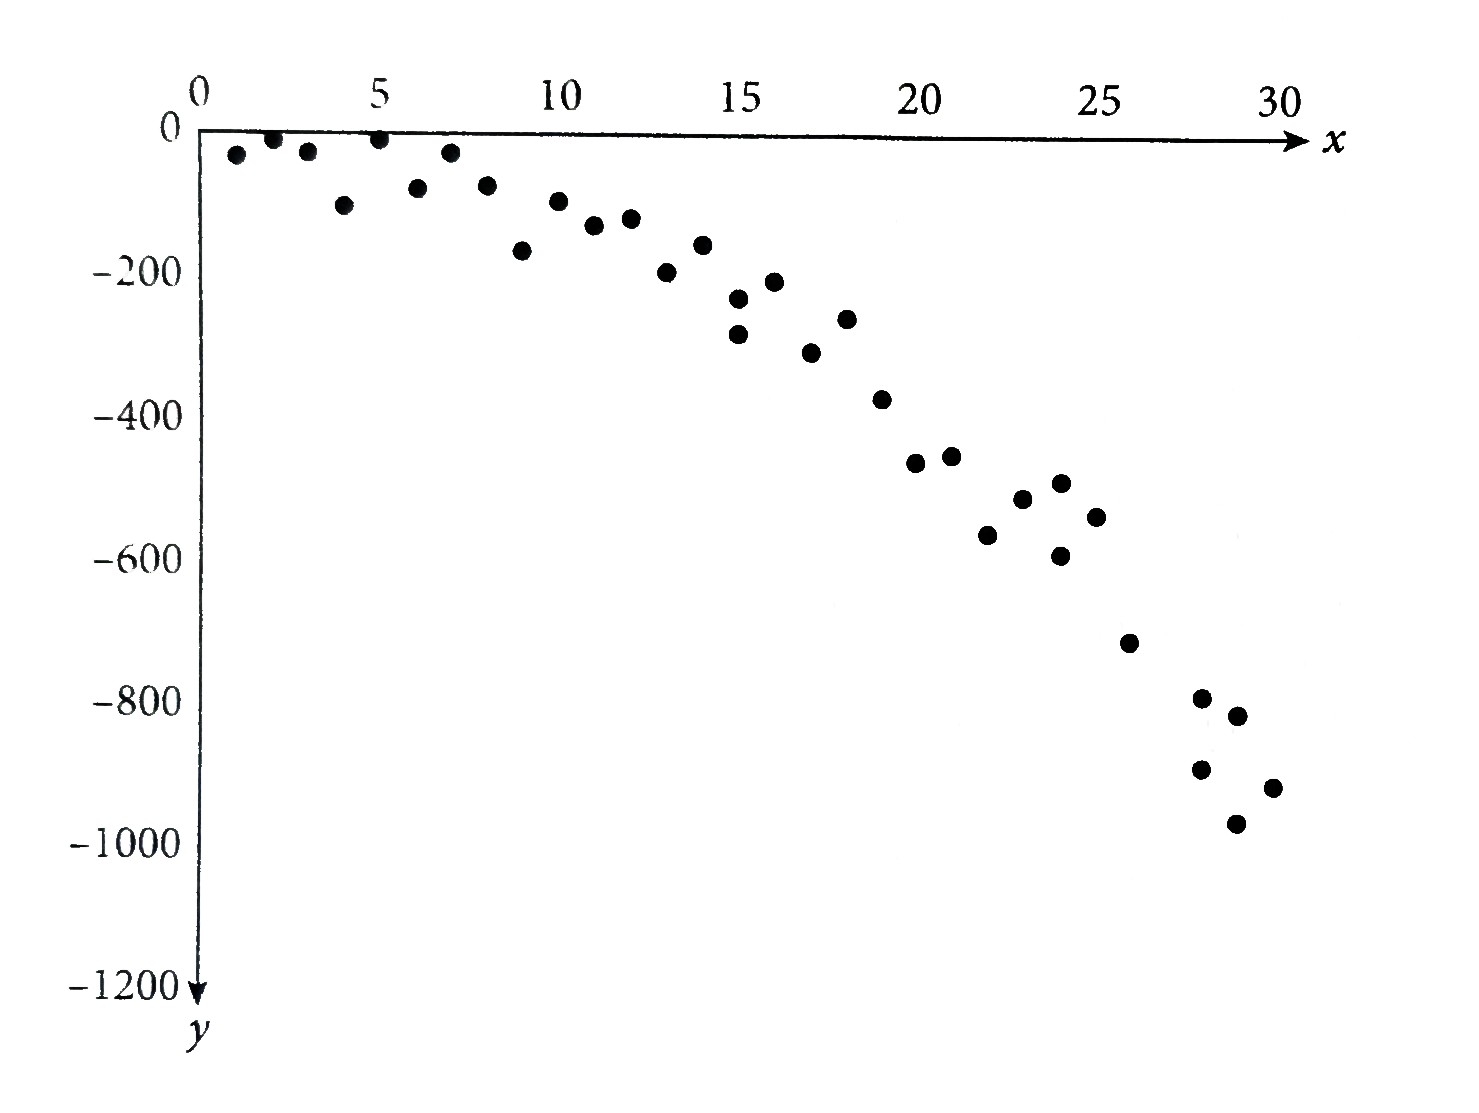
For which of the following values of a and b does the equation y=axb model the data in the scatterplot above ?View Solution
