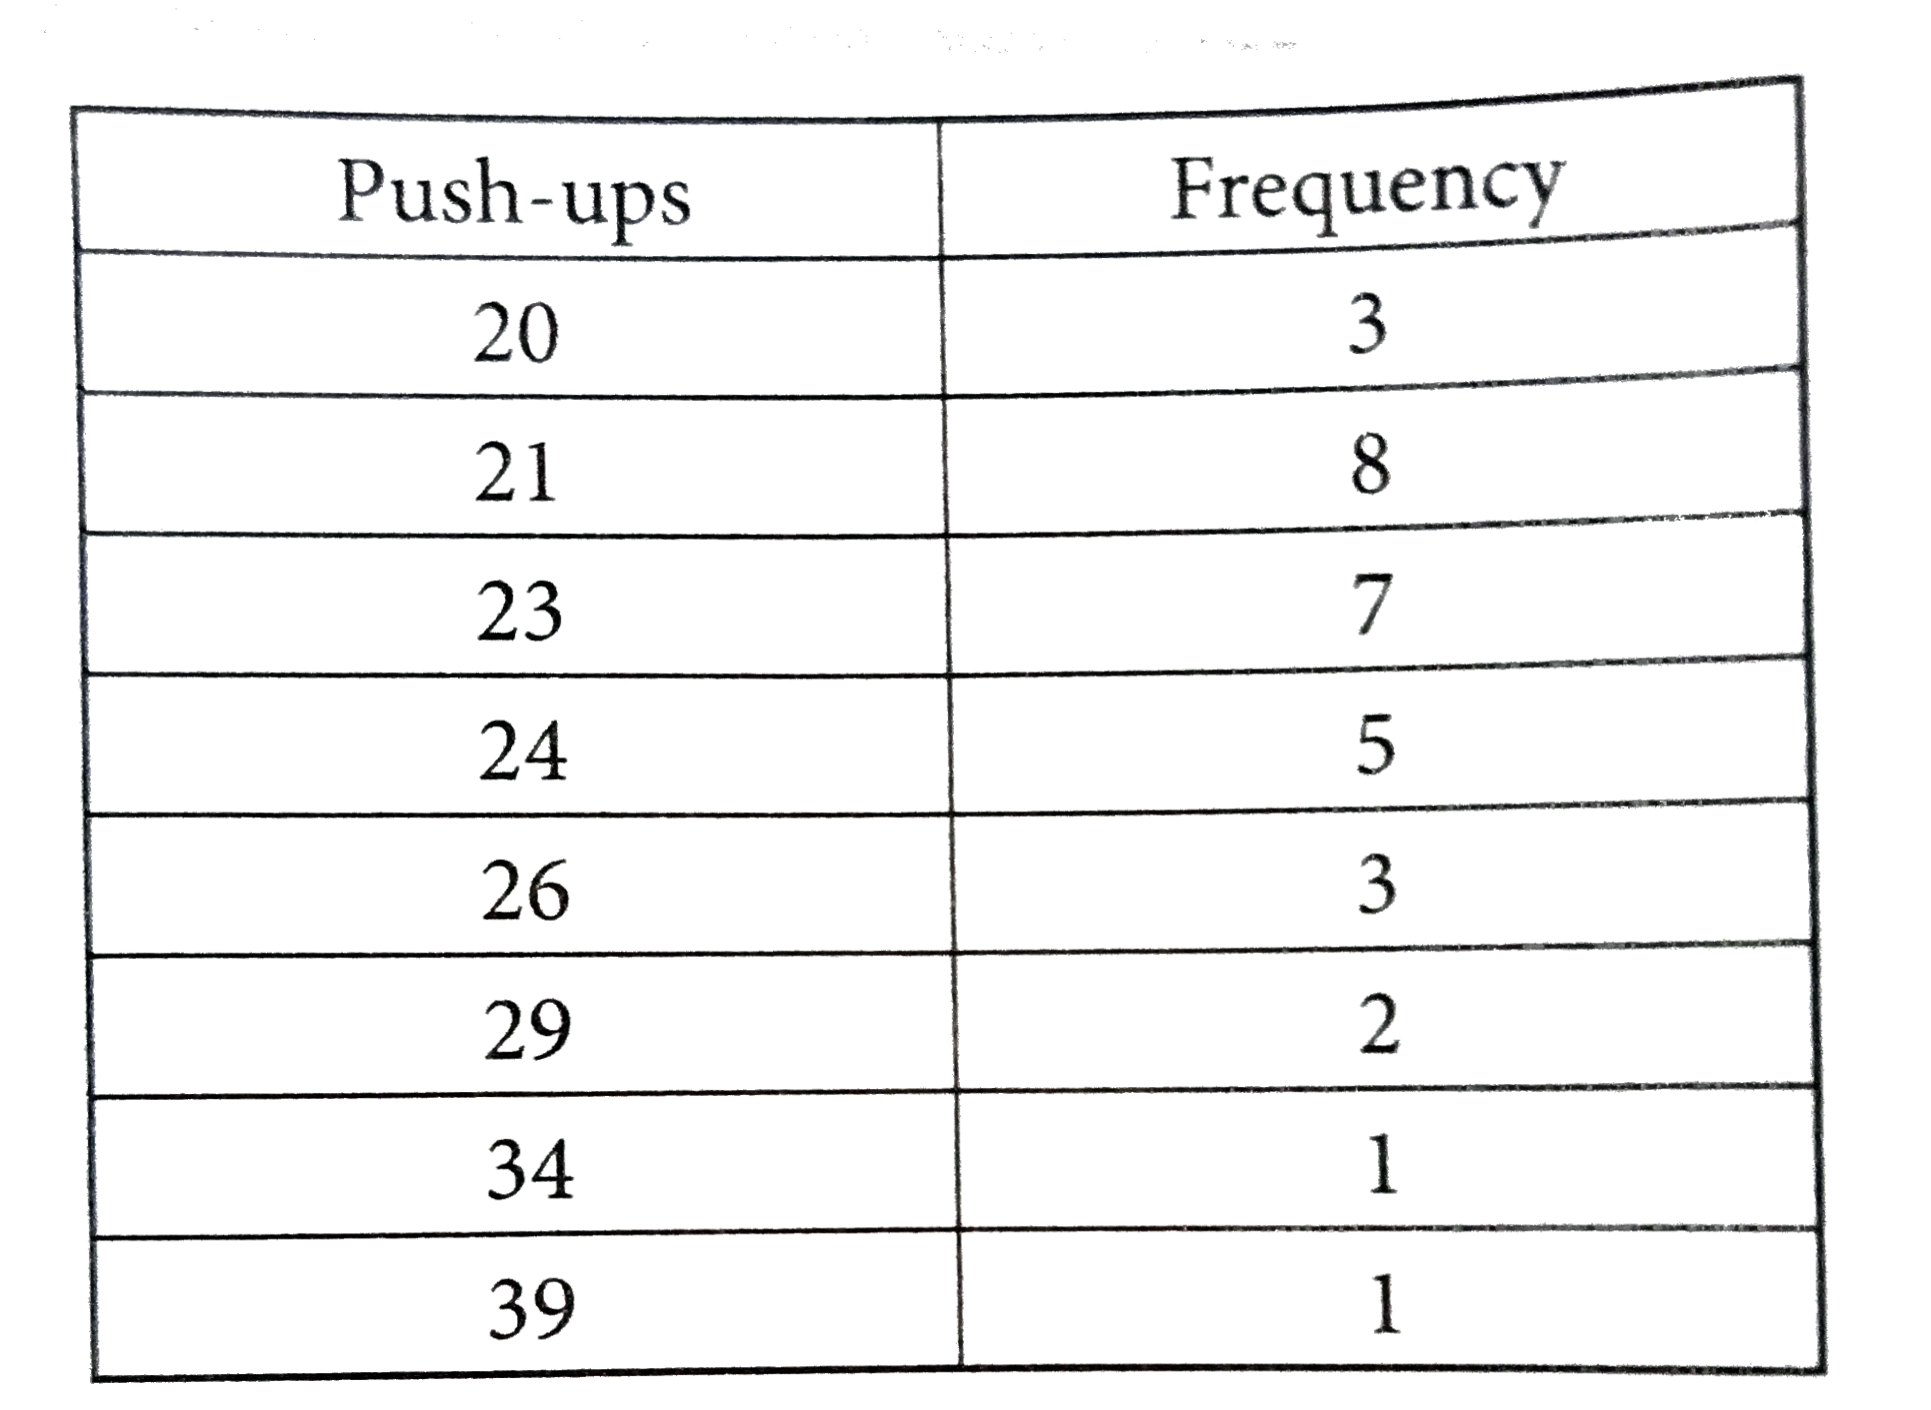
The table above shows the distribution of the number of push ups completed by 30 people in a high school gym class. Which of the following is true the mean, mode, and the range of the numbers of push ups completed?
Mean<Range<mode
Mode<Range<Mean
Range<Mean<Mode
Range<Mode<Mean
The correct Answer is:D
Step by step video, text & image solution for The table above shows the distribution of the number of push ups completed by 30 people in a high school gym class. Which of the following is true the mean, mode, and the range of the numbers of push ups completed? by Maths experts to help you in doubts & scoring excellent marks in Class 12 exams.
Topper's Solved these Questions
- BOOK - PRINCETONCHAPTER - ARITHMETICEXERCISE - QUICK QUIZ #103videos
ARITHMETIC
- BOOK - PRINCETONCHAPTER - ARITHMETICEXERCISE - QUICK QUIZ #113videos
ARITHMETIC
- BOOK - PRINCETONCHAPTER - ARITHMETICEXERCISE - QUICK QUIZ #83videos
ARITHMETIC
- BOOK - PRINCETONCHAPTER - ALGEBRA: CRACKING THE SYSTEMEXERCISE - Algebra Drill 2: Calculator-Permitted Section6videos
ALGEBRA: CRACKING THE SYSTEM
- BOOK - PRINCETONCHAPTER - FUN WITH FUNDAMENTALSEXERCISE - Fundamental Drill 2: Calculator- Permitted Section6videos
FUN WITH FUNDAMENTALS
Similar Questions
Ages of 20 Students Enrolled in a College Class
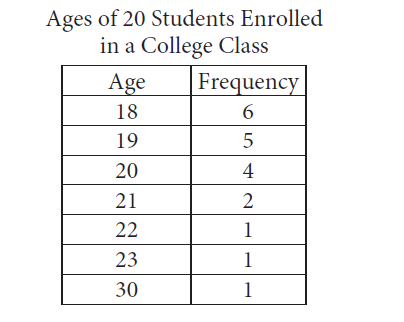
The table above shows the distribution of ages of the 20 students enrolled in a college class. Which of the following gives the correct order of the mean, median, and mode of the ages?View Solution
The table above shows two lists of numbers. Which of the following is a true statement comparing list A and list B ?View Solution
Knowledge Check
- Question 1 - Select One
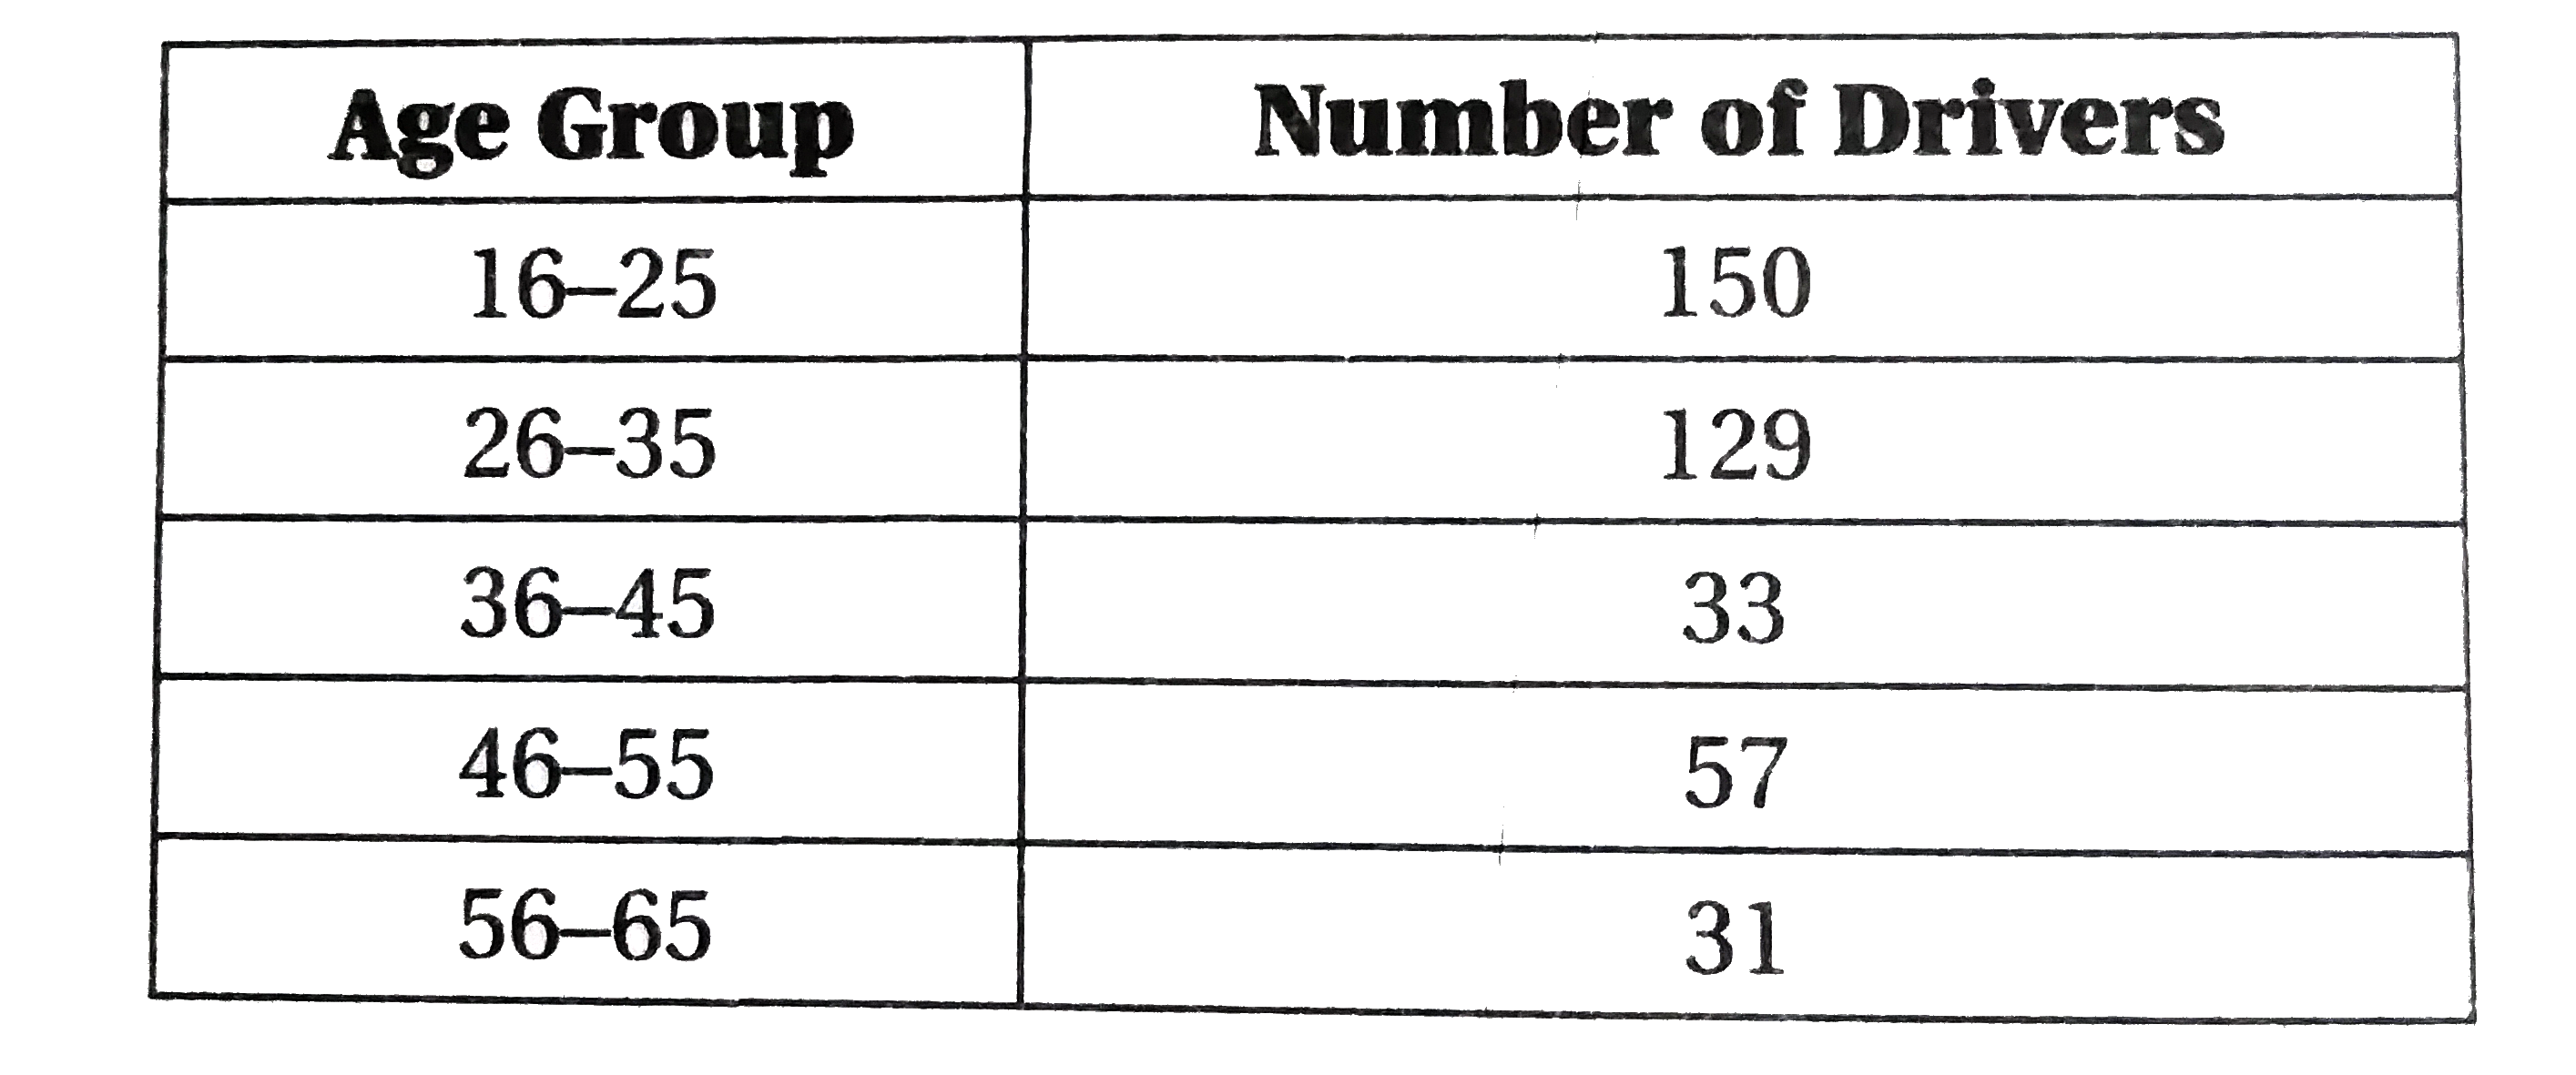
The table above summarizes the number of people by age group who were included in a survey of driving habits. Which of the following statements is true?AThe survey was not biased since different age groups were included.BThe survey was biased becouse individuals 36 and older were underrespresented.CThe survey was biased because it did not differentiate between males and femalesDThe survey was not biased since a large number of drivers were polled. - Question 2 - Select One
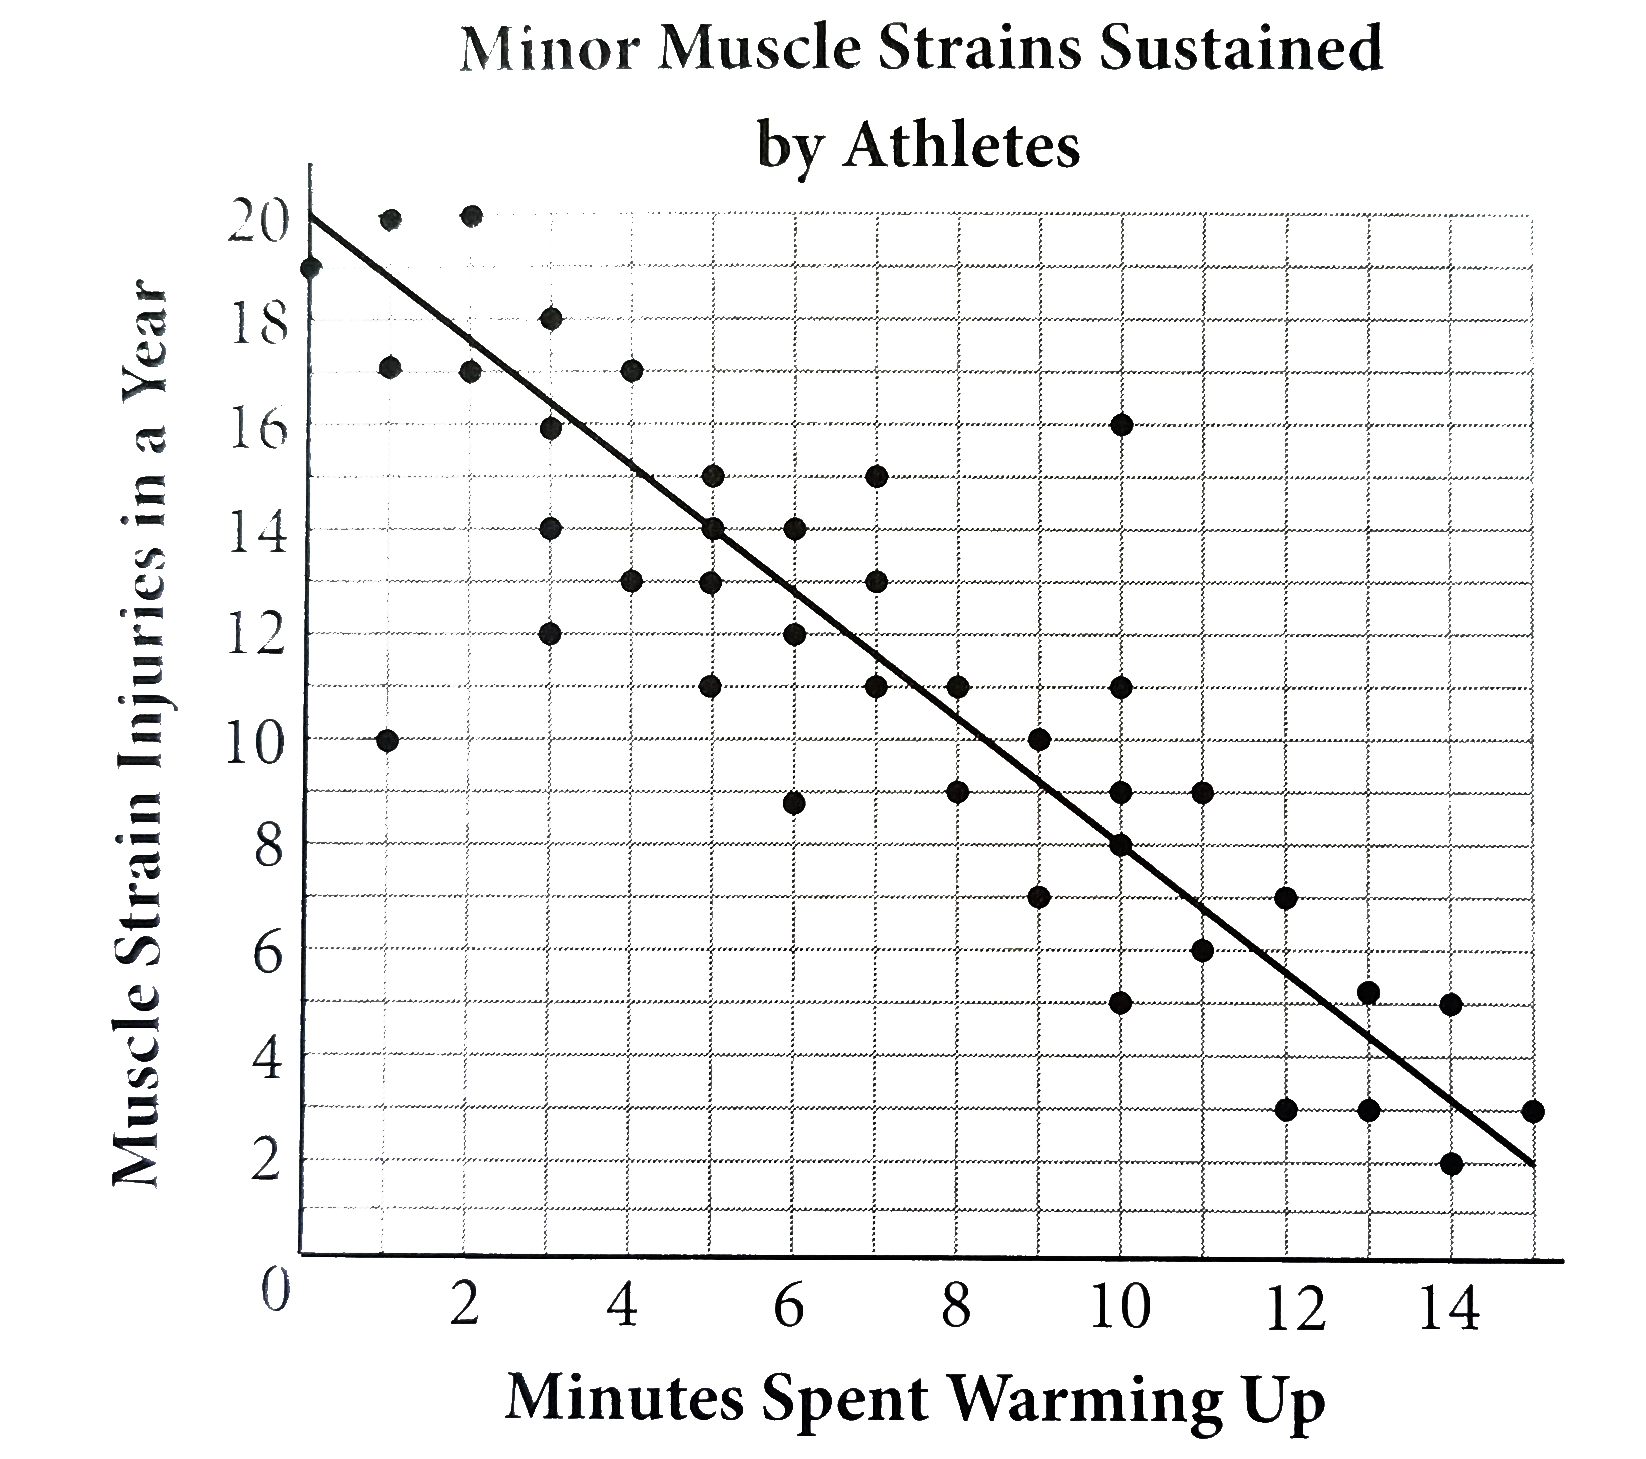
The scatterplot above shows the number of minor muscle strain injuries sutained in a year by athletes, plotted against their self-reported amount of time spent stretching and doing other "warm up" activities before energing in rigorous physical activity. Which of the following best estimates the average rate of change in the number of injuries compared with the number of minutes spent warmig up ?A−1.2B−0.8C2D20 - Question 3 - Select One
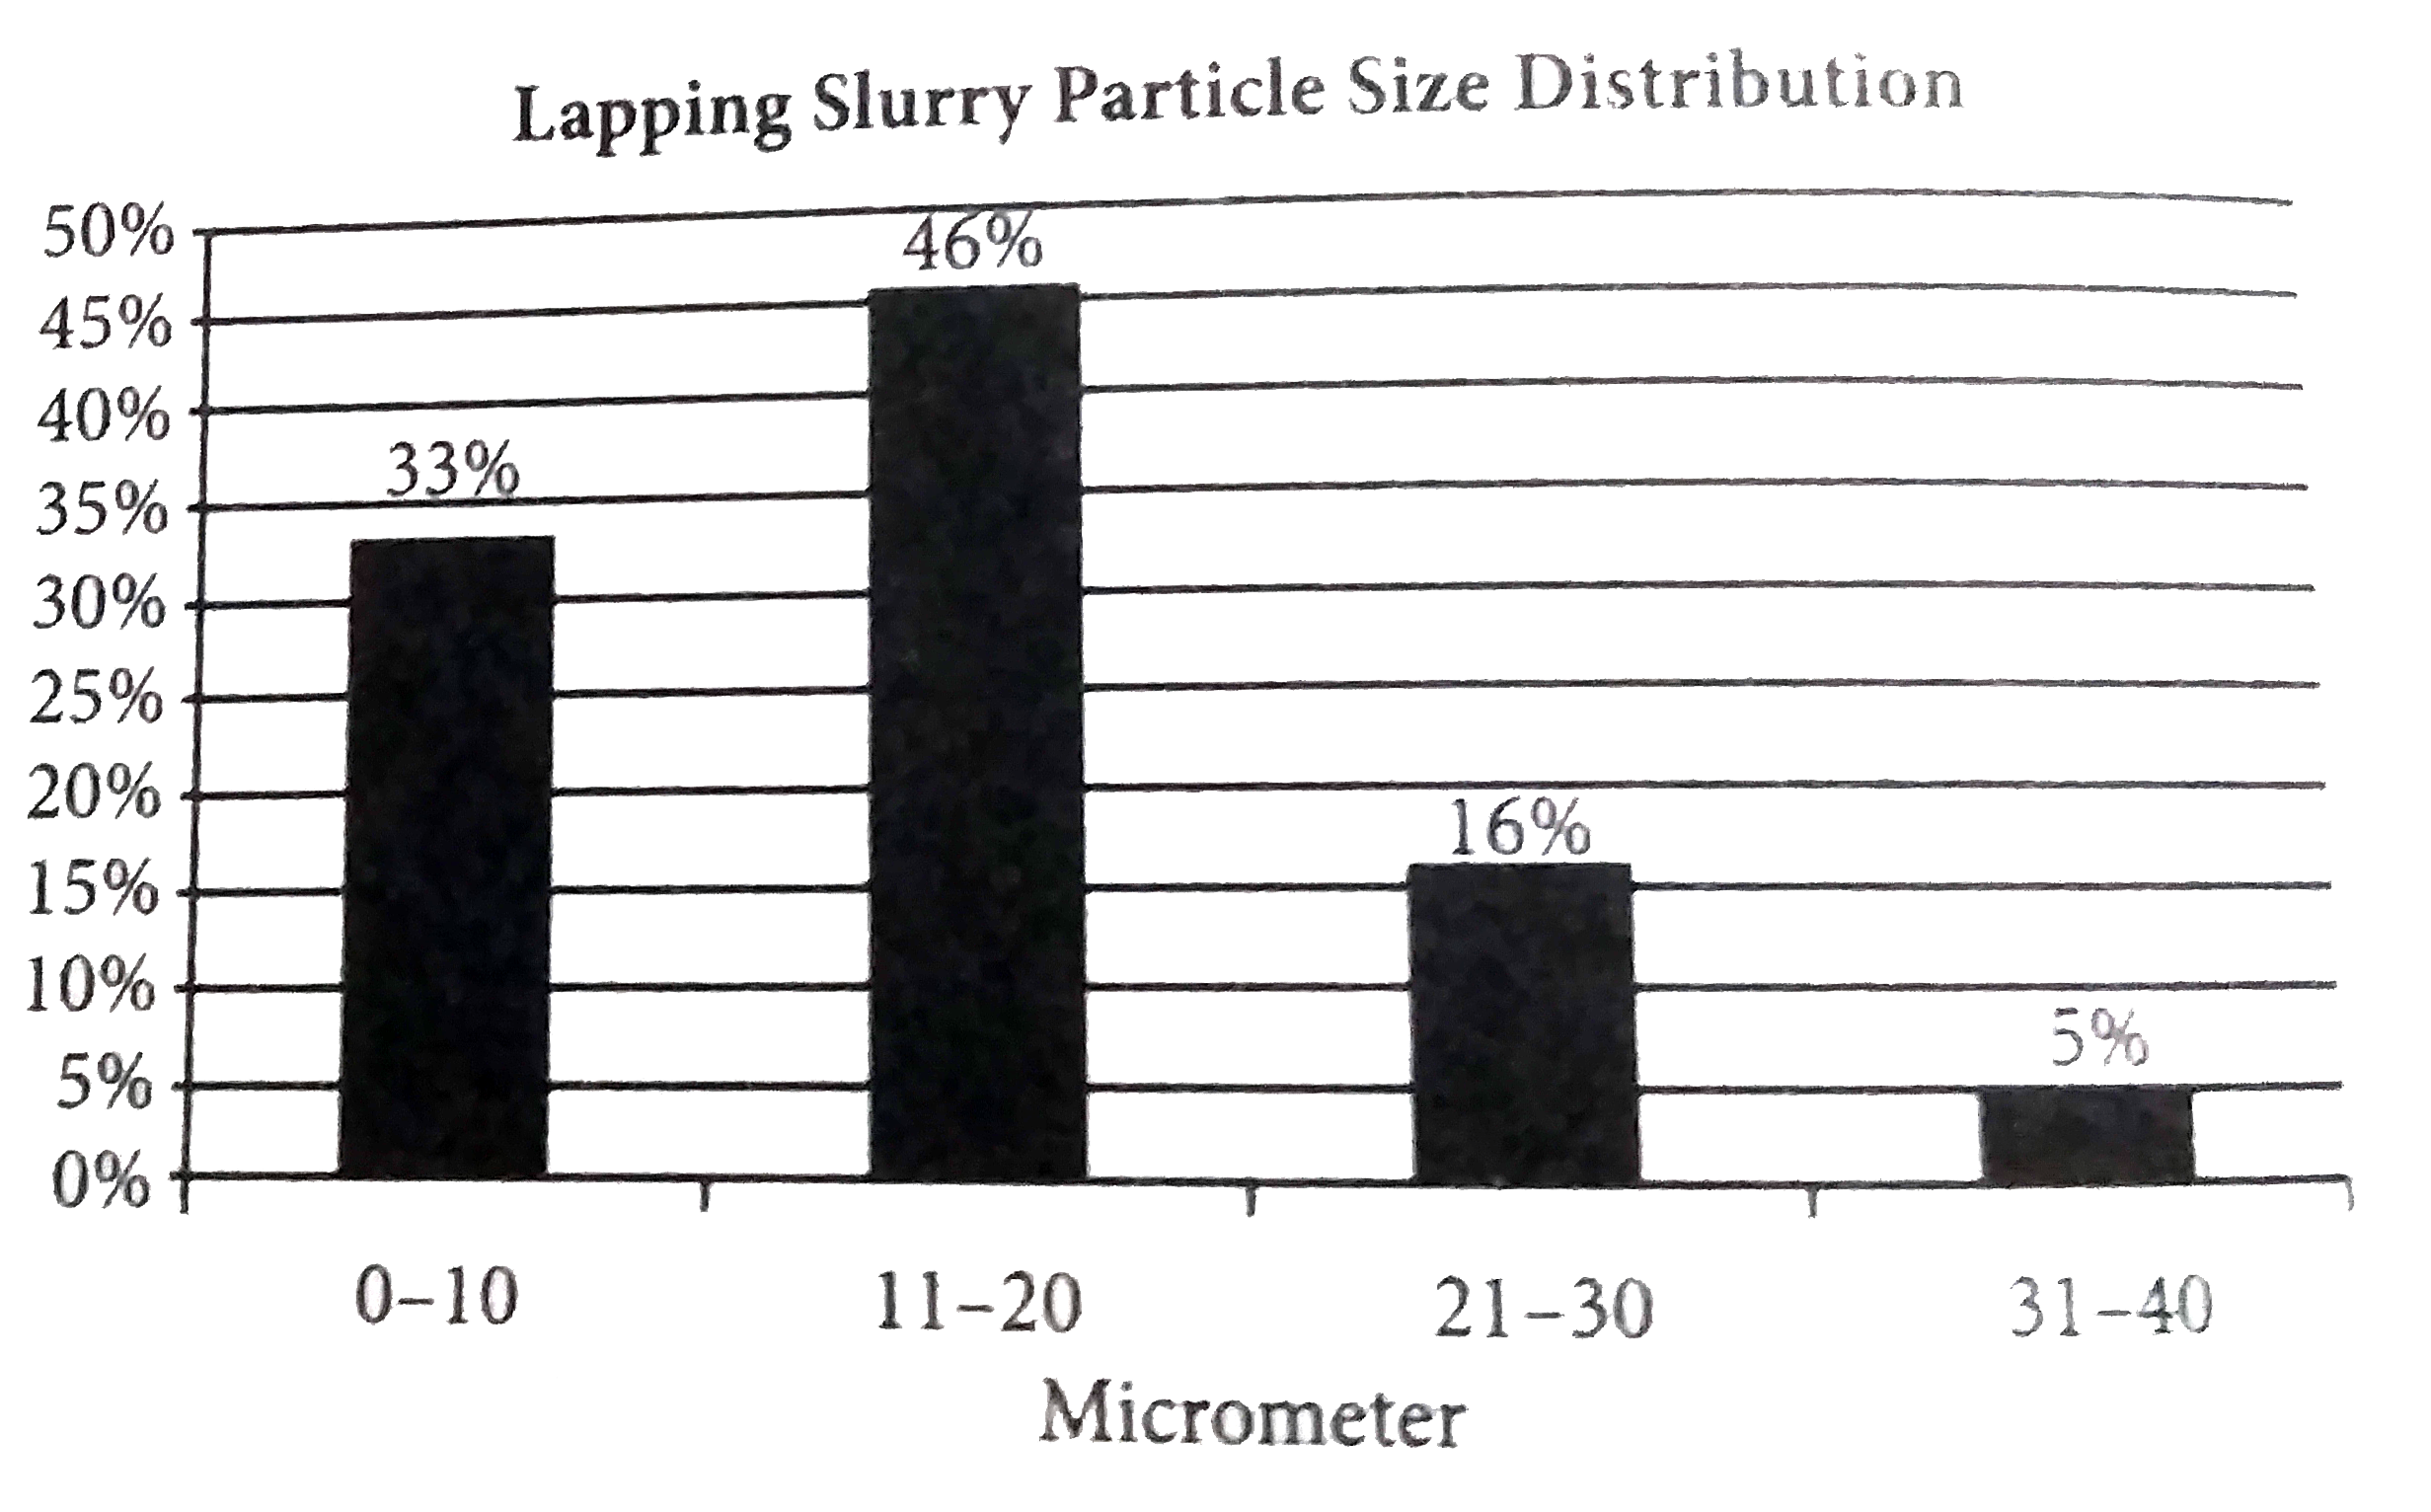
A lapping slurry contains microbeads suspended in a solution and is used to polish a silicon wafer by abrasion of the surface. The distribution of the particle size, in micrometers, is shown above. If the particle size distribution ranges were changed to 0-20 micrometers and 21-40 micrometers, which of the following is the closest to the ratio of the number of 0-20 micrometer microbeads to the number of 21-40 micrometer microbeads?A3:1B4:1C5:2D9:1
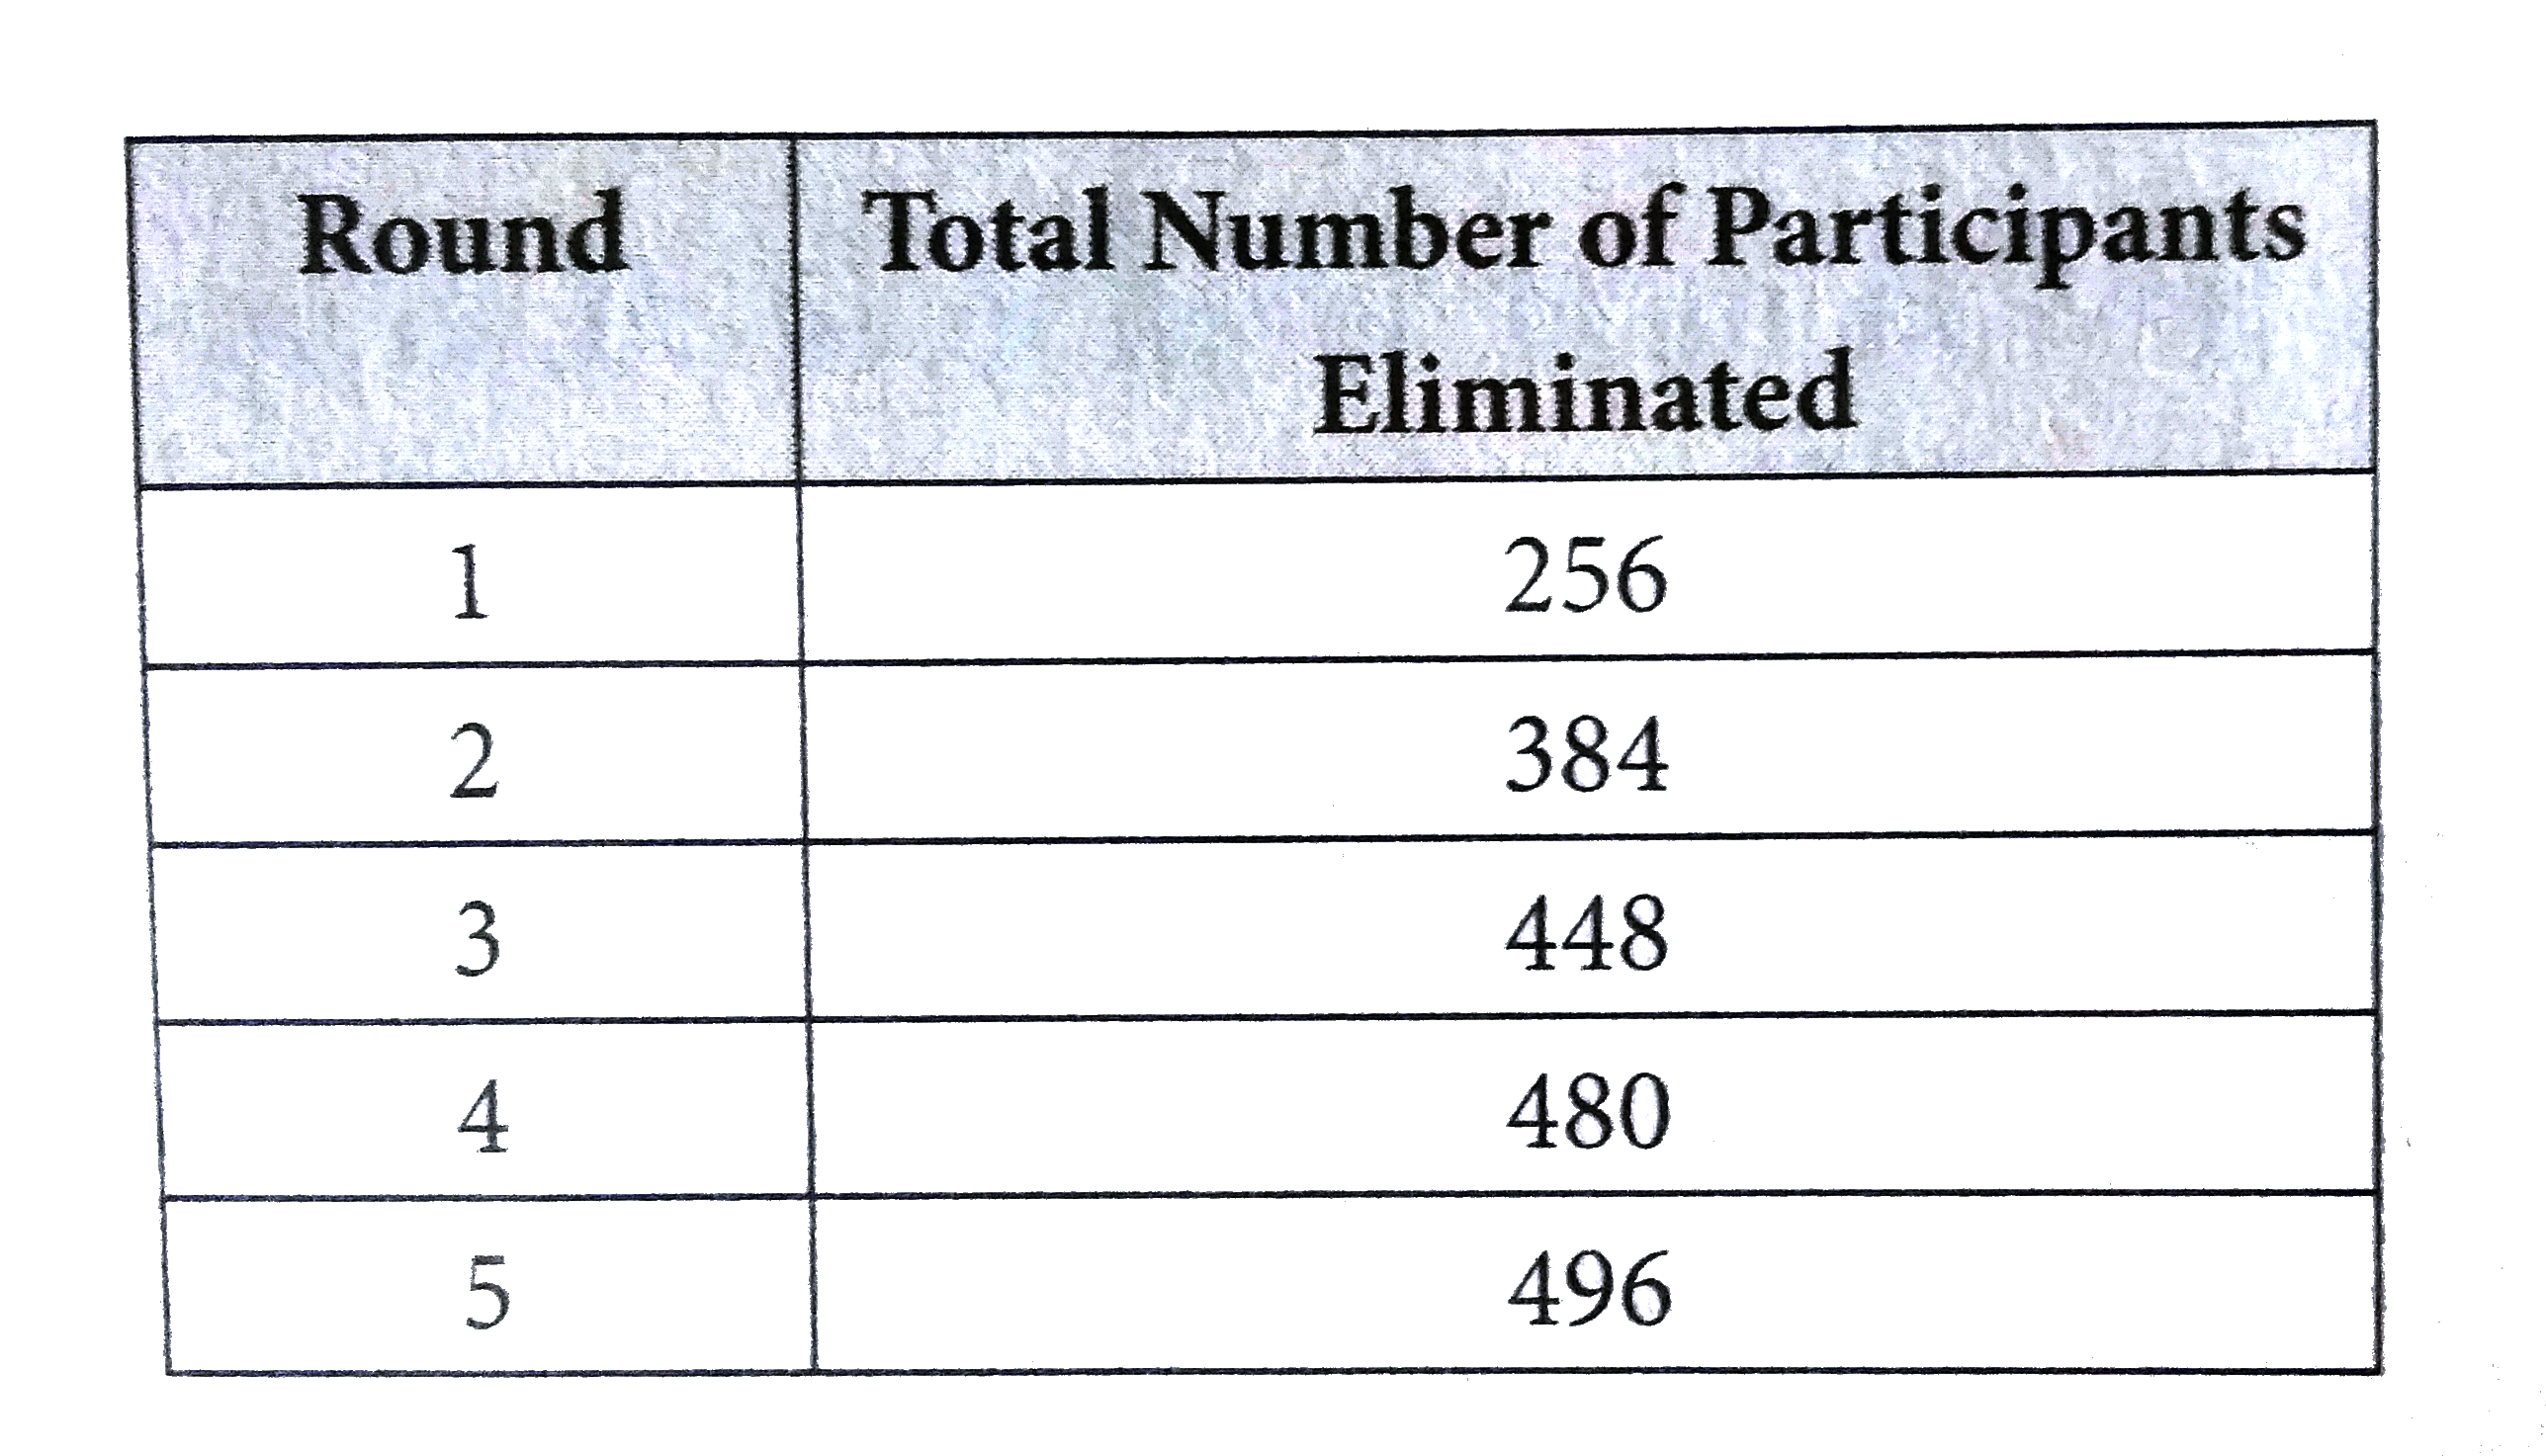
The table above shows the cummulative number of participants eliminated in a national miniature golf tournament by the end of each round. Which of the following best describes the relationship between the round and the number of participants remaining in the tournament?View SolutionQ=17.6T
The equation above shows the heat energy ,Q, in Joules that is absorbed by a 10g block of wood as temperature T. in degrees Celsius, increases. Which of the following best describes the meaning of the number 17.6 in this equation?View Solution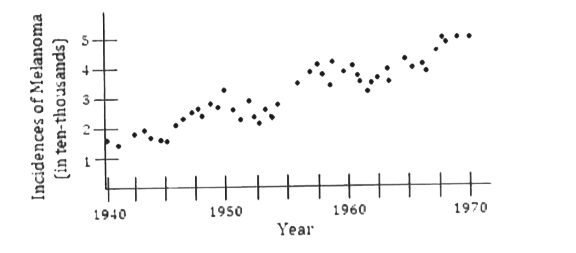
The scatterplot above shows the numbers of people diagnosed with melanoma, in ten - thousands, from 1940 to 1970. Based on the data shown in the figure, which of the following values is closest to the range of the number of incidences of melanoma between 1945 and 1950?View SolutionThe average number of students per classroom at Central High School from 2000 to 2010 can be modeled by the equation y = 0.56 + 27.2 x , where x represents the number of years since 2000, and y represents the average number of students per classroom. Which of the following best describes the meaning of the number 0.56 in the equation?
View Solution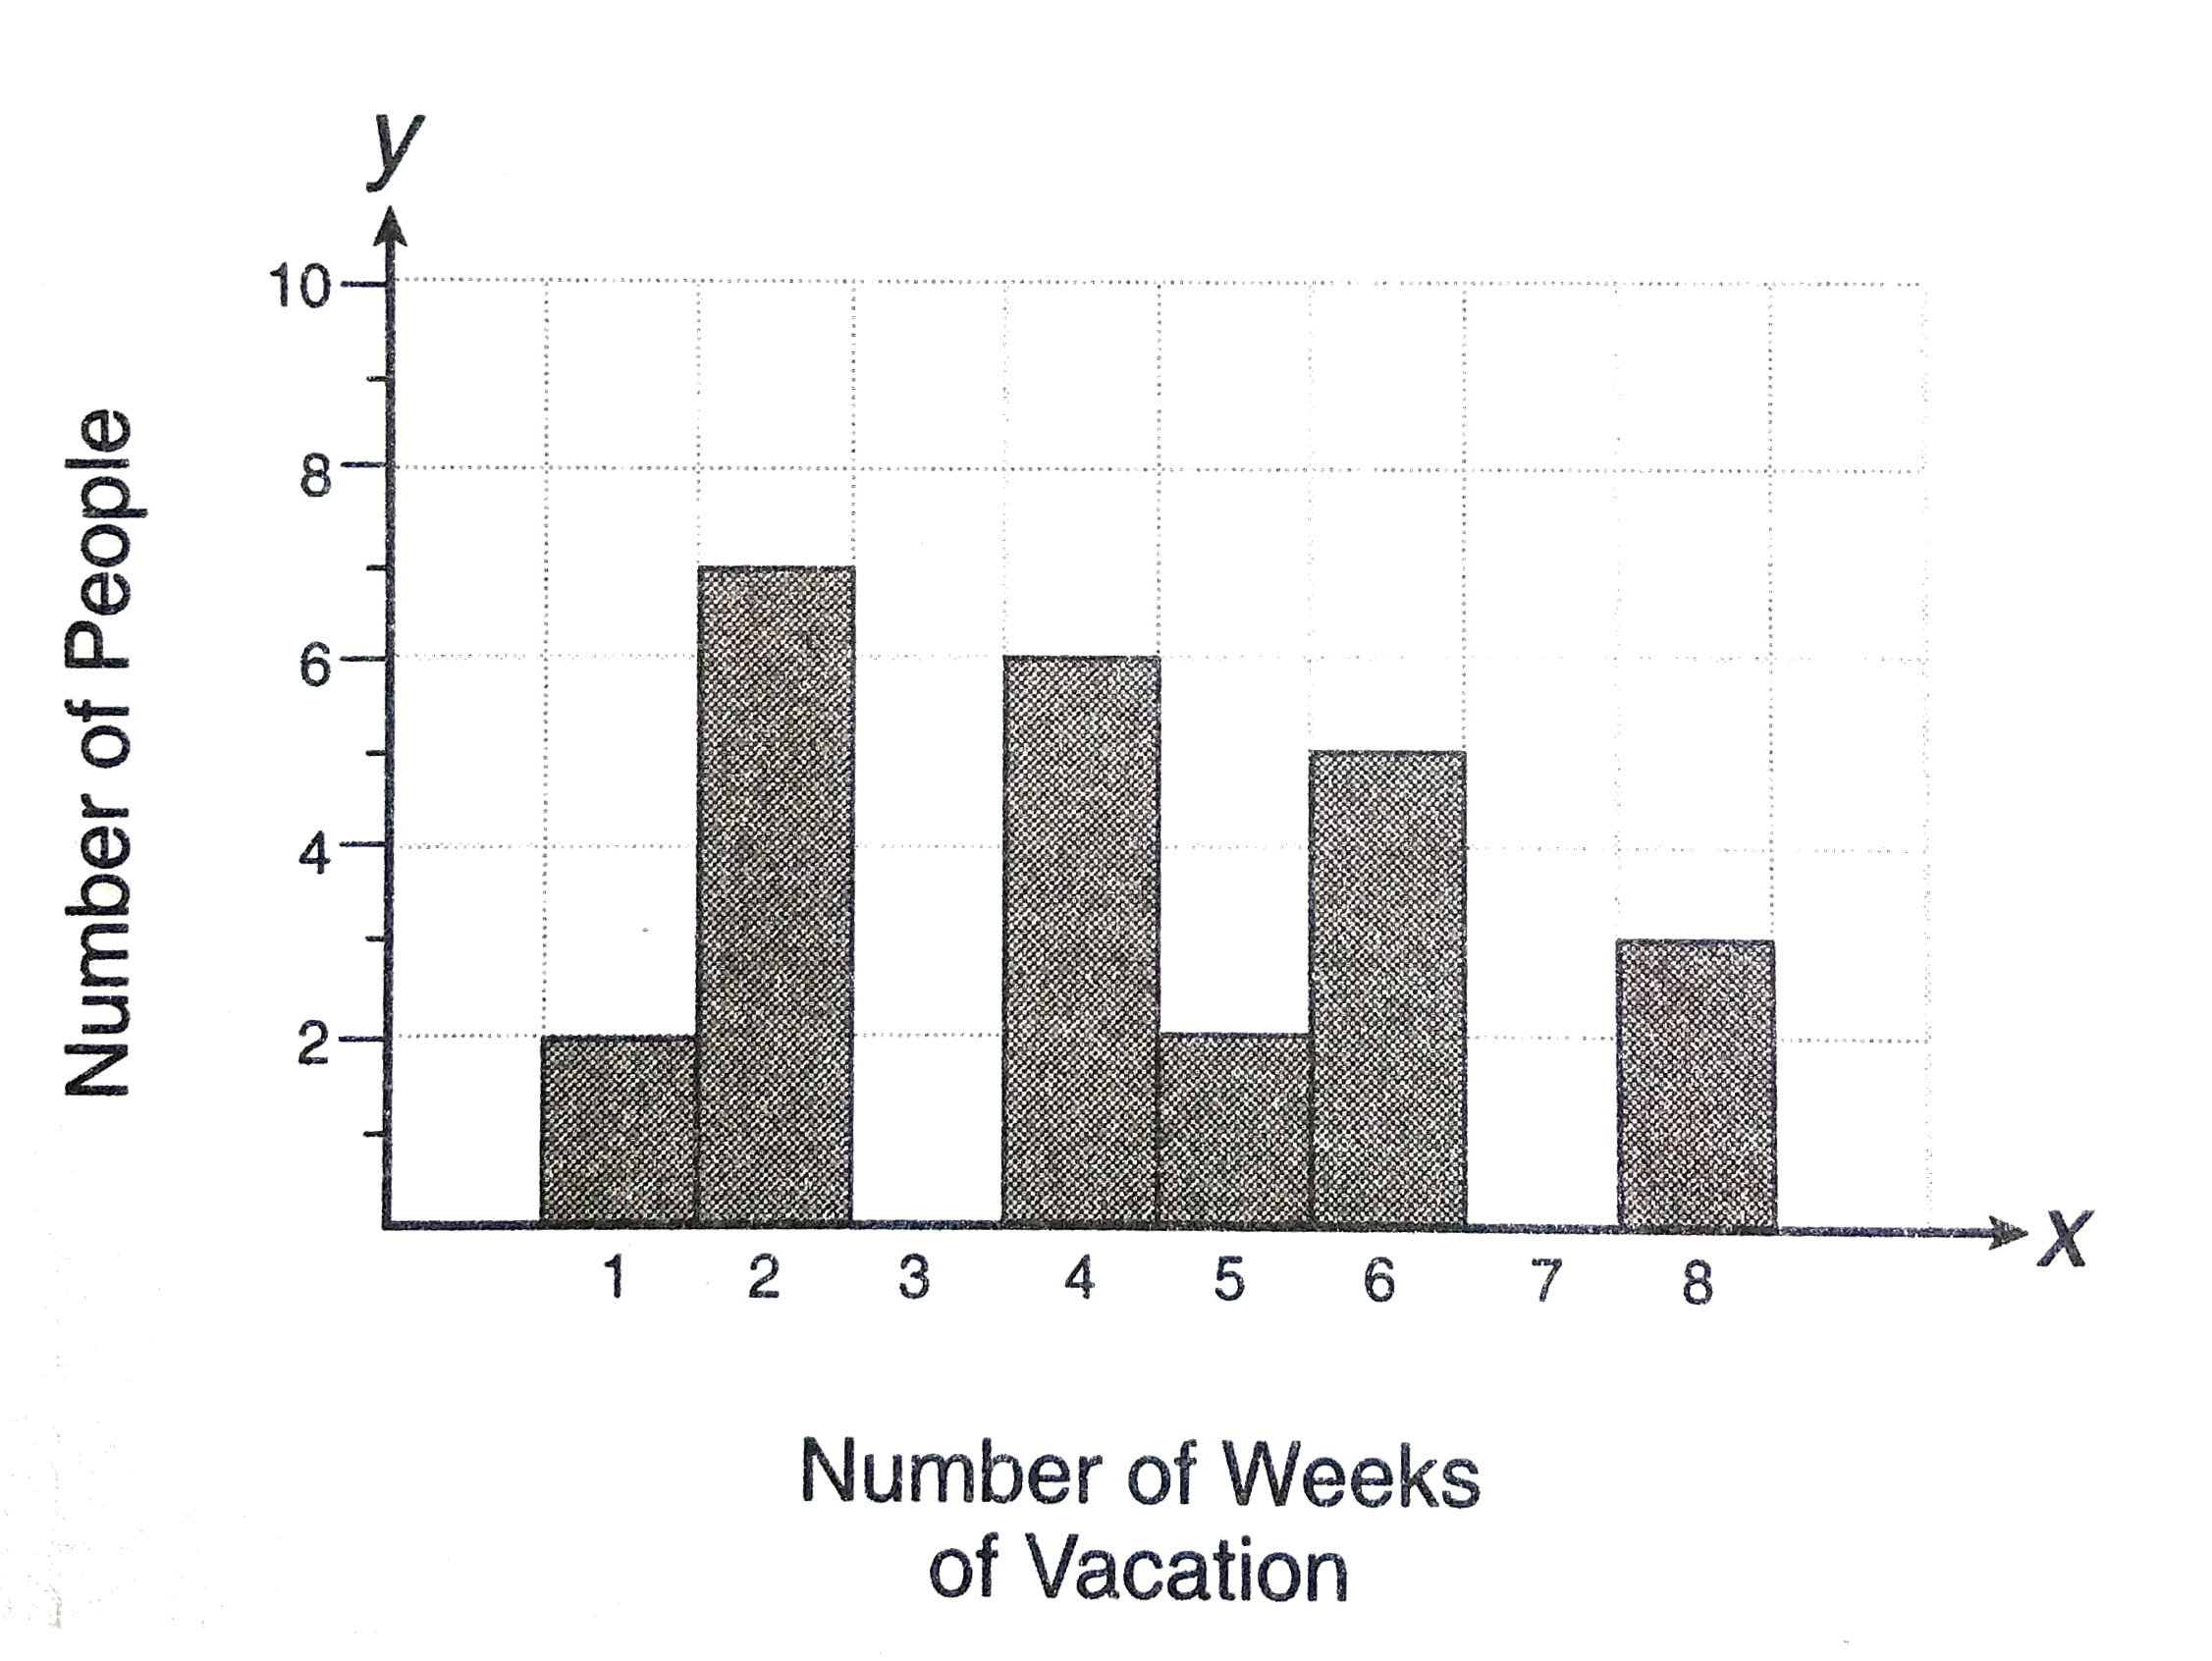
The histogram above shows the result of a survey taken of 25 individuals who were polled about how many weeks of vacation per year they receive. Which of the following is closest to the average (arithmetic mean) number of weeks of vacation per individual?View Solution

