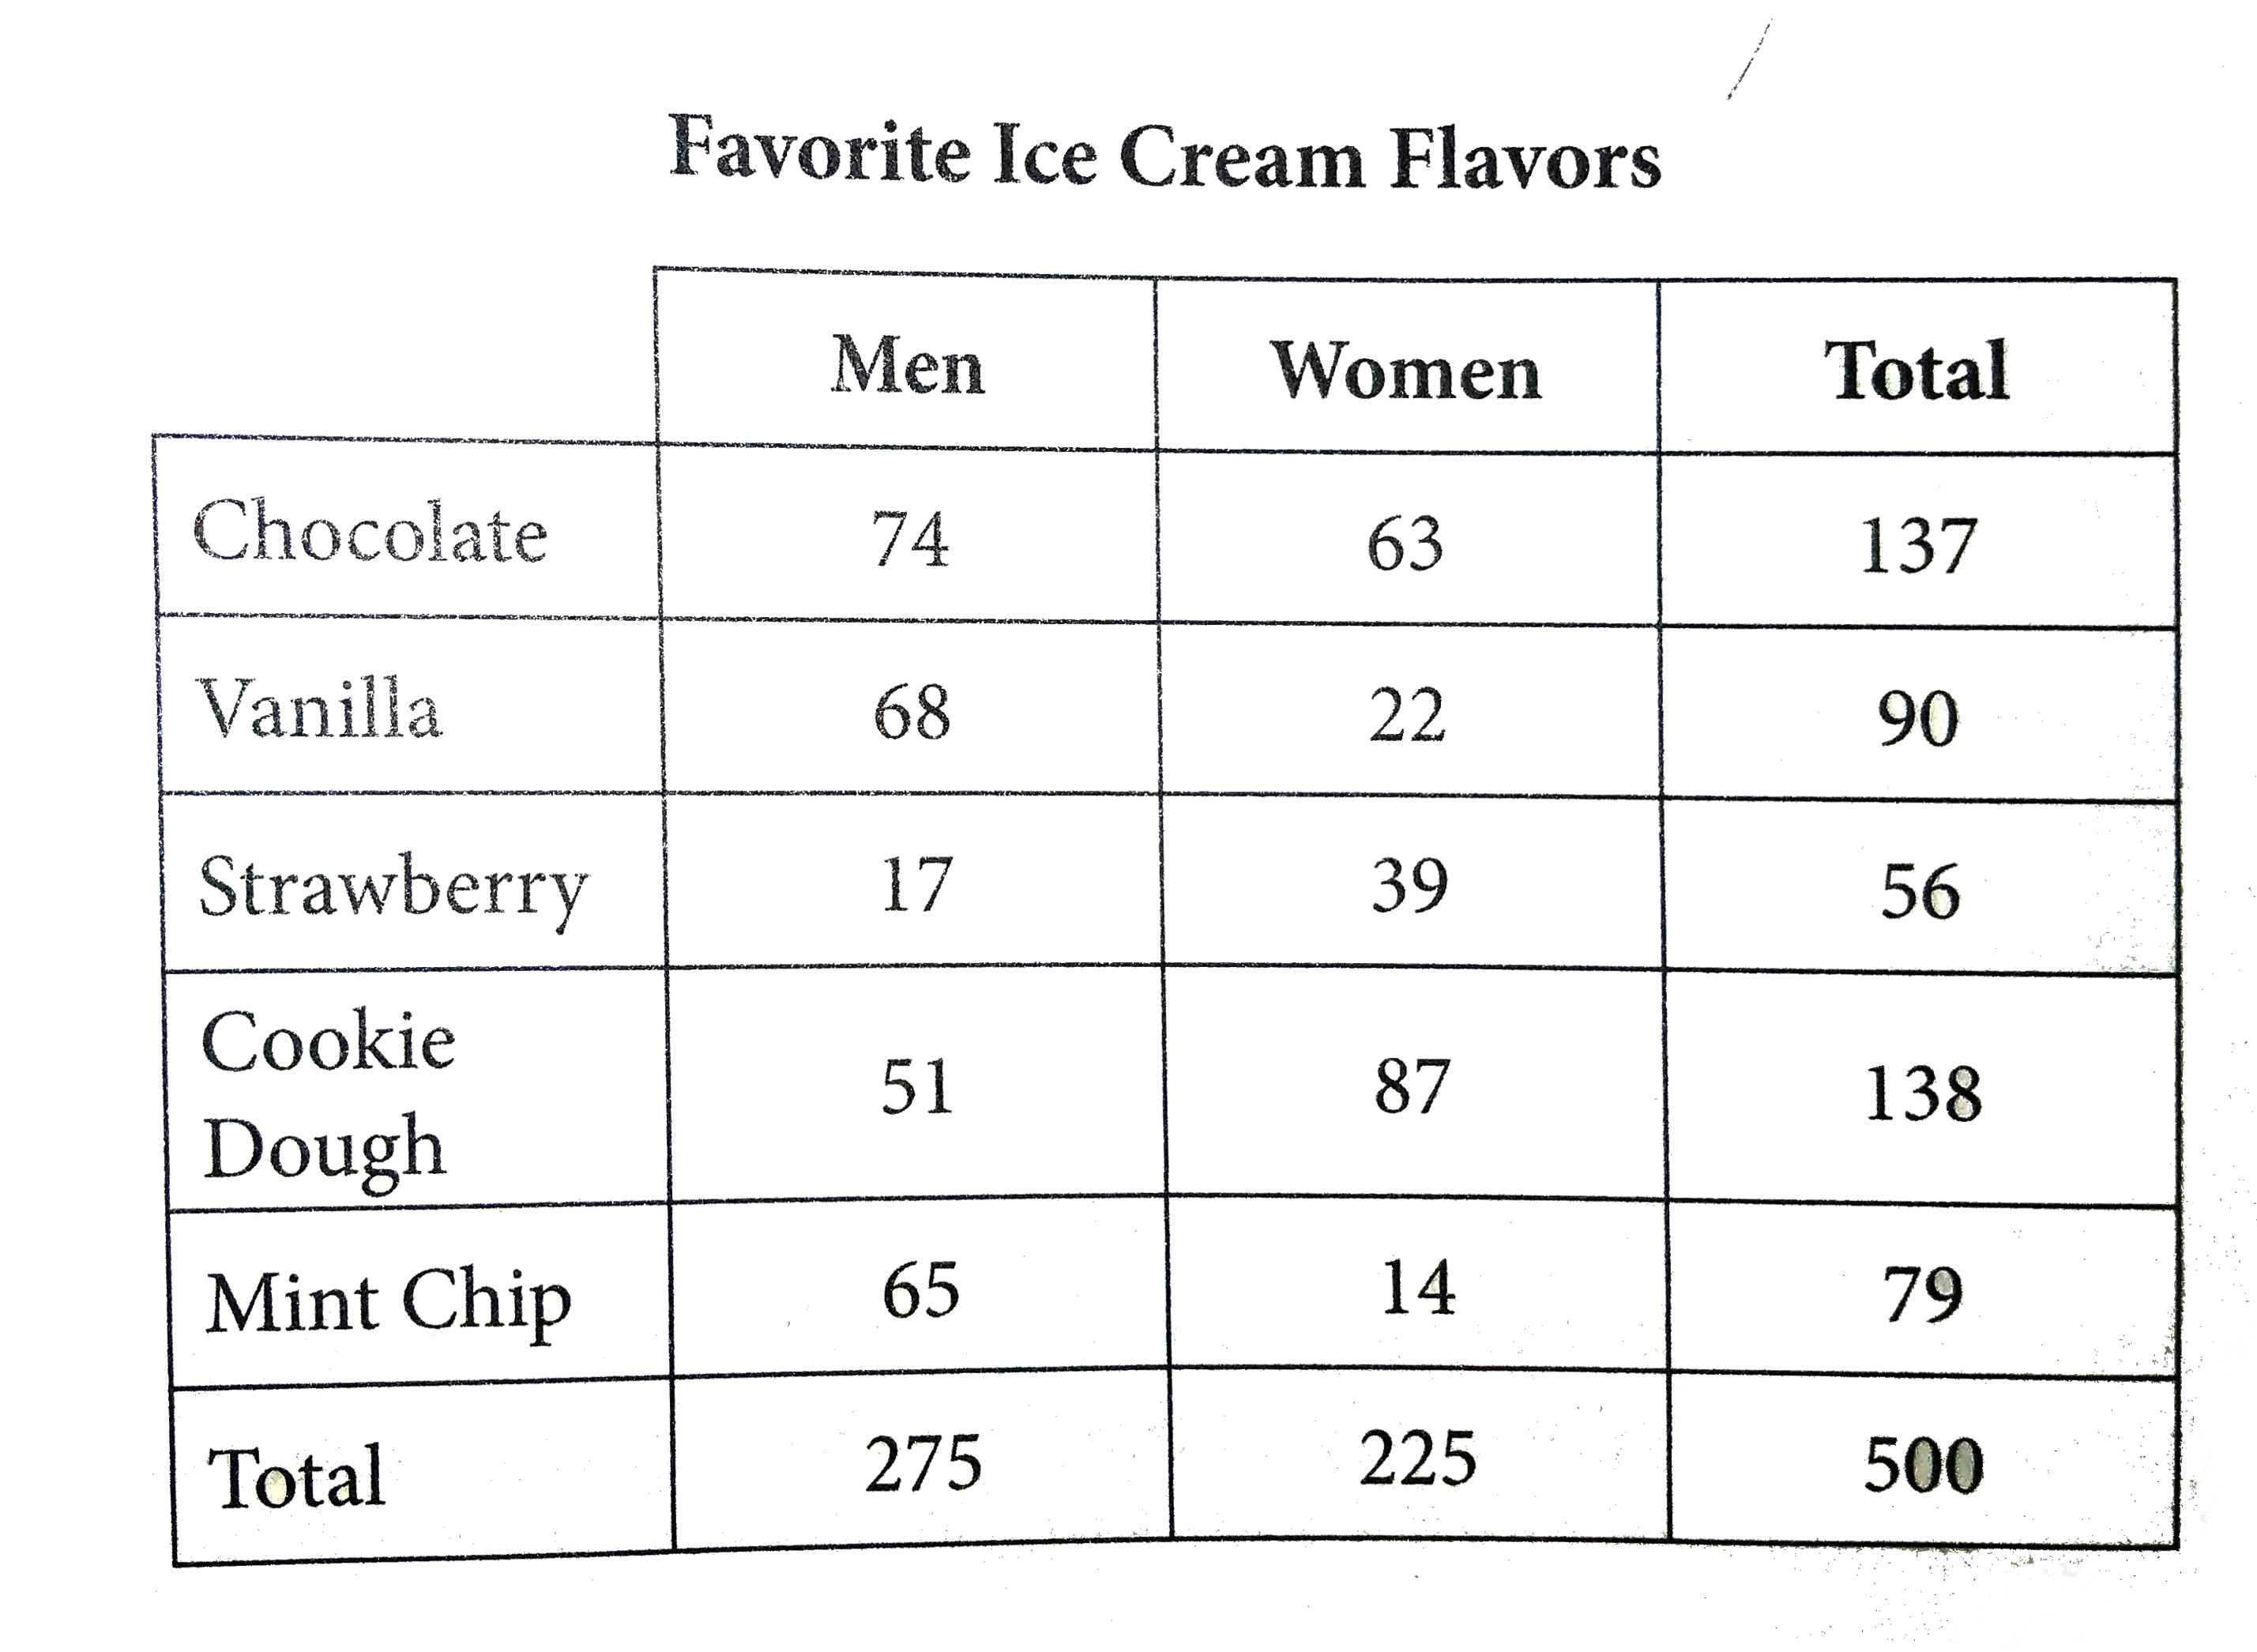
The table above shows the result of a random survey of 500 men and women. Each individual chose a flavor of ice cream that was his or her favorite.
Q. If a woman is chosen at random, what is the probability that her favorite ice cream flavor is strawberry?
0.06
0.09
0.11
0.17
The correct Answer is:D
Step by step video, text & image solution for The table above shows the result of a random survey of 500 men and women. Each individual chose a flavor of ice cream that was his or her favorite. Q. If a woman is chosen at random, what is the probability that her favorite ice cream flavor is strawberry? by Maths experts to help you in doubts & scoring excellent marks in Class 12 exams.
Topper's Solved these Questions
- BOOK - PRINCETONCHAPTER - PROBLEM SETSEXERCISE - PROBLEM SET 9: EXPONENTS, ROOTS, AND EQUATIONS11videos
PROBLEM SETS
- BOOK - PRINCETONCHAPTER - PROBLEM SETSEXERCISE - PROBLEM SET 10: LINES, ANGLES, AND COORDINATES11videos
PROBLEM SETS
- BOOK - PRINCETONCHAPTER - PROBLEM SETSEXERCISE - PROBLEM SET 7: AVERAGES, RATIOS, PROPORTIONS, AND PROBABILITIES11videos
PROBLEM SETS
- BOOK - PRINCETONCHAPTER - PRACTICE TEST 4EXERCISE - Math Test-Calculator38videos
PRACTICE TEST 4
- BOOK - PRINCETONCHAPTER - SAT MATH: THE BIG PICTUREEXERCISE - Example4videos
SAT MATH: THE BIG PICTURE
Similar Questions
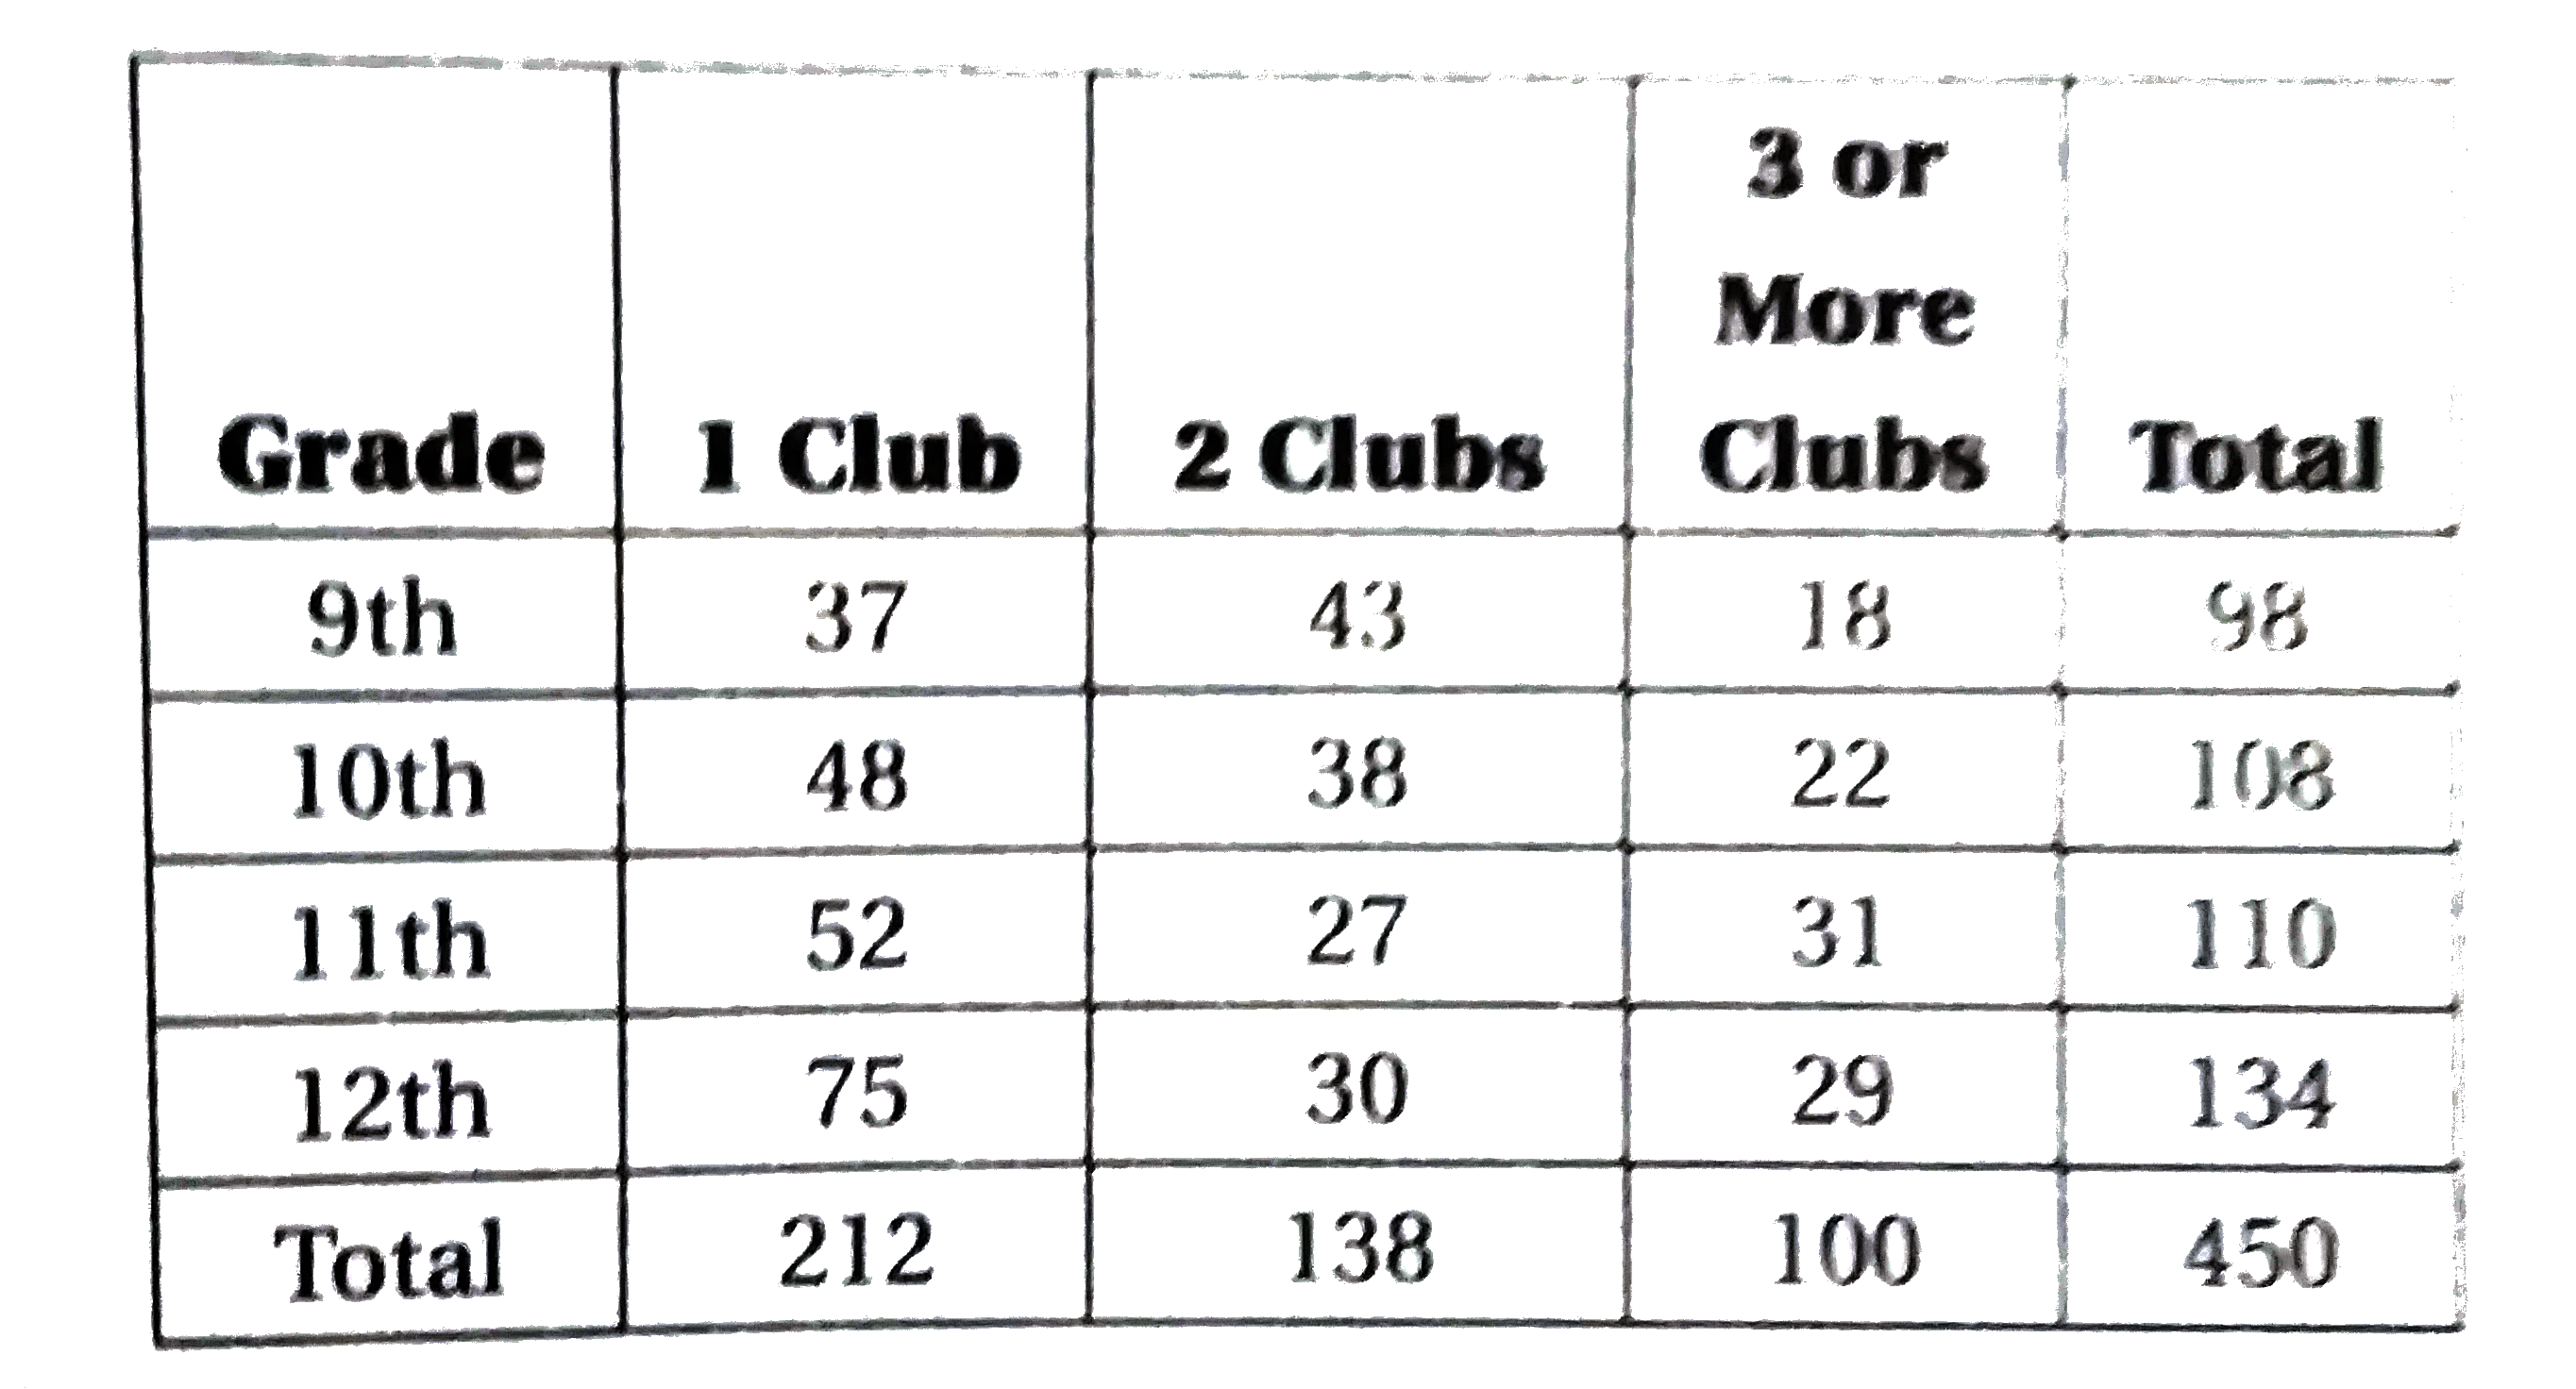
Question 4-6 refer to the above table, which summarizes the result of a survey of the student body of a high school about club membership in which each student enrolled in the high school enumerated the clubs in which they were members.
Q. If a students is selected at random, what is the probability that the student does not belong to 3 or more clubs?View Solution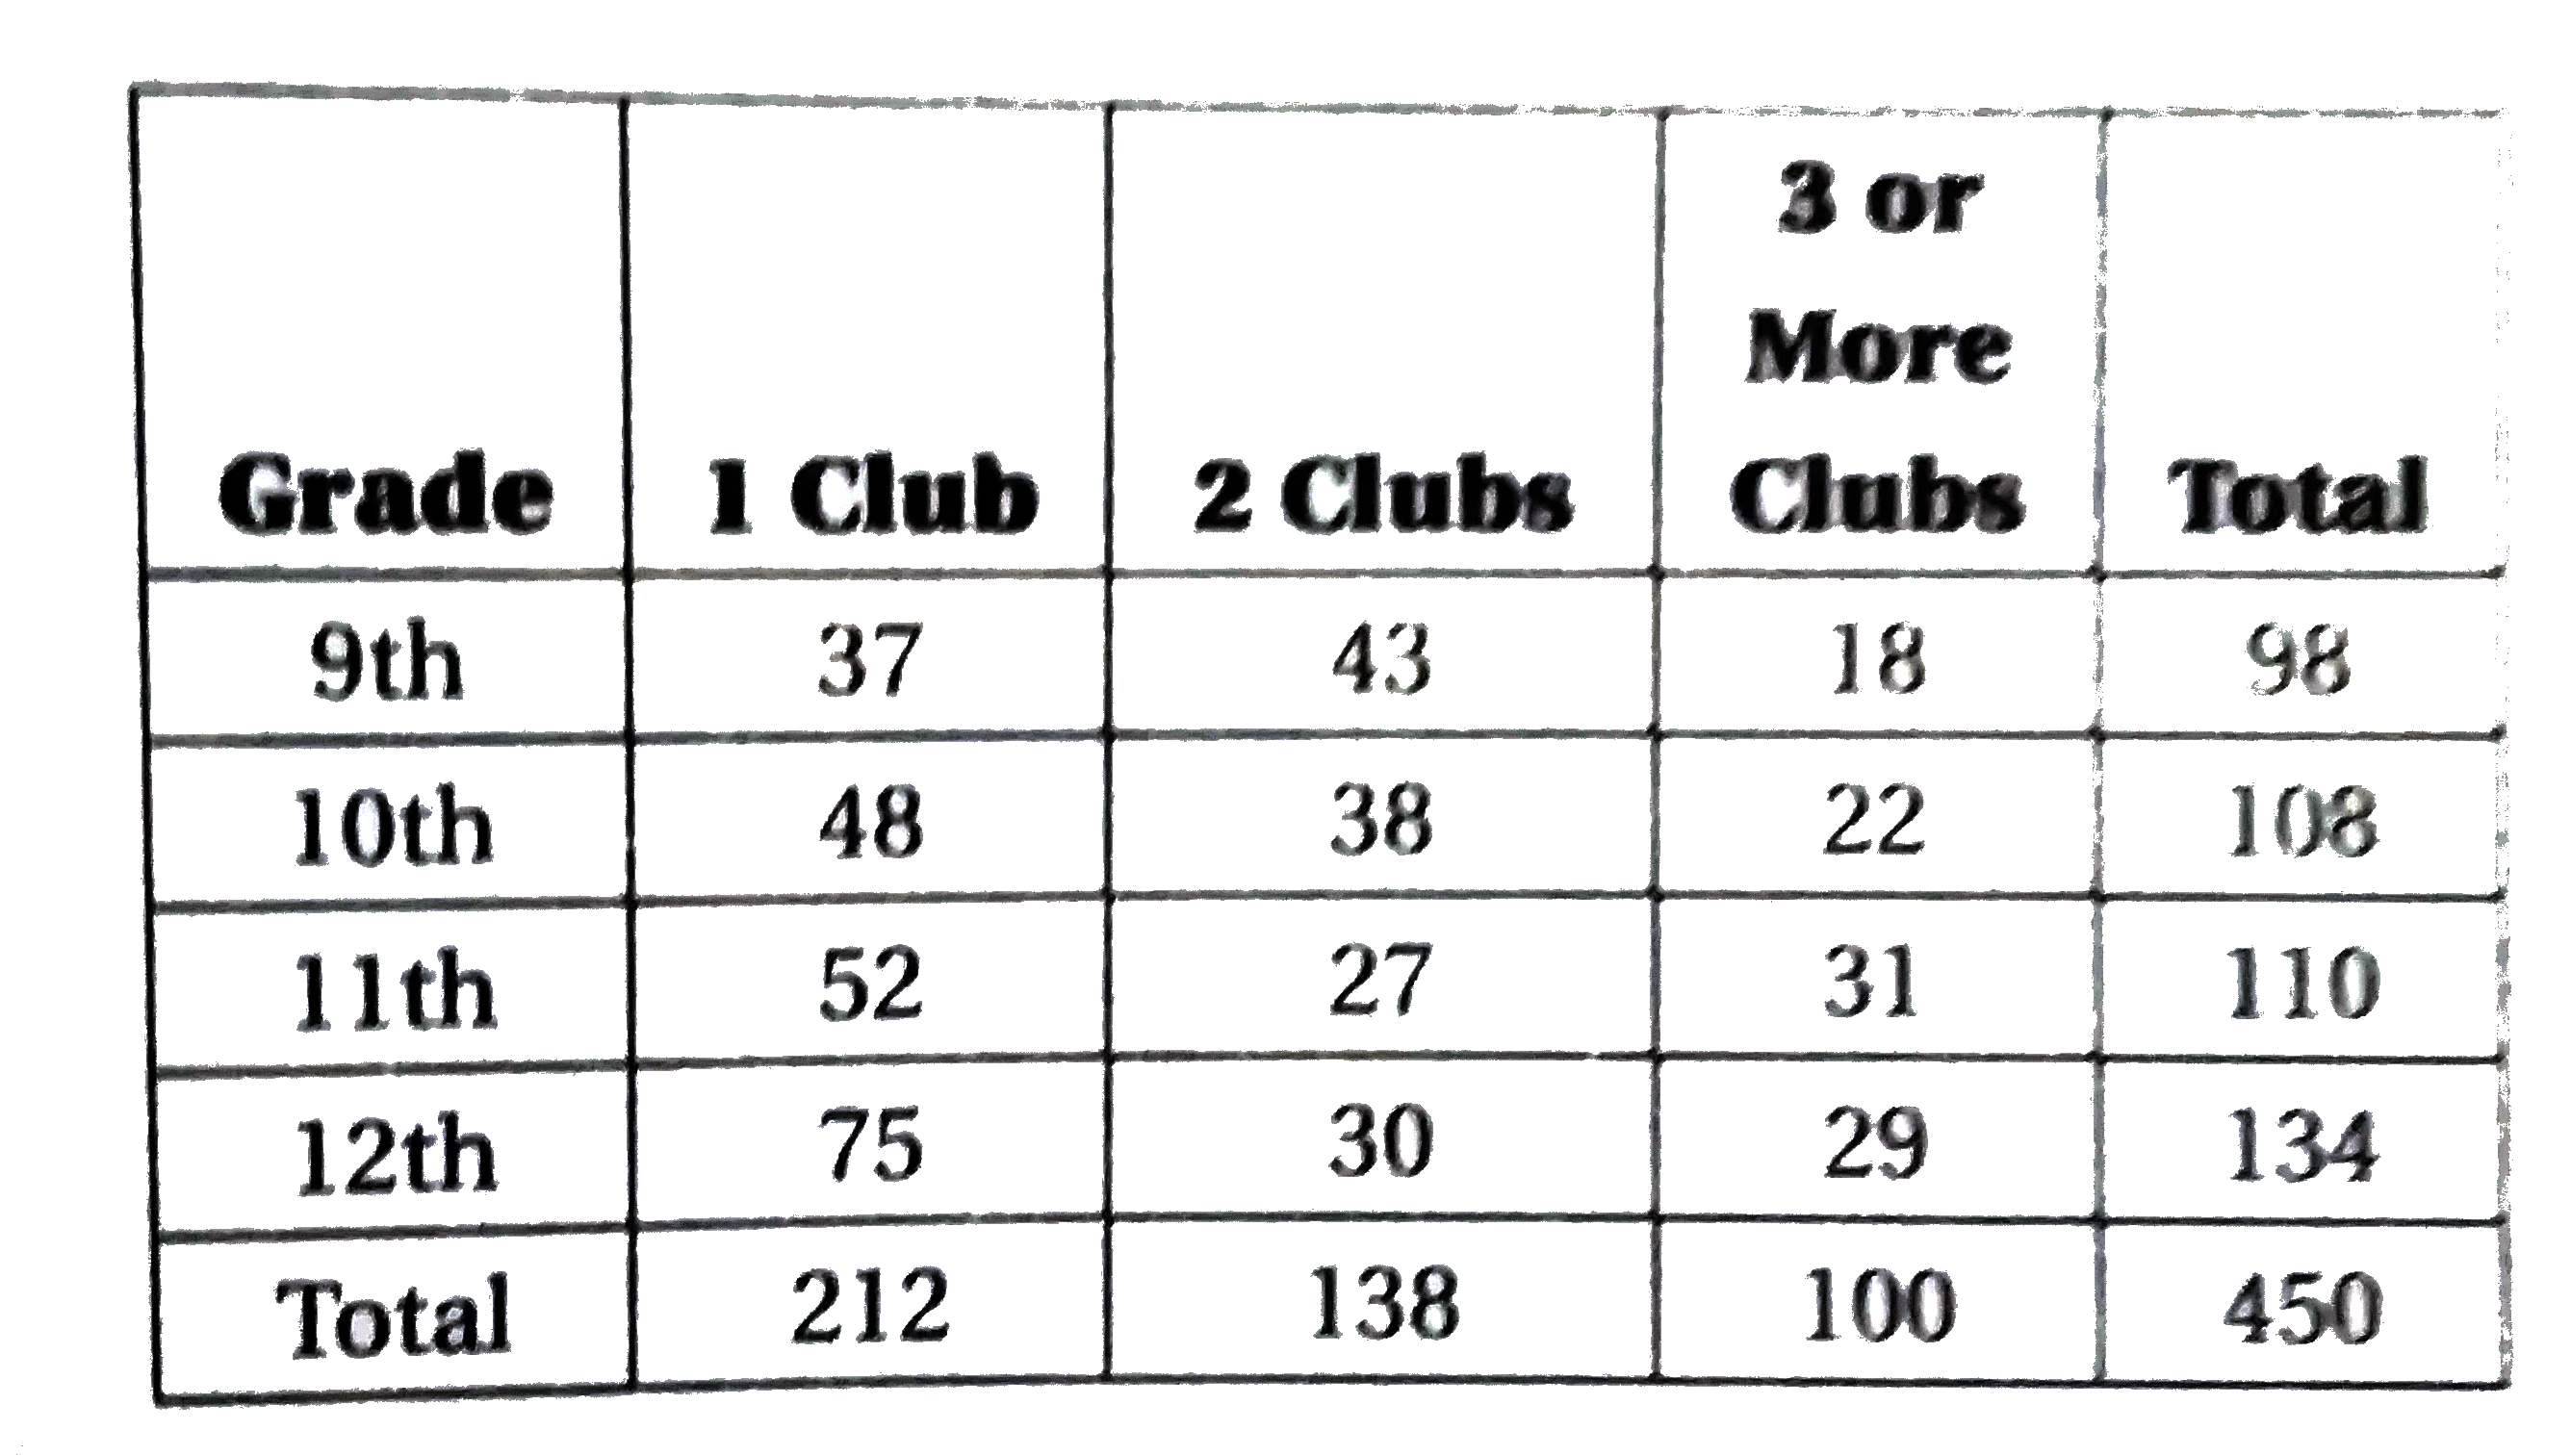
Question 4-6 refer to the above table, which summarizes the result of a survey of the student body of a high school about club membership in which each student enrolled in the high school enumerated the clubs in which they were members.
Q. If a student is selected at random, what is the probability that the student is either a 9th grade student or belongs to 3 or more clubs?View Solution
Knowledge Check
- Question 1 - Select One

The table above shows the result of a random survey of 500 men and women. Each individual chose a flavor of ice cream that was his or her favorite.
Q. Approximately what percent of the men chose mint chip as their favorite ice cream flavor?A0.25B0.5C0.65D0.8 - Question 2 - Select One
Results on the Bar Exam of Law School Graduates
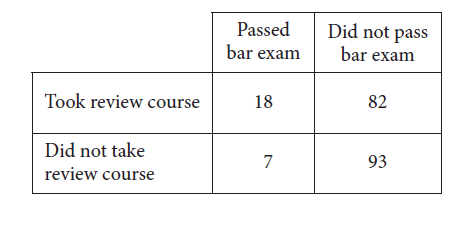
The table above summarizes the results of 200 law school graduates who took the bar exam. If one of the surveyed graduates who passed the bar exam is chosen at random for an interview, what is the probability that the person chosen did not–––– take the review course?A1825B725C25200D7200 - Question 3 - Select One
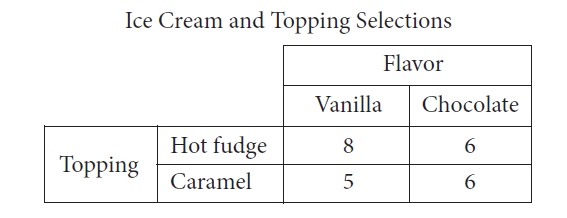
The table above shows the flavors of ice cream and the toppings chosen by the people at a party. Each person chose one flavor of ice cream and one topping. Of the people who chose vanilla ice cream, what fraction chose hot fudge as a topping?A825B513C1325D813
Each month. The Bureau of Labor Statistics conducts a survey called the Current Population Survey (CPS) to measure unemployement in the United States. Across the country, about 60,000 households are included in the survey sample. These households are grouped by geographic region. A summery of the January 2014 survey results for make responds in one geographica region is shown in the table below.

Q. If one unemployed man from this sample is chosen at random for a follow-up survey, what is the probability that he will be between the ages of 45 to 54?View Solution
The table above shows the result of a survey of adults over 18. Each person had to pick one of 3 choices : looking forward to a televised game, looking forward to the commercials , or not planning to watch . Based on the table , if a woman was polled at random , what is the probability , as a percent , that she would respond that she was looking forward to the commercials ?View SolutionThe Harrisburg Recreation Center recently changed its hours to open 1 hour later and close 3 hours later than it had previously. Residents of Harrisburg age 16 or older were given a survey and 560 residents replied. The survey asked each resident his or her student status (high school, college, or nonstudent) and what he or she thought about the change in hour (approve, disapprove, or no opinion). The results are summarized in the table below.

Suppose a person will be chosen at random from these 560 residents. Which of the following values is closest to the probability that the person chosen will NOT be a high student and will NOT have replied with no opinion?View Solution

