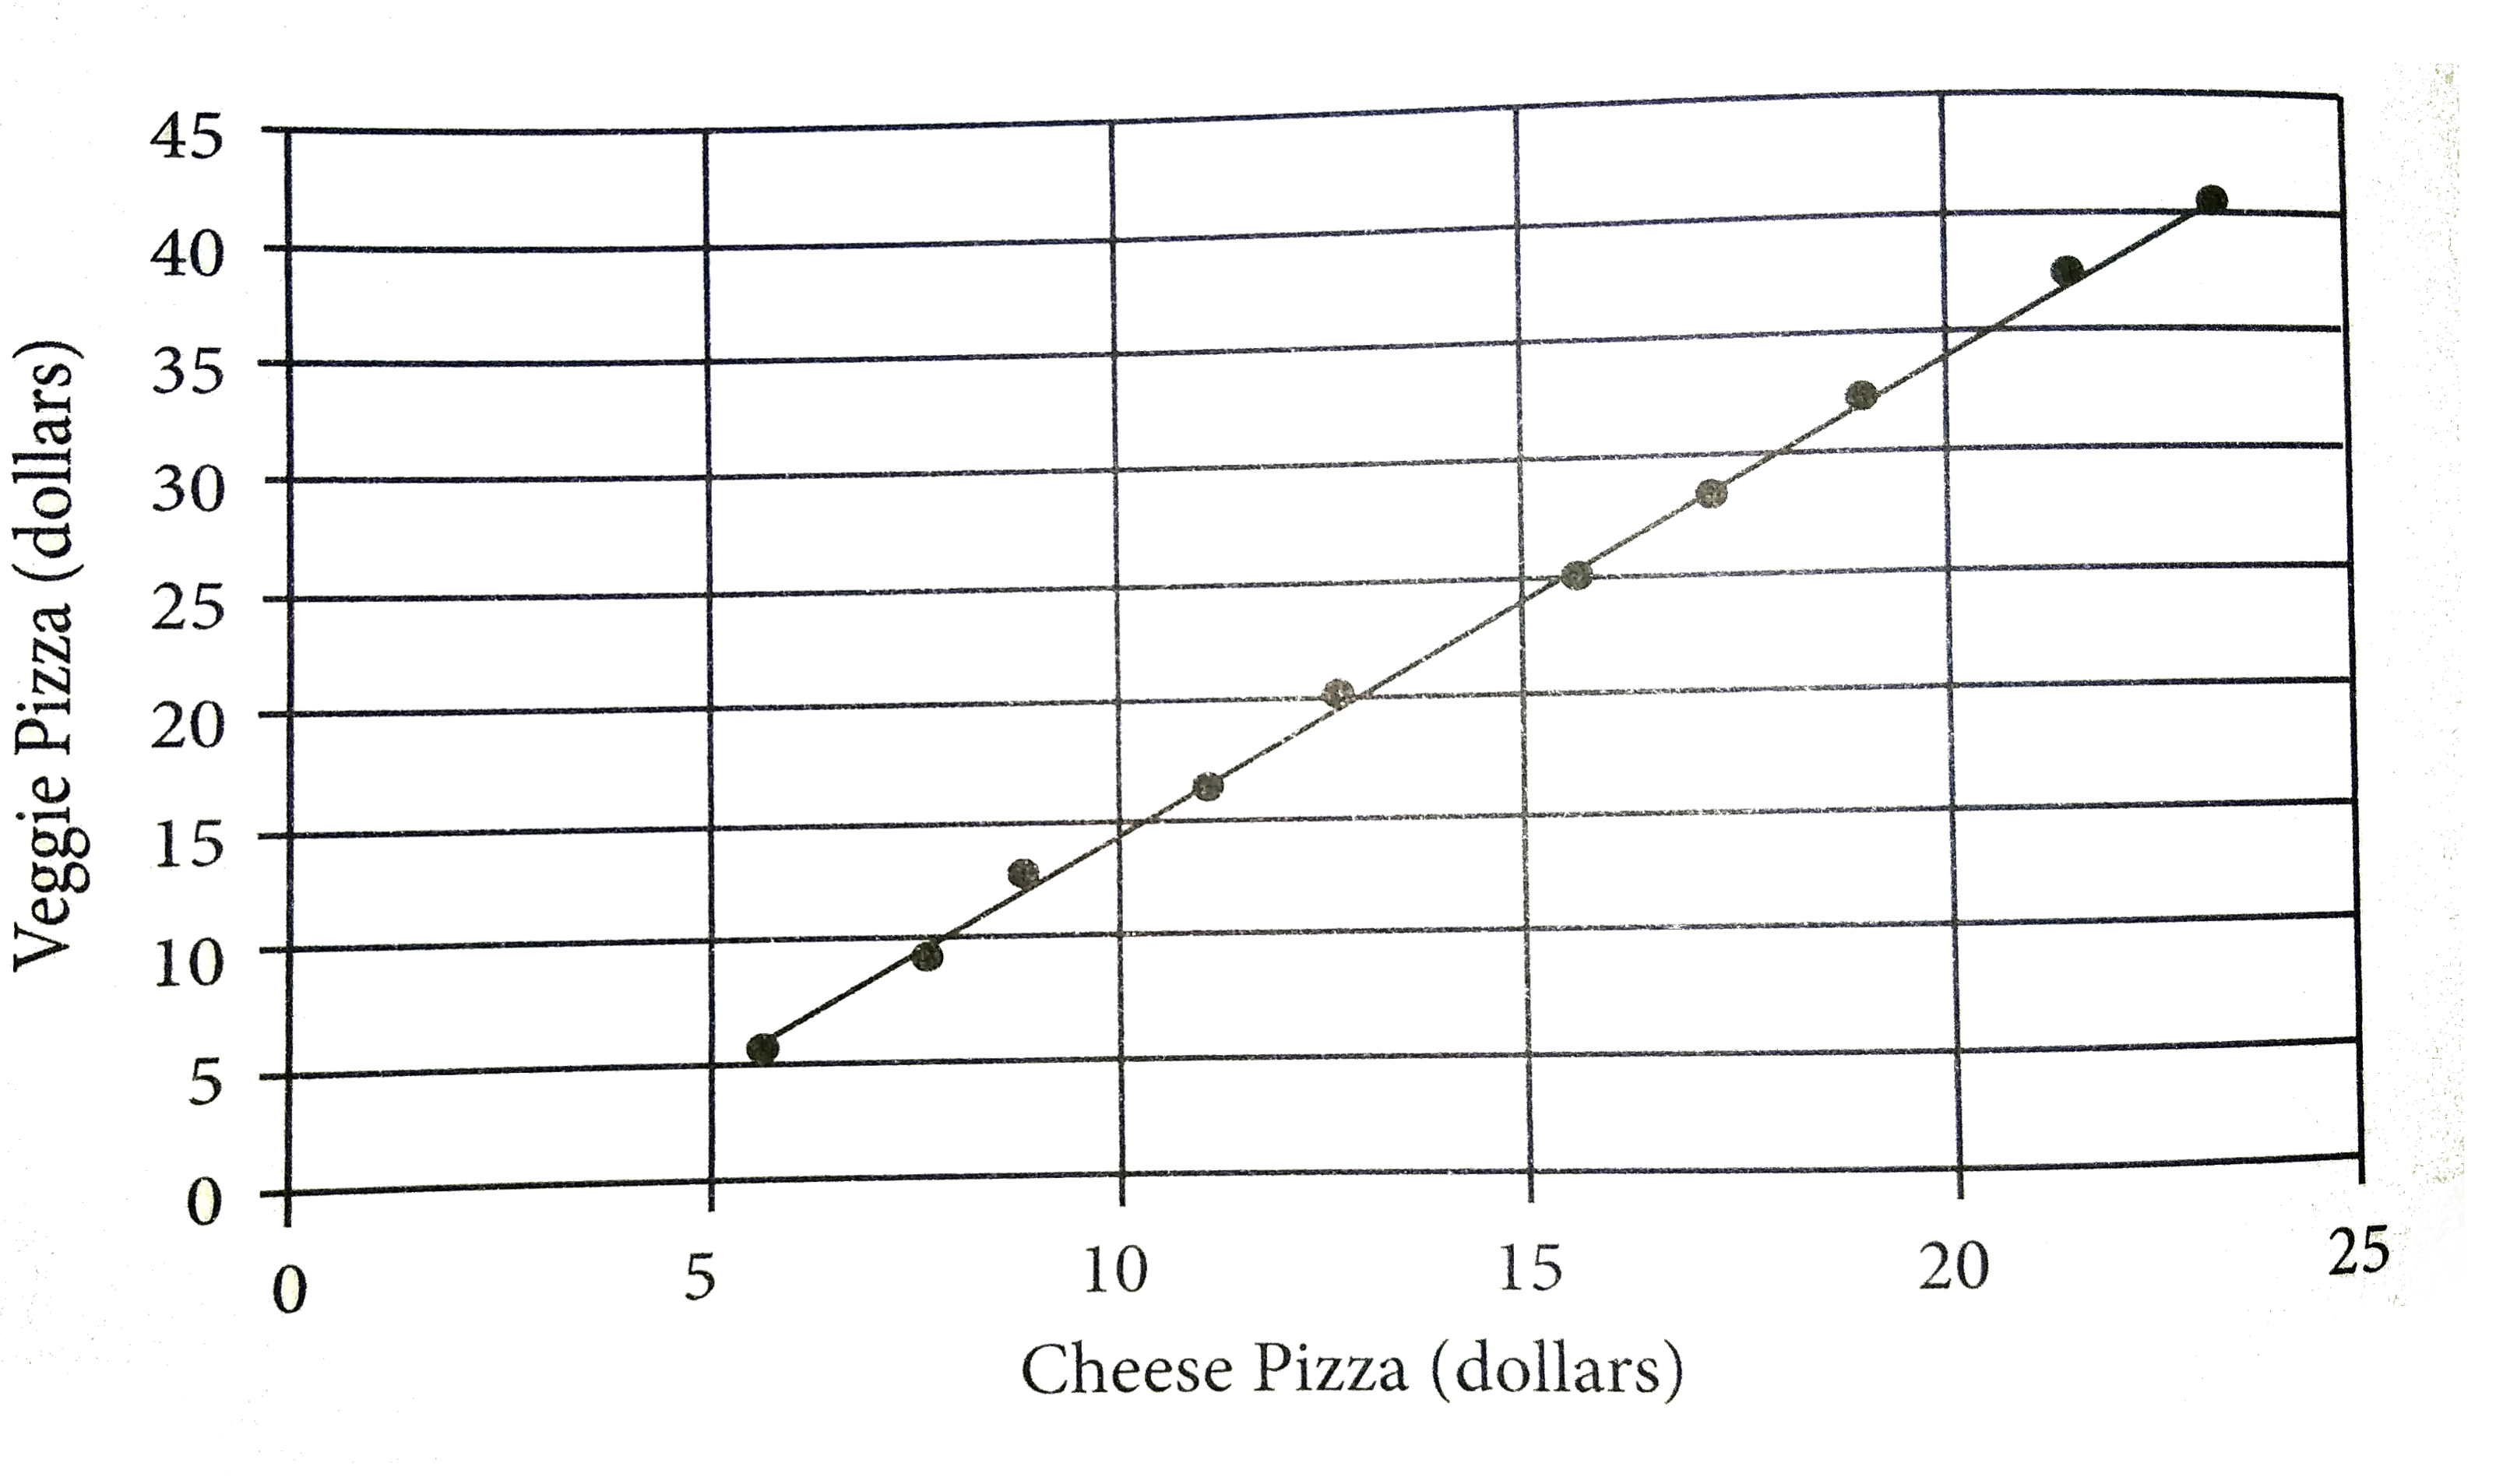
The scatterplot above shows the price, in dollars, for both cheese pizza and a veggie pizza for ten different pizzerias. The line of best fit is also shown. According to the line of best fit, which of the following is closer to the predicted increase in the price of a veggie pizza, in dollars, for every 1 dollar increase in the price of a cheese pizza?
The correct Answer is:B
Step by step video, text & image solution for The scatterplot above shows the price, in dollars, for both cheese pizza and a veggie pizza for ten different pizzerias. The line of best fit is also shown. According to the line of best fit, which of the following is closer to the predicted increase in the price of a veggie pizza, in dollars, for every 1 dollar increase in the price of a cheese pizza? by Maths experts to help you in doubts & scoring excellent marks in Class 12 exams.
Topper's Solved these Questions
- BOOK - PRINCETONCHAPTER - PROBLEM SETSEXERCISE - PROBLEM SET 9: EXPONENTS, ROOTS, AND EQUATIONS11videos
PROBLEM SETS
- BOOK - PRINCETONCHAPTER - PROBLEM SETSEXERCISE - PROBLEM SET 10: LINES, ANGLES, AND COORDINATES11videos
PROBLEM SETS
- BOOK - PRINCETONCHAPTER - PROBLEM SETSEXERCISE - PROBLEM SET 7: AVERAGES, RATIOS, PROPORTIONS, AND PROBABILITIES11videos
PROBLEM SETS
- BOOK - PRINCETONCHAPTER - PRACTICE TEST 4EXERCISE - Math Test-Calculator38videos
PRACTICE TEST 4
- BOOK - PRINCETONCHAPTER - SAT MATH: THE BIG PICTUREEXERCISE - Example4videos
SAT MATH: THE BIG PICTURE
Similar Questions
If t3=−8, what is the value of t2?
01:37View Solution
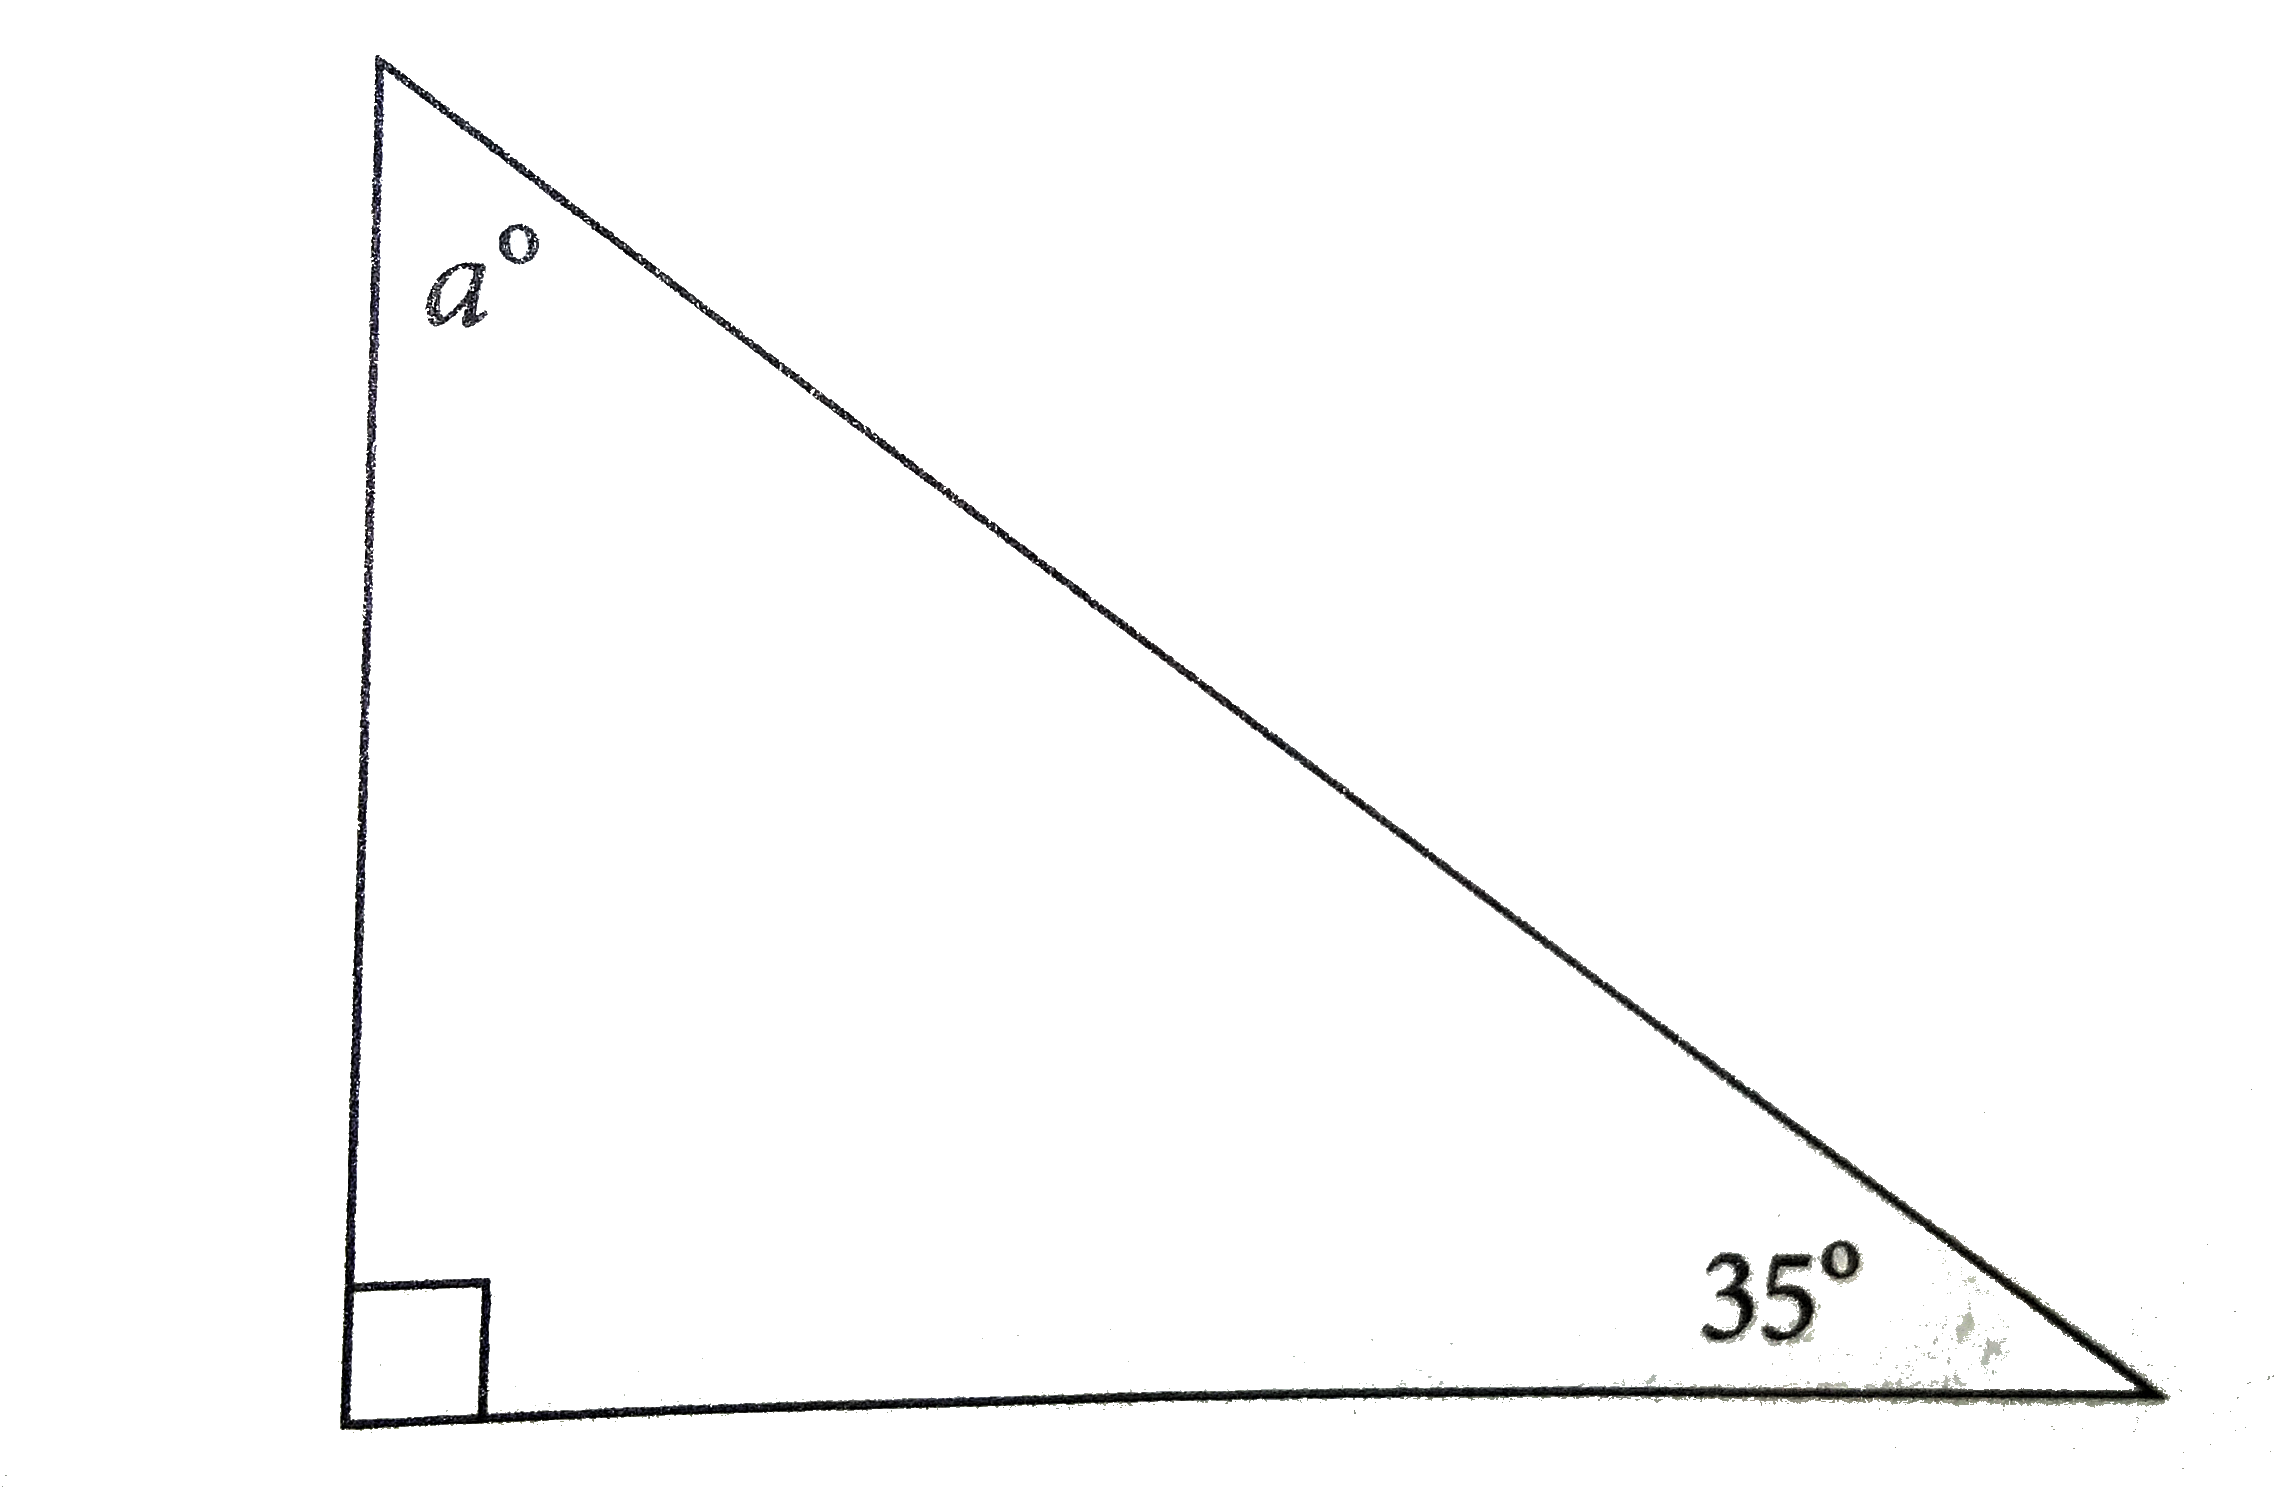
In the figure, what is the value of 2a?02:11View SolutionThree consecutive integers odd up to 258. What is the smallest integer?
01:31View SolutionIF 3y=y+2, what is the value of 2y?
02:45View SolutionJoy plants three rows of corn in her garden. The row on the south edge of the garden receives more sunlight than the row on north edge of the garden. Therefore, the corn on the north edge the south edge of the garden is 30% shorter than that on the south. If the corn on the south edge of the garden is 50 inches tall, how tall is the corn on the north edge of the garden , in inches?
02:17View SolutionHow many lines of symmetry does the above figure have ?
05:41View SolutionDetermine the point of symmetry of a regular hexagon.
02:10View SolutionDtermine the images of the following figure about the given line :
02:17View SolutionMatch the following Column A to Column B
 02:10View Solution
Match the following Column A to Column B
 02:13View Solution
Match the following Column A to Column B
 01:59View Solution
The inequation represented by the graph given below is :
View SolutionThe inequation that best describes the graph given below is _________
01:40View SolutionThe inequation that best describes the following graph is _________
04:28View SolutionWhich of the following equation is best representation of given graph's? ltimg src="https://d10lpgp6xz60nq.cloudfront.net/physics_images/ALN_PHY_R04_E01_008_Q01.png" width="80%"gt
View Solution

