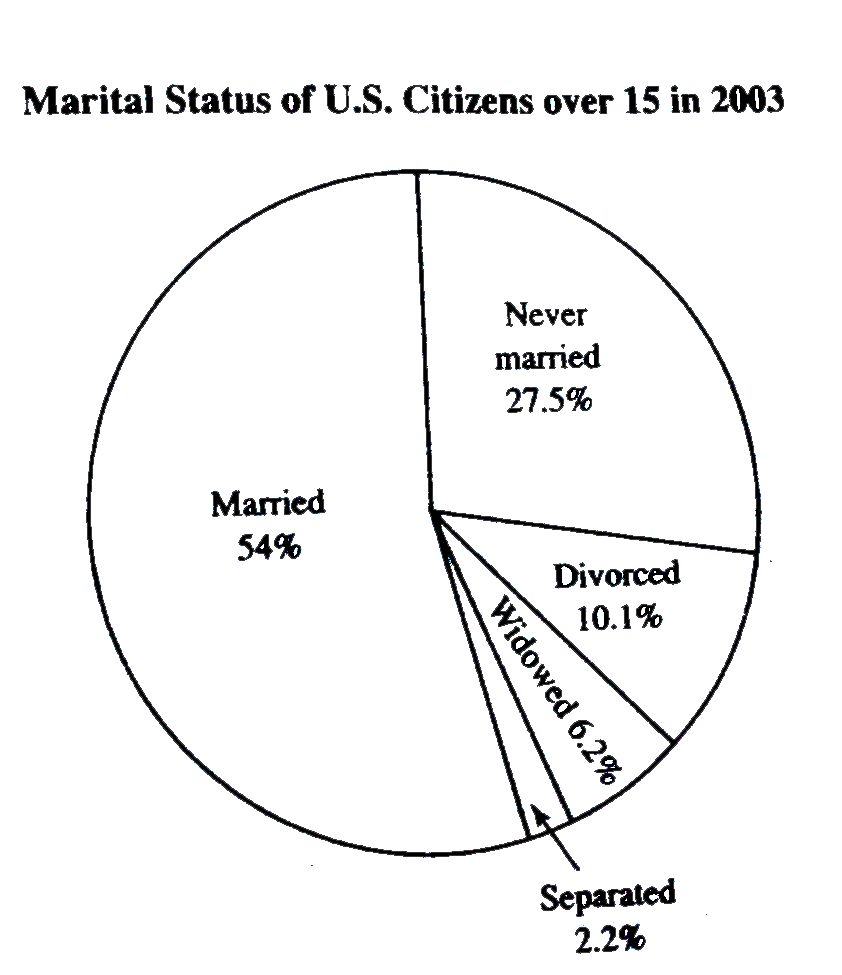
The graph shows the material statuses of U.S. citizens ages 15 and over in 2003. If the total number of U.S. citizens over 15 was approximately 222 million in 2003, how many, to the nearest million , were divorced or separated ?
3 million
10 million
22 million
27 million
The correct Answer is:D
Step by step video, text & image solution for The graph shows the material statuses of U.S. citizens ages 15 and over in 2003. If the total number of U.S. citizens over 15 was approximately 222 million in 2003, how many, to the nearest million , were divorced or separated ? by Maths experts to help you in doubts & scoring excellent marks in Class 12 exams.
Updated on:21/07/2023Similar Questions
743 children from the United States, aged 6 through 11, were tested to see if they were overweight . The data are shown in the table below.

In 2014 the total population of children between 6 and 11 years old, inclusive , in the United States was about 74.3 million. If the test results are used to estimate information about children across the country, which of the following is the best estimate of the total number of children between 9 and 11 years old in the United States who were overweight in 2014 ?
View SolutionStudy the bar graph representing the number of persons in various age groups in a town shown in Figure. Observe the bar graph and answer the following questions: What is the percentage of the youngest age-group persons over those in the oldest age group? What is the total population of the town? What is the number of persons in the age-group 60-65? How many persons are more in the age-group 10-15 then in the age group 30-35? What is the age-group of exactly 1200 persons living in the town? What is the total number of persons living in the town in the age-group 50-55? What is the total number of persons living in the town in the age-groups 10-15 and 60-65? Whether the population in general increases, decreases or remains constant with the increase in the age-group.
View Solution
Knowledge Check
The table below shows the percents of U.S. citizens who had ever consumed Bob's soda , out of all soda consumers , for each year form 1986 through 2006.
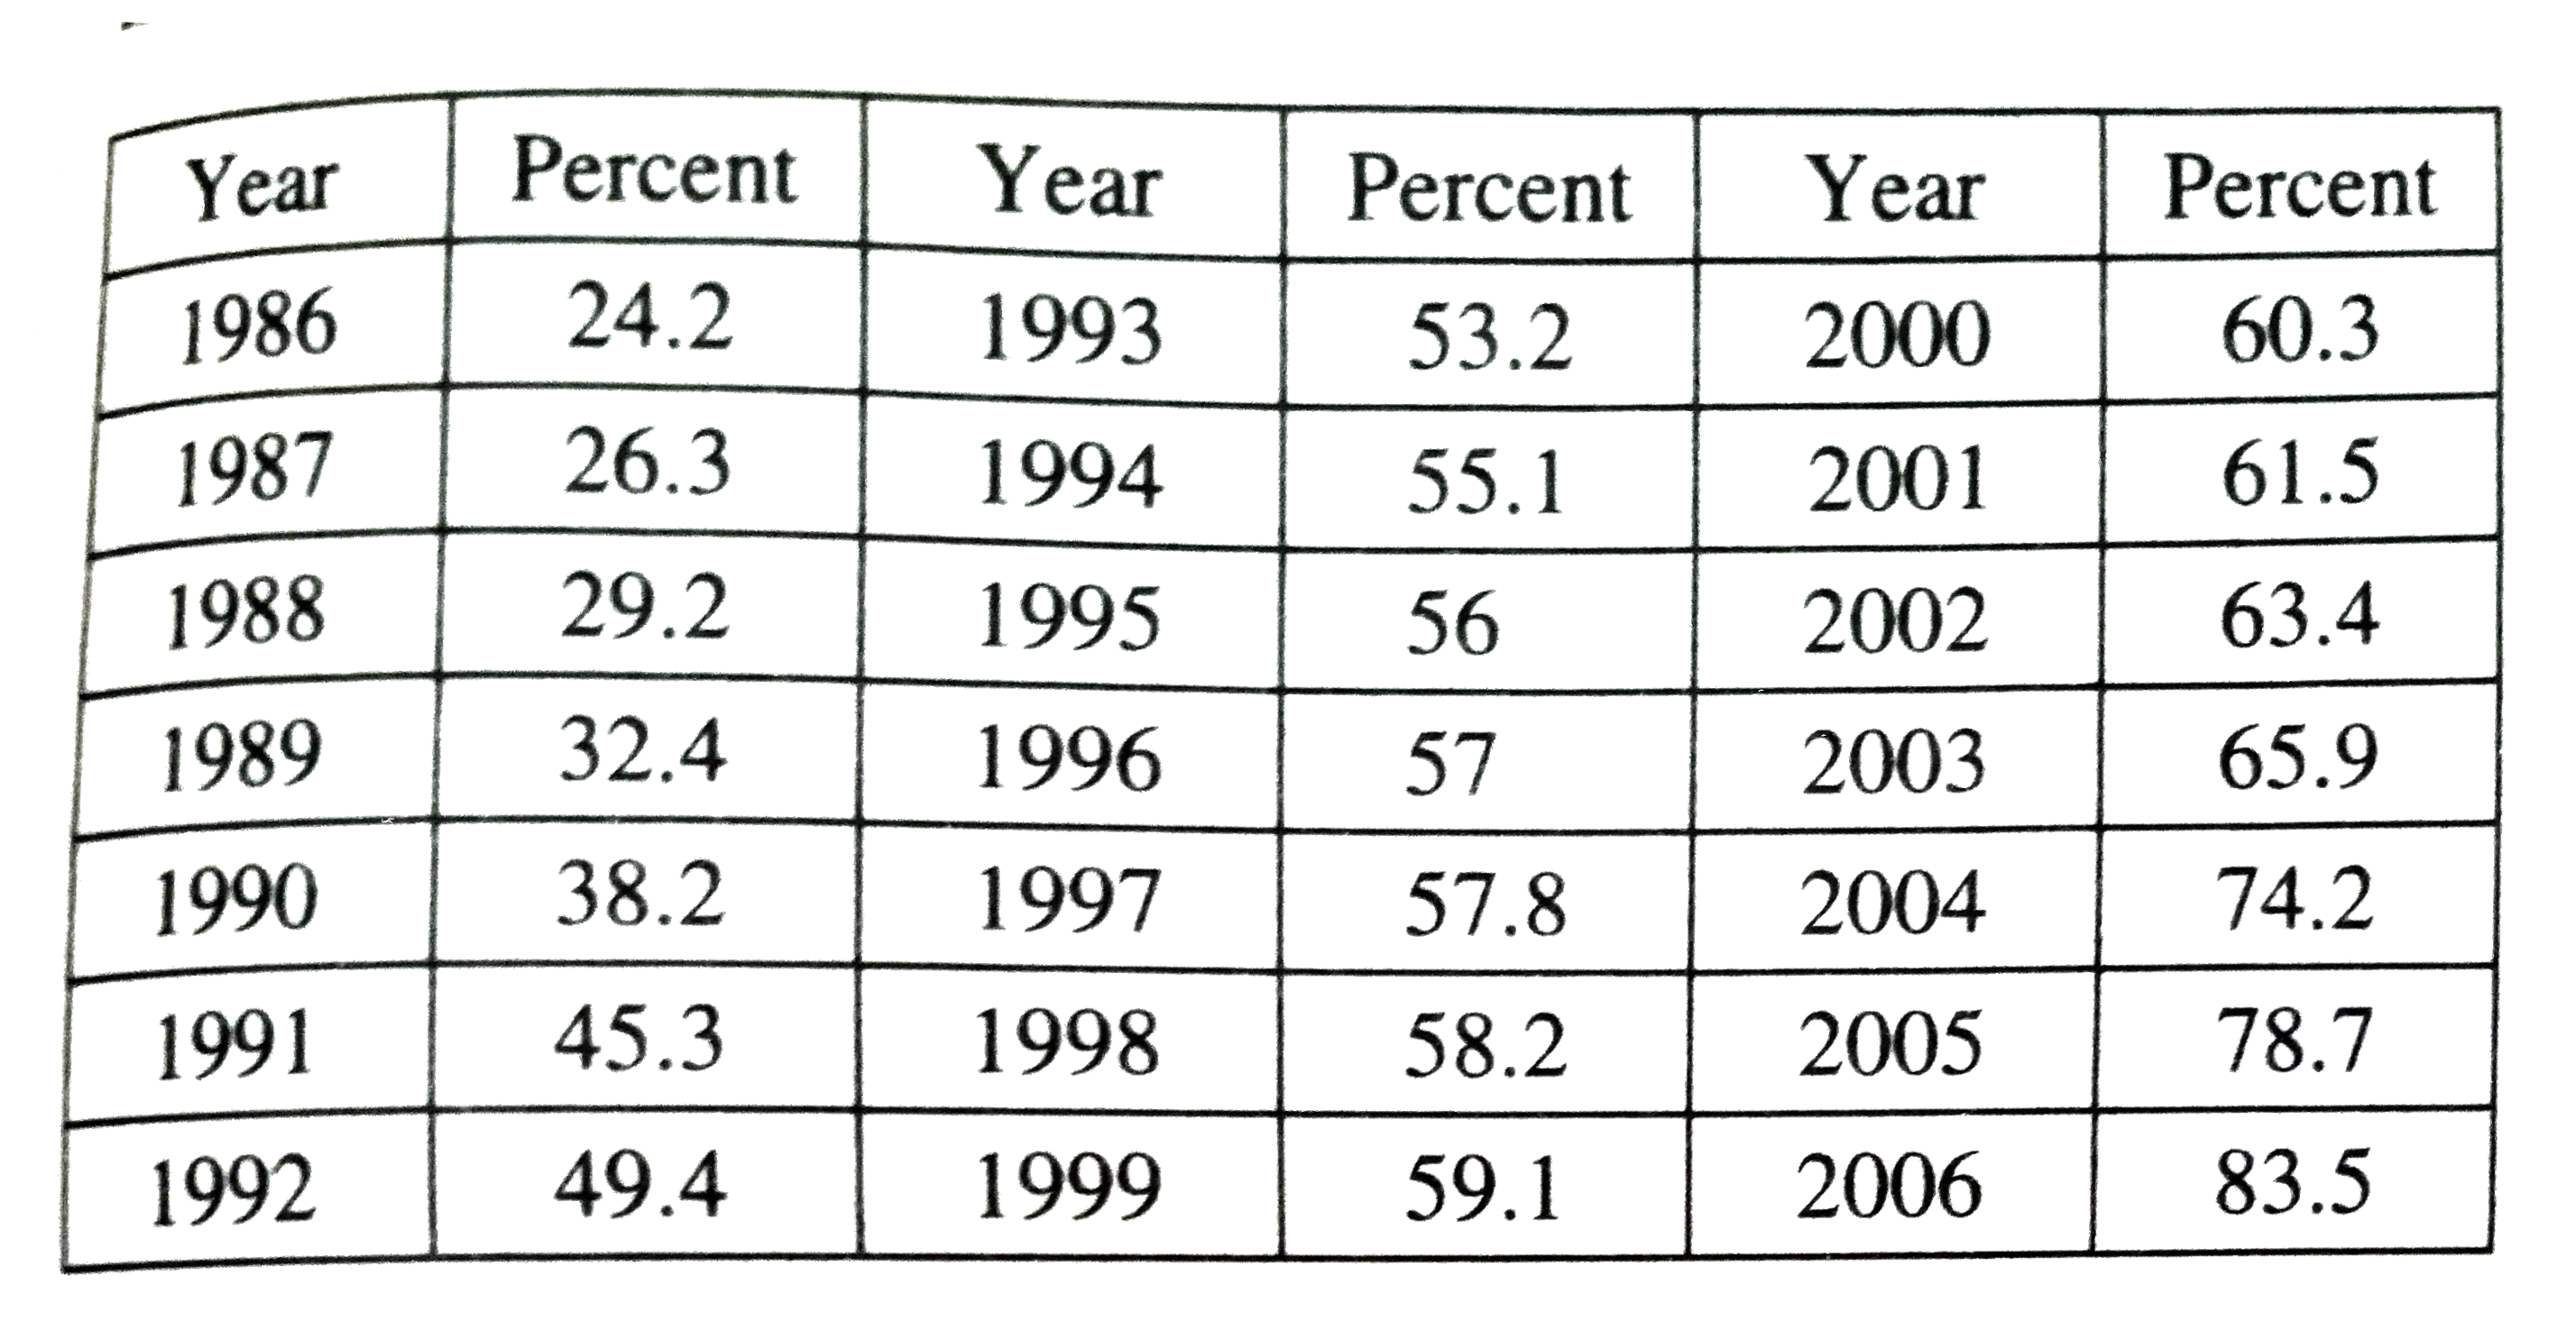
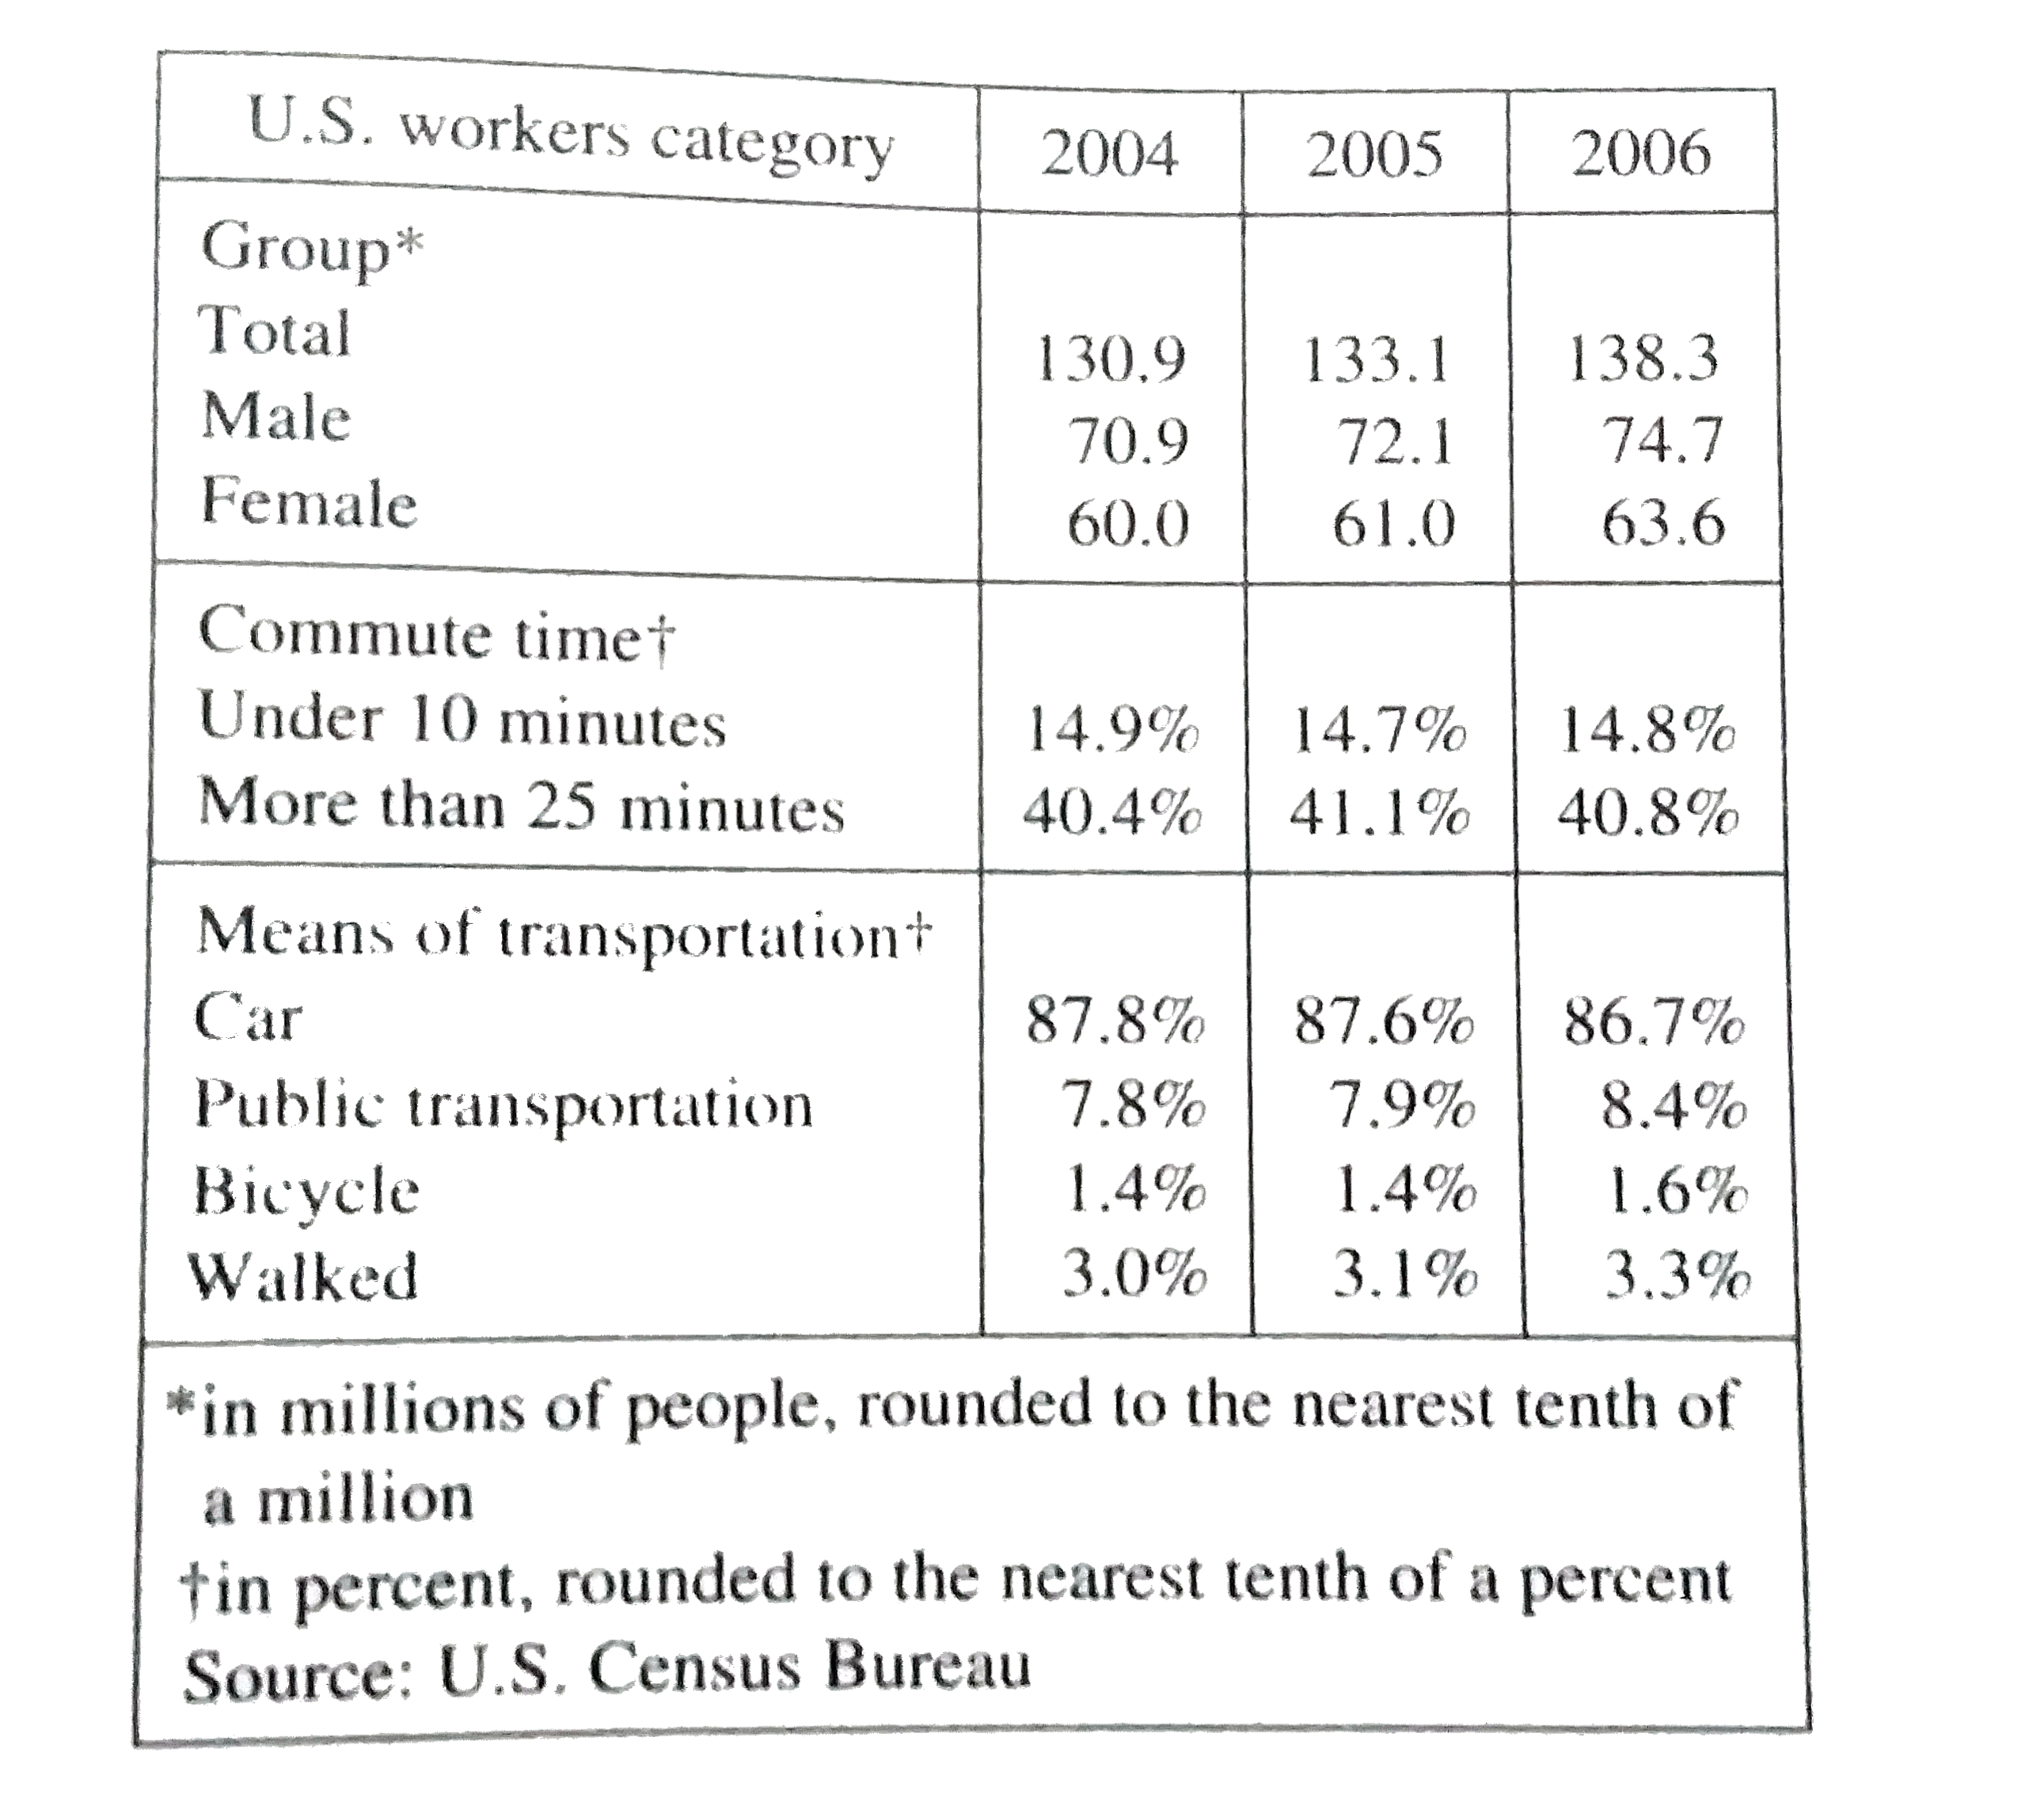
By 2002 there were 74,672,120 U.S. citizens who had consumed Bob's soda. According to this information , approximately how many people were soda consumers , of Bob's soda or other sodas, in 2002 ?A4700000000B150000000C119000000D47000000The table below details a recent census report about the commuting habits of U.S . Workers age 16 or over for the years 2004 , 2005 , and 2006.
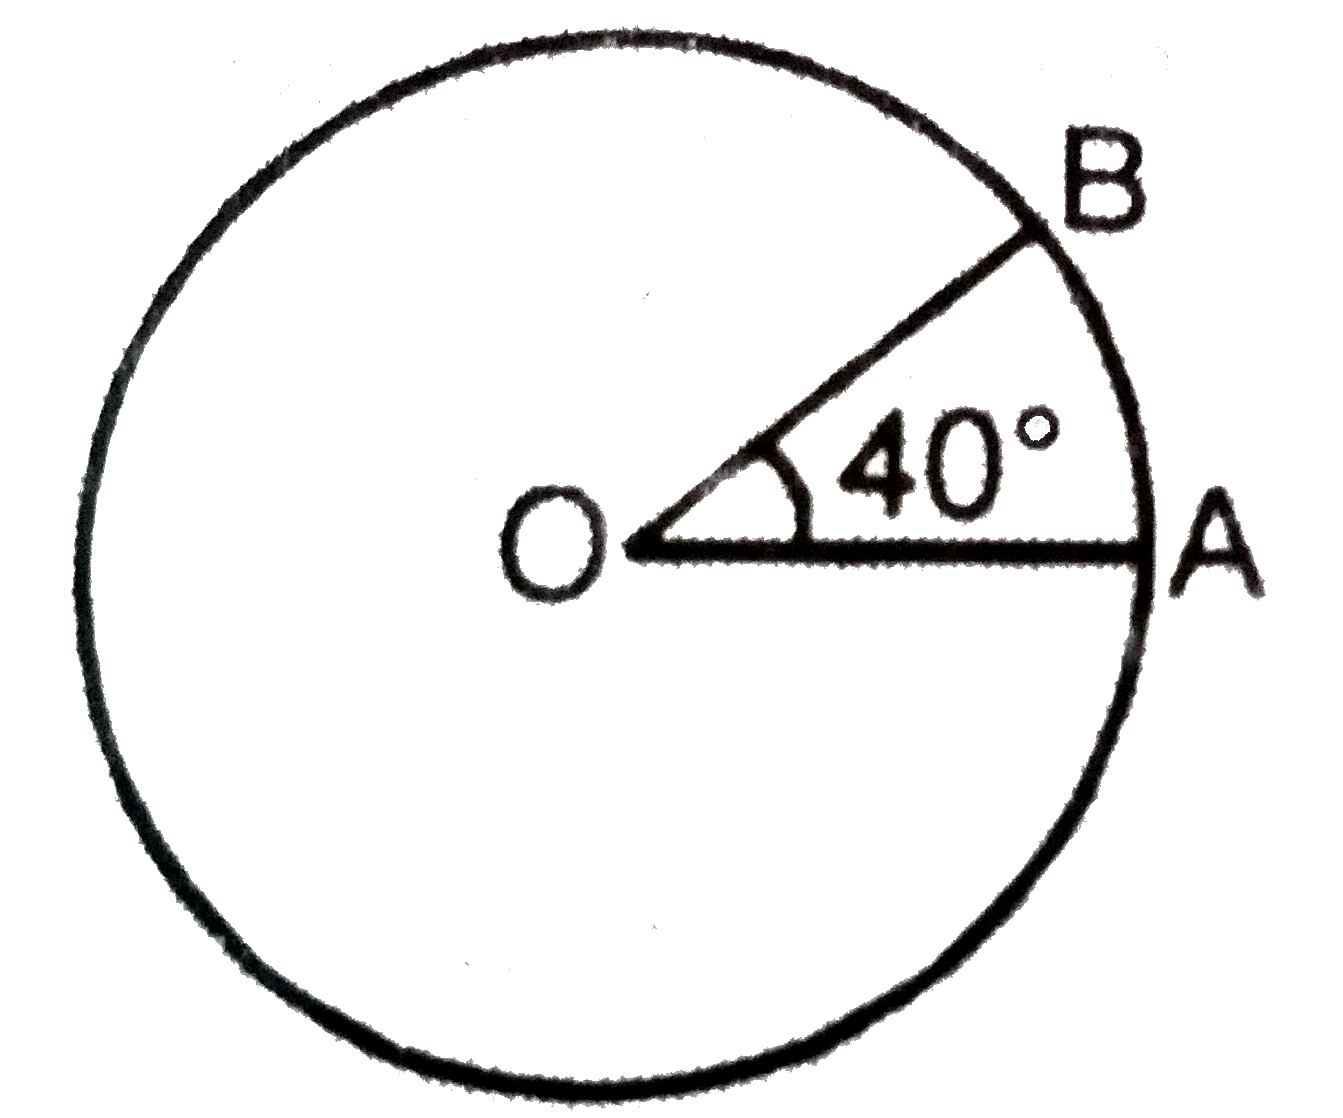
The circle graph (pie chart ) below represents the 2006 means of transportation for U.S . workers age 16 or over for the four transportation types listed . To the nearest degree , What is the measure of the central angle for the " Public " sector ?
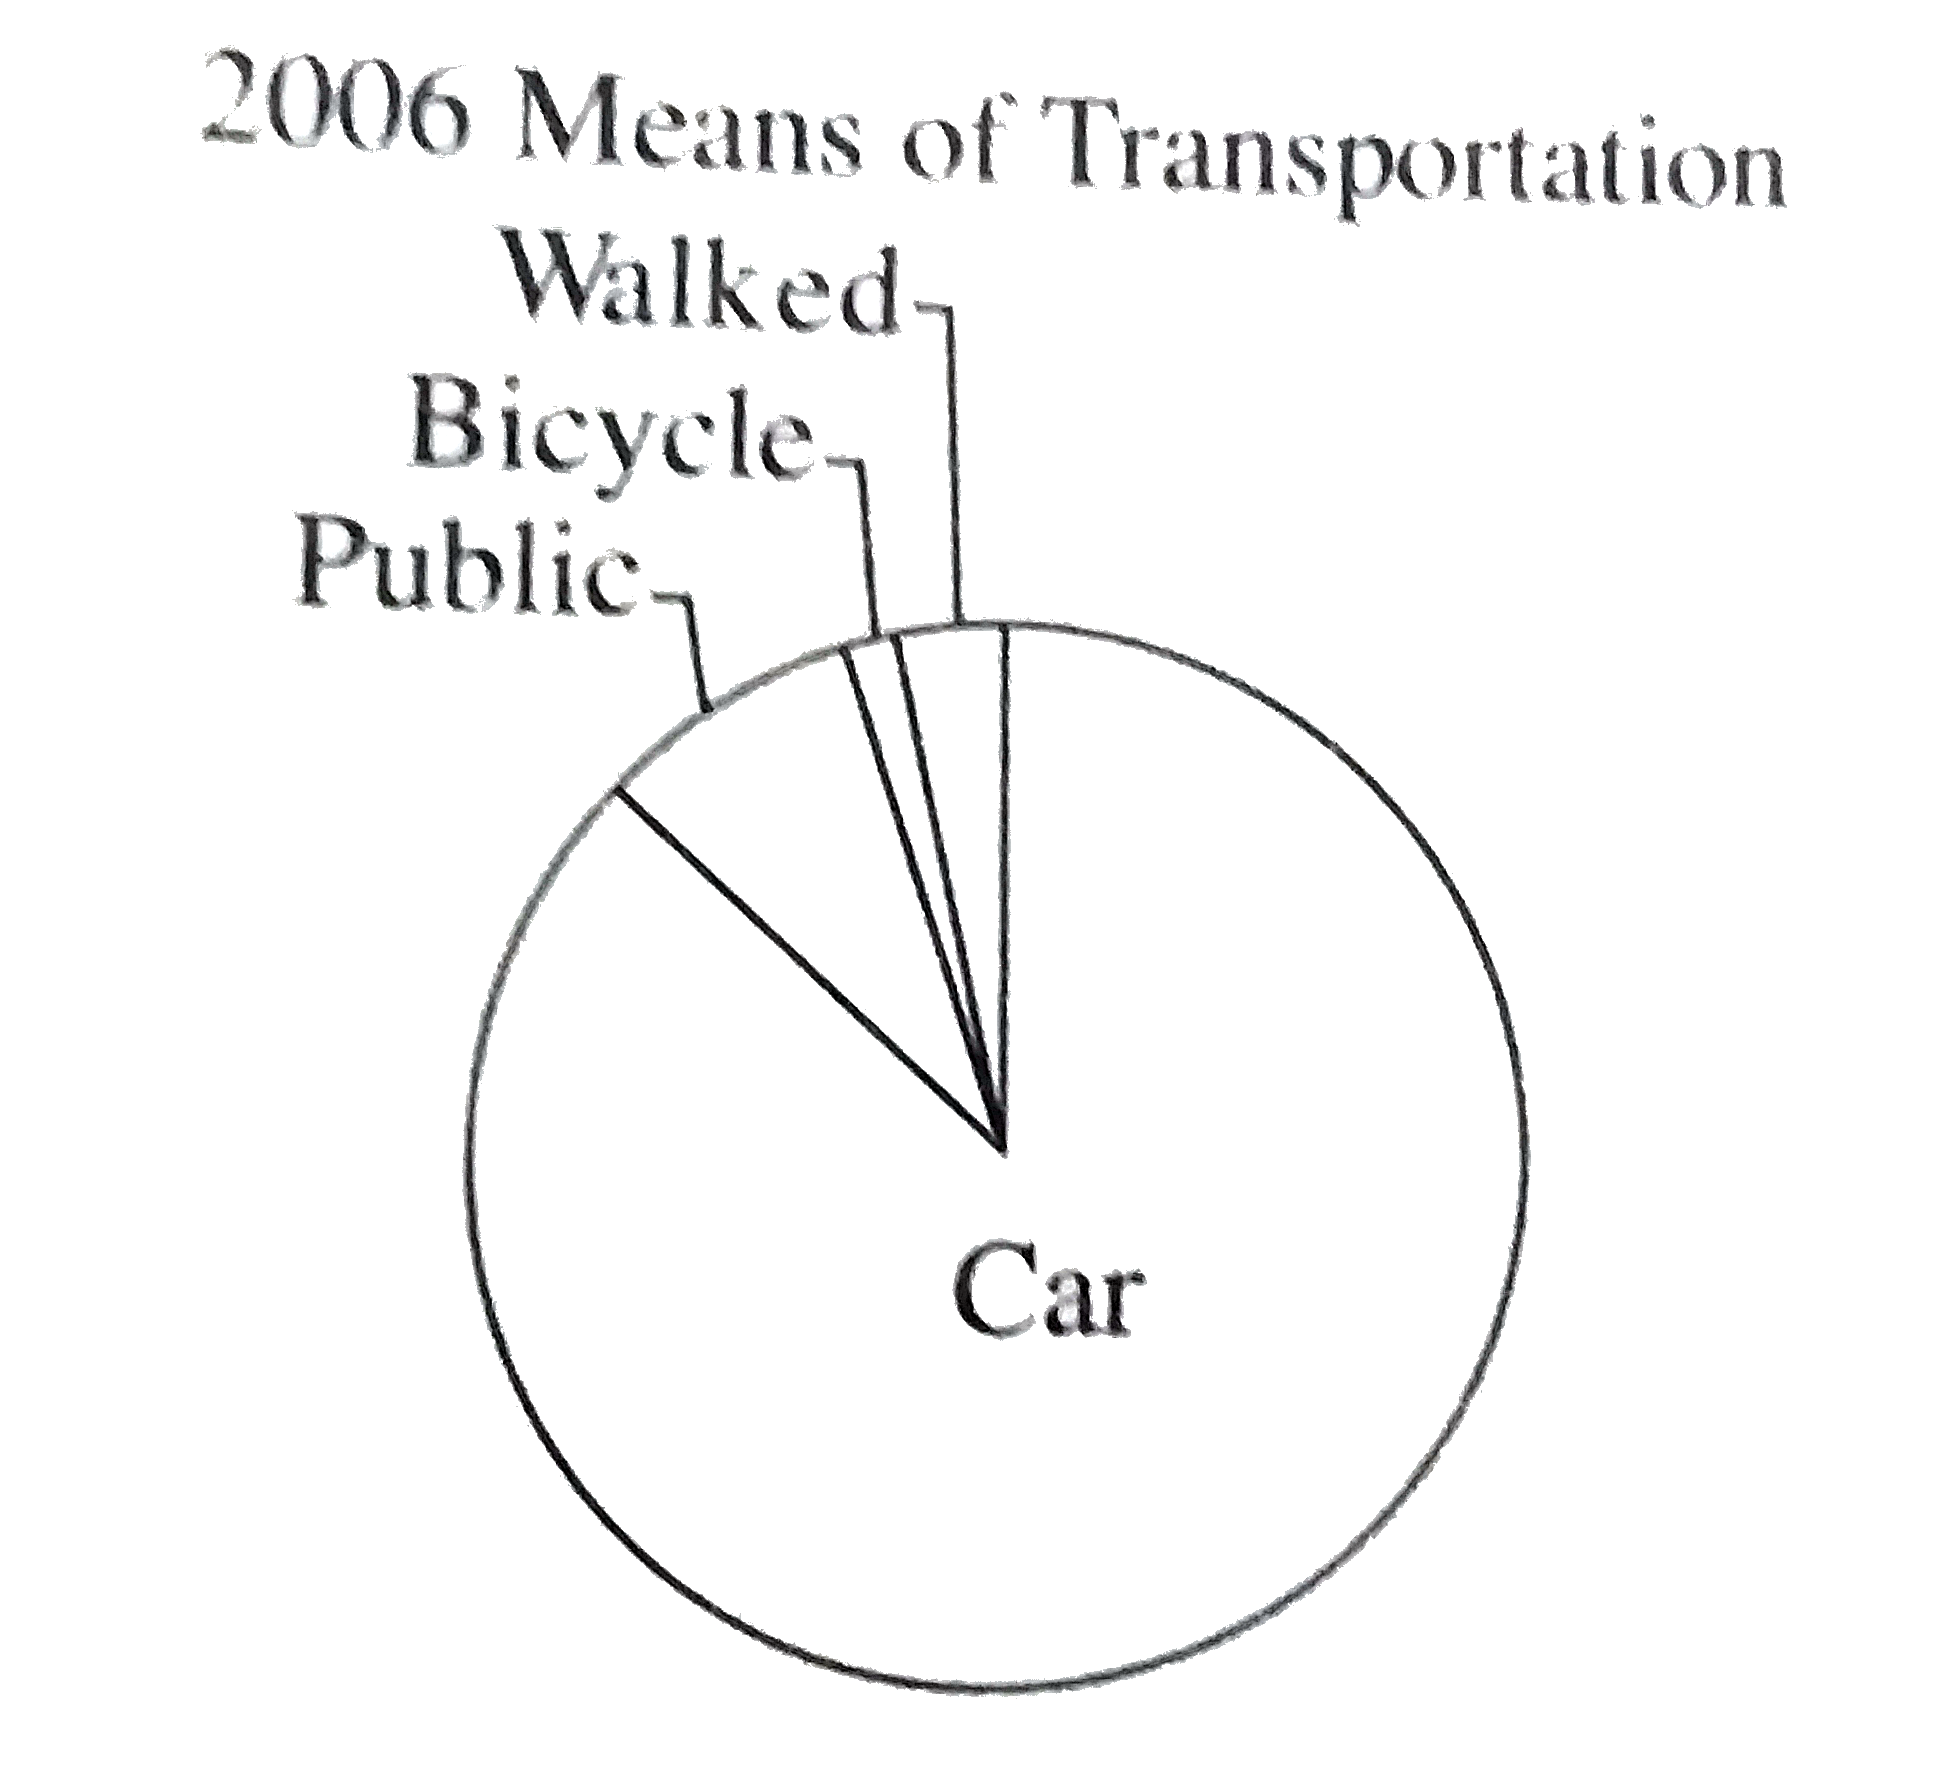 A8∘B12∘C20∘D30∘
The table below details a recent census report about the commuting habits of U.S . Workers age 16 or over for the years 2004 , 2005 , and 2006.
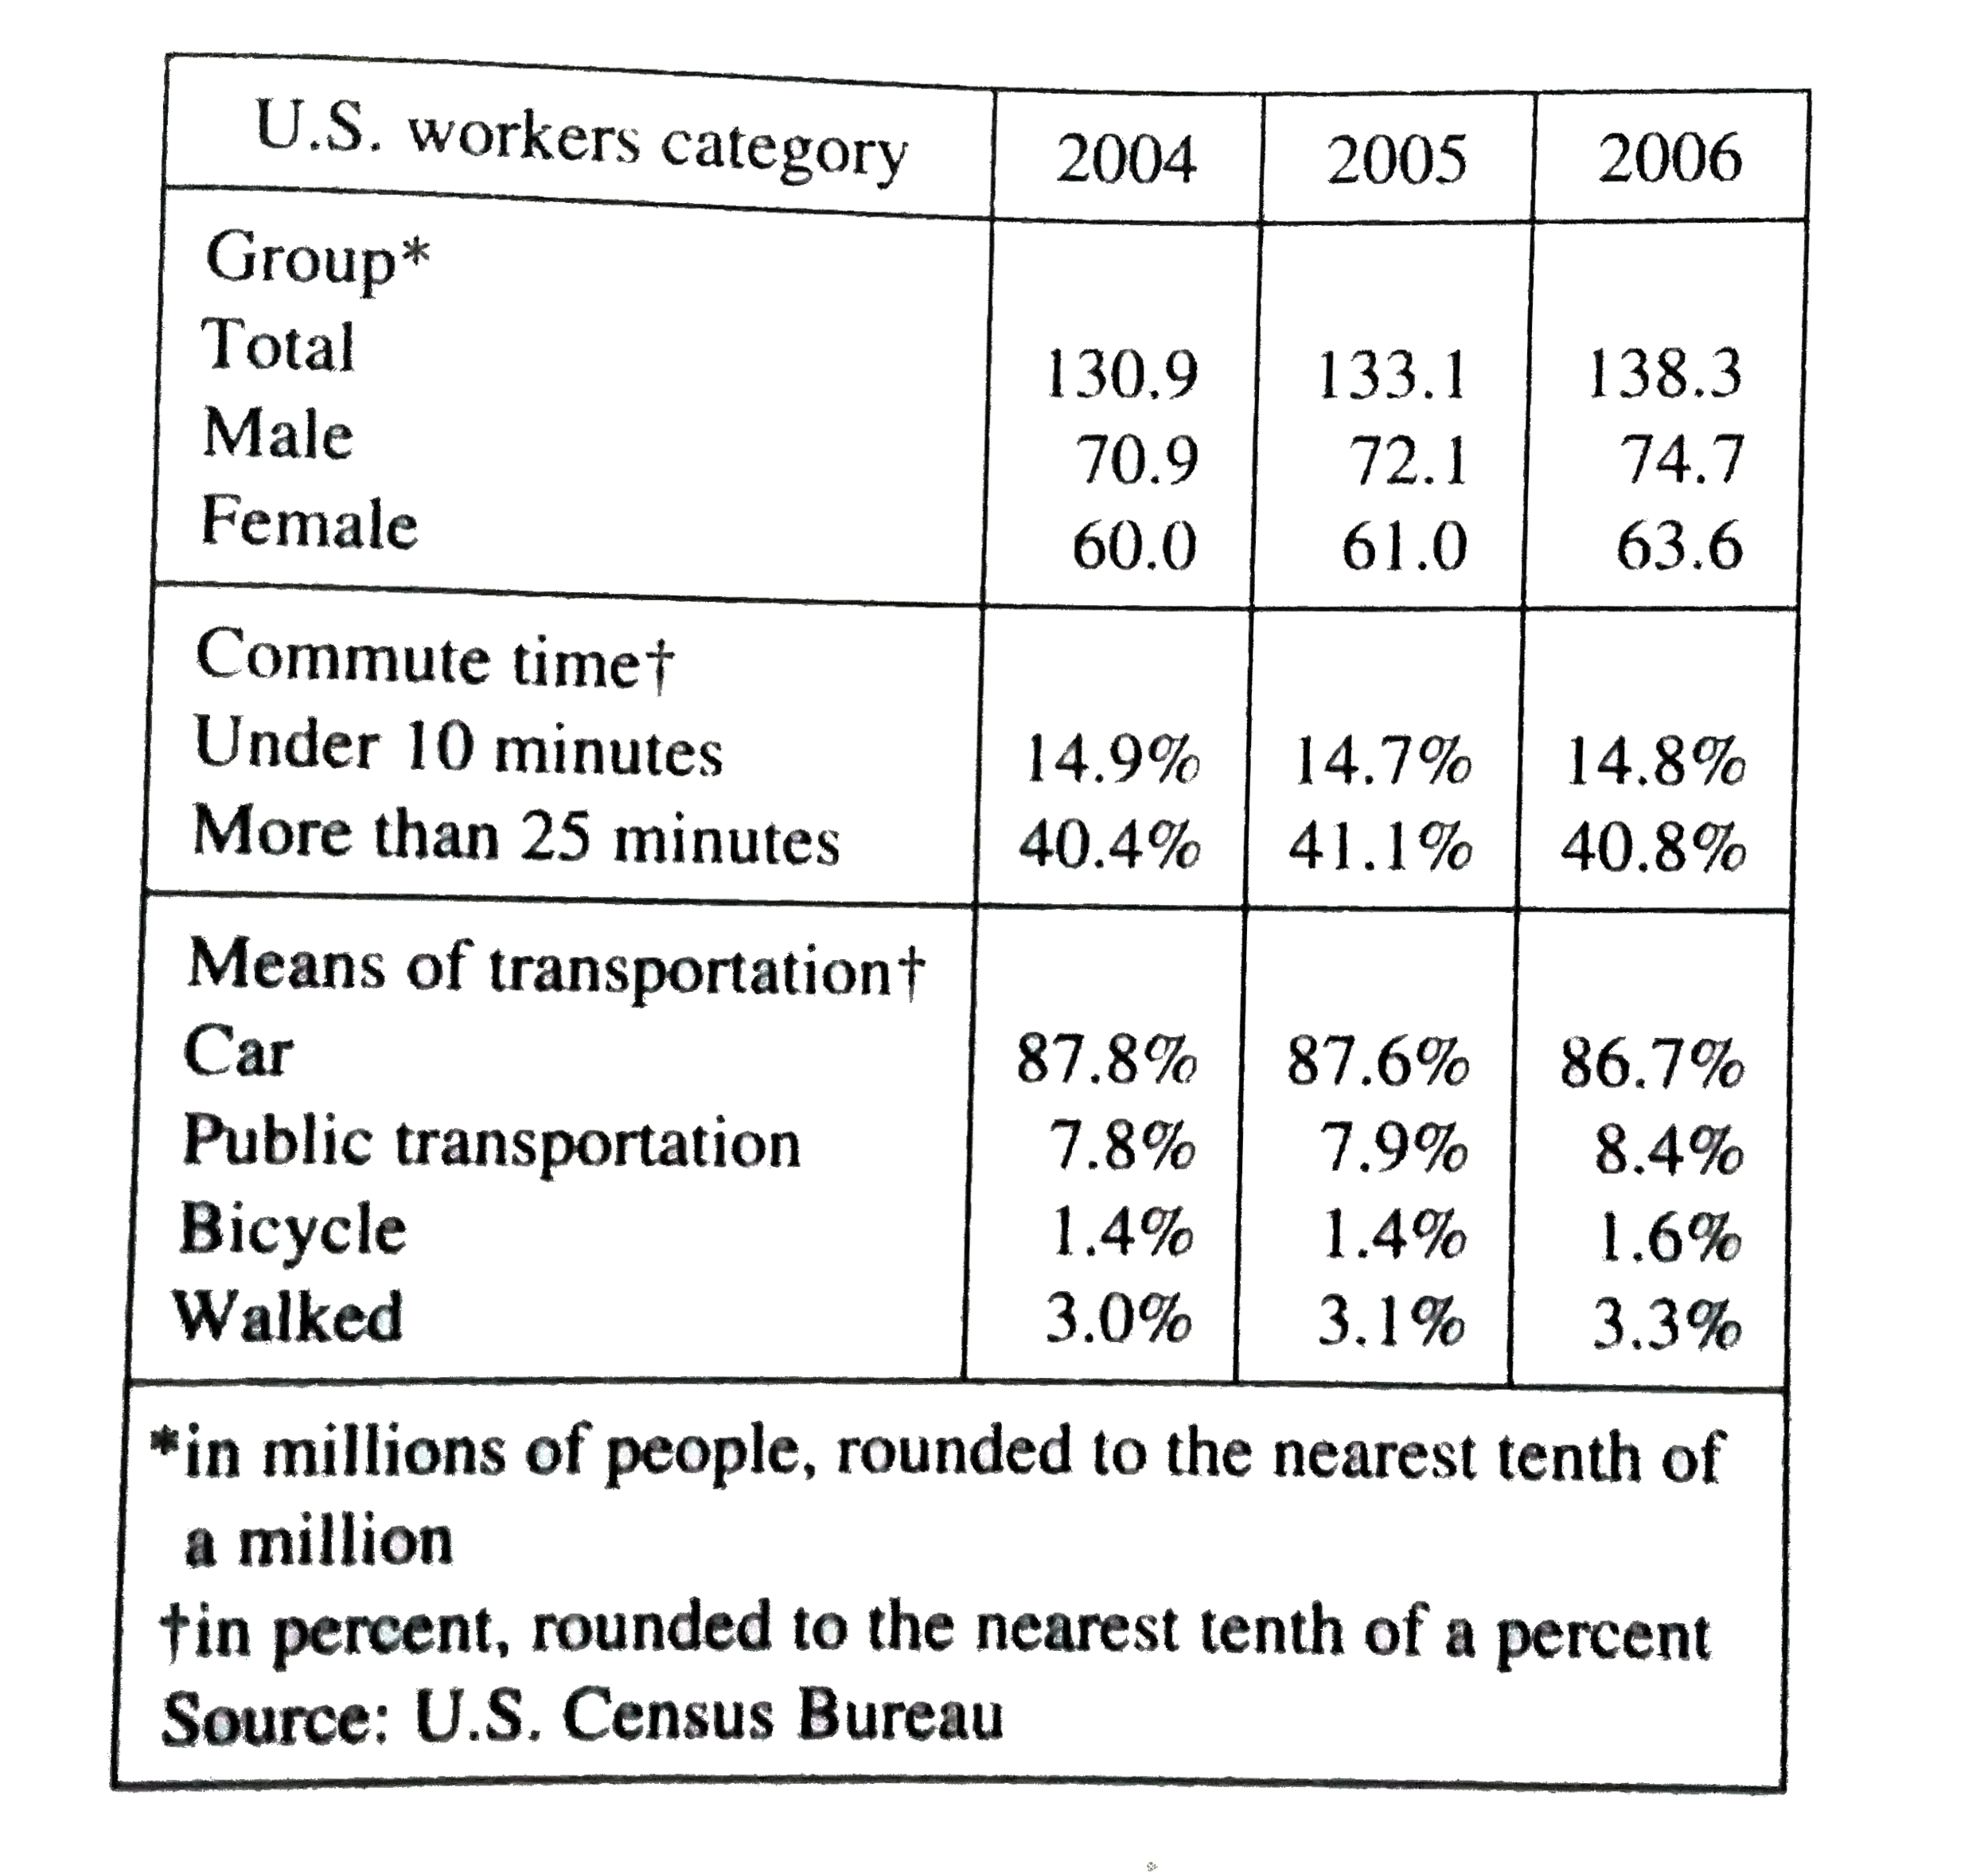
Expressed in millions of people , what was the average growth per year for female U.S workers age 16 or over from 2004 to 2006 , rounded to the nearest 0.1 million ?A0.5B0.9C1.3D1.8
If shoppers enter a store at an average rate of r shoppers per minute and each stays in the store for an average time of T minutes, the average number of shoppers in the store, N, at any one time is given by the formula N rT = . This relationship is known as Little’s law. The owner of the Good Deals Store estimates that during business hours, an average of 3 shoppers per minute enter the store and that each of them stays an average of 15 minutes. The store owner uses Little’s law to estimate that there are 45 shoppers in the store at any time.
Little’s law can be applied to any part of the store, such as a particular department or the checkout lines. The store owner determines that, during business hours, approximately 84 shoppers per hour make a purchase and each of these shoppers spend an average of 5 minutes in the checkout line. At any time during business hours, about how many shoppers, on average, are waiting in the checkout line to make a purchase at the Good Deals Store?
View SolutionA circus wishes to develop a new clown act. Fig. (1) shows a diagram of the proposed setup. A clown will be shot out of a cannot with velocity v0 at a trajectory that makes an angle θ=45∘ with the ground. At this angile, the clown will travell a maximum horizontal distance. The cannot will accelerate the clown by applying a constant force of 10,000N over a very short time of 0.24s. The height above the ground at which the clown begins his trajectory is 10m.
A large hoop is to be suspended from the celling by a massless cable at just the right place so that the clown will be able to dive through it when he reaches a maximum height above the ground. After passing through the hoop he will then continue on his trajectory until arriving at the safety net. Fig (2) shows a graph of the vertical component of the clown's velocity as a function of time between the cannon and the hoop. Since the velocity depends on the mass of the particular clown performing the act, the graph shows data for serveral different masses.
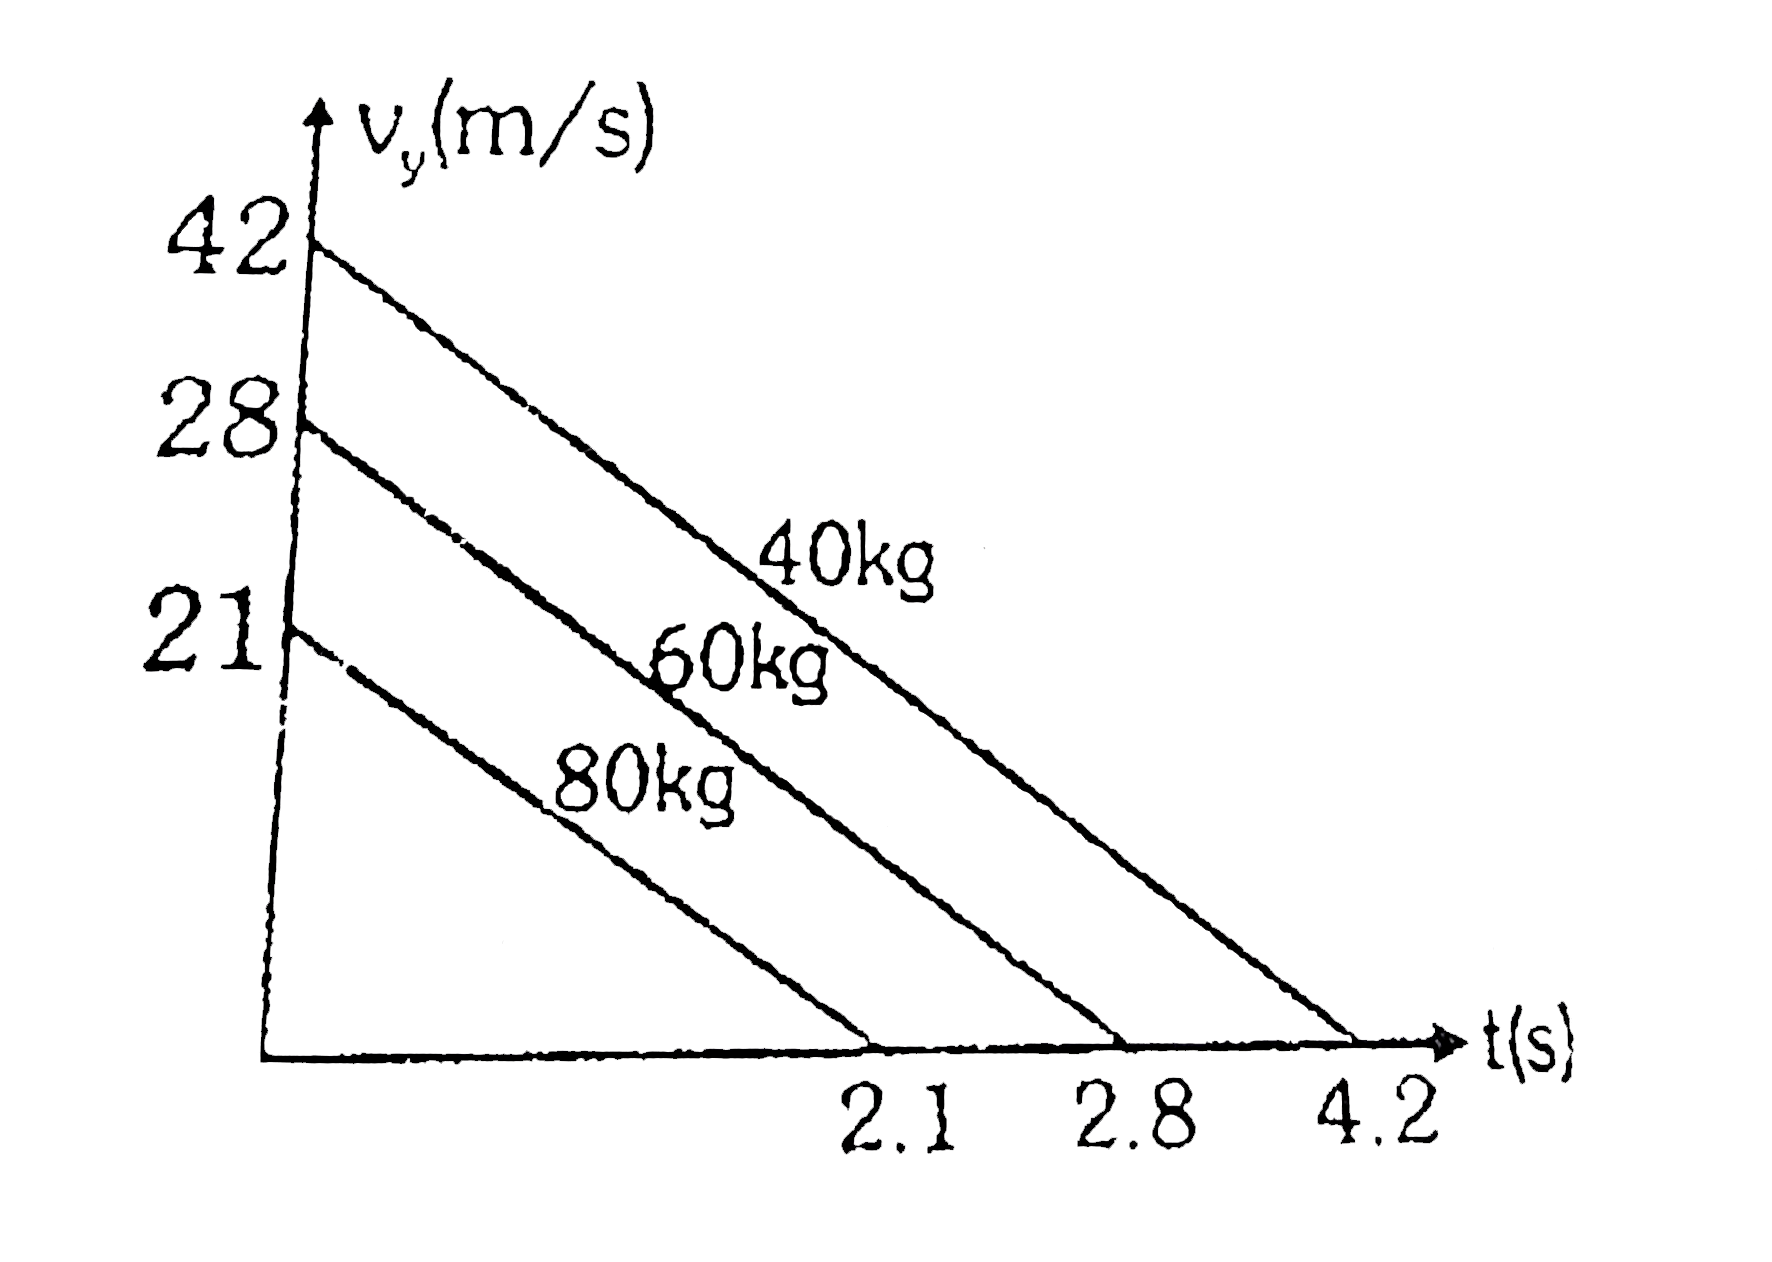
From figure 2, approximately how much time will it take for clown with a mass of 60 kg to reach the safety net located 10m below the height of the cannot?
View Solutionhe flu shot for a flu seaons is created four strains of the flu virus, named Strain A,B,C and D, respectively. Medical researchers use the following data to determine the effectiveness of the vacine over the flu season. Table 1 shows the effectiveness of the vaccine against each of these strains individually. The graph below the table shows the prevalence of each of these strains during each month of the flu season, represented as a percentage of the overall cases of flu that month.

For the strain against which the flu shot was the most effective. approximately how effective was the shot overall during the month that strain was least prevalent?
View SolutionThough there are 600 million cars on the planet, and counting, there are also seven billion people, which means that for the vast majority of us getting
around involves taking buses, ferryboats, commuter
line 5-trains, streetcars, and subways. In other words, traveling to work, school, or the market means being a straphanger: somebody who, by choice or necessity, relies on public transport, rather than a privately owned automobile.
line 10- Half the population of New York, Toronto, and London do not own cars. Public transport is how most of the people of Asia and Africa, the world’s most populous continents, travel. Every day, subway systems carry 155 million passengers, thirty-four
line 15- times the number carried by all the world’s airplanes, and the global public transport market is now valued at $428 billion annually. A century and a half after the invention of the internal combustion engine, private car ownership is still an anomaly.
line 20- And yet public transportation, in many minds, is the opposite of glamour—a squalid last resort for those with one too many impaired driving charges, too poor to afford insurance, or too decrepit to get behind the wheel of a car. In much of North
line 25- America, they are right: taking transit is a depressing experience. Anybody who has waited far too long on a street corner for the privilege of boarding a lurching, overcrowded bus, or wrestled luggage onto subways and shuttles to get to a big city airport,
line 30- knows that transit on this continent tends to be underfunded, ill-maintained, and ill-planned. Given the opportunity, who wouldn’t drive? Hopping in a car almost always gets you to your destination more quickly.
line 35- It doesn’t have to be like this. Done right, public transport can be faster, more comfortable, and cheaper than the private automobile. In Shanghai, German-made magnetic levitation trains skim over elevated tracks at 266 miles an hour, whisking people
line 40 - to the airport at a third of the speed of sound. In provincial French towns, electric-powered streetcars run silently on rubber tires, sliding through narrow streets along a single guide rail set into cobblestones. From Spain to Sweden, Wi-Fi equipped high-speed
line 45- trains seamlessly connect with highly ramified metro networks, allowing commuters to work on laptops as they prepare for same-day meetings in once distant capital cities. In Latin America, China, and India, working people board fast-loading buses that move
line 50 - like subway trains along dedicated busways, leaving the sedans and SUVs of the rich mired in dawn-to-dusk traffic jams. And some cities have transformed their streets into cycle-path freeways, making giant strides in public health and safety and ltbr line 55- the sheer livability of their neighborhoods—in the process turning the workaday bicycle into a viable form of mass transit. If you credit the demographers, this transit trend has legs. The “Millenials,” who reached adulthood
line 60 - around the turn of the century and now outnumber baby boomers, tend to favor cities over suburbs, and are far more willing than their parents to ride buses and subways. Part of the reason is their ease with iPads, MP3 players, Kindles, and smartphones: you
line 65- can get some serious texting done when you’re not driving, and earbuds offer effective insulation from all but the most extreme commuting annoyances. Even though there are more teenagers in the country than ever, only ten million have a driver’s license
line 70 - (versus twelve million a generation ago). Baby boomers may have been raised in Leave It to Beaver suburbs, but as they retire, a significant contingent is favoring older cities and compact towns where they have the option of walking and riding bikes. Seniors
line 75- too, are more likely to use transit, and by 2025, there will be 64 million Americans over the age of sixty-five. Already, dwellings in older neighborhoods in Washington, D.C., Atlanta, and Denver, especially those near light-rail or subway stations, are
line 80 - commanding enormous price premiums over suburban homes. The experience of European and Asian cities shows that if you make buses, subways, and trains convenient, comfortable, fast, and safe, a surprisingly large percentage of citizens will opt to
line 85- ride rather than drive.
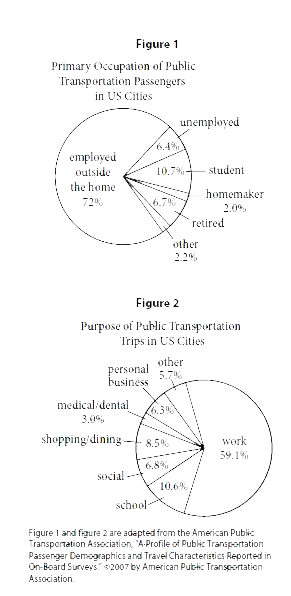
Which choice provides the best evidence for the answer to the previous question?
View SolutionThe table below details a recent census report about the commuting habits of U.S . Workers age 16 or over for the years 2004 , 2005 , and 2006.
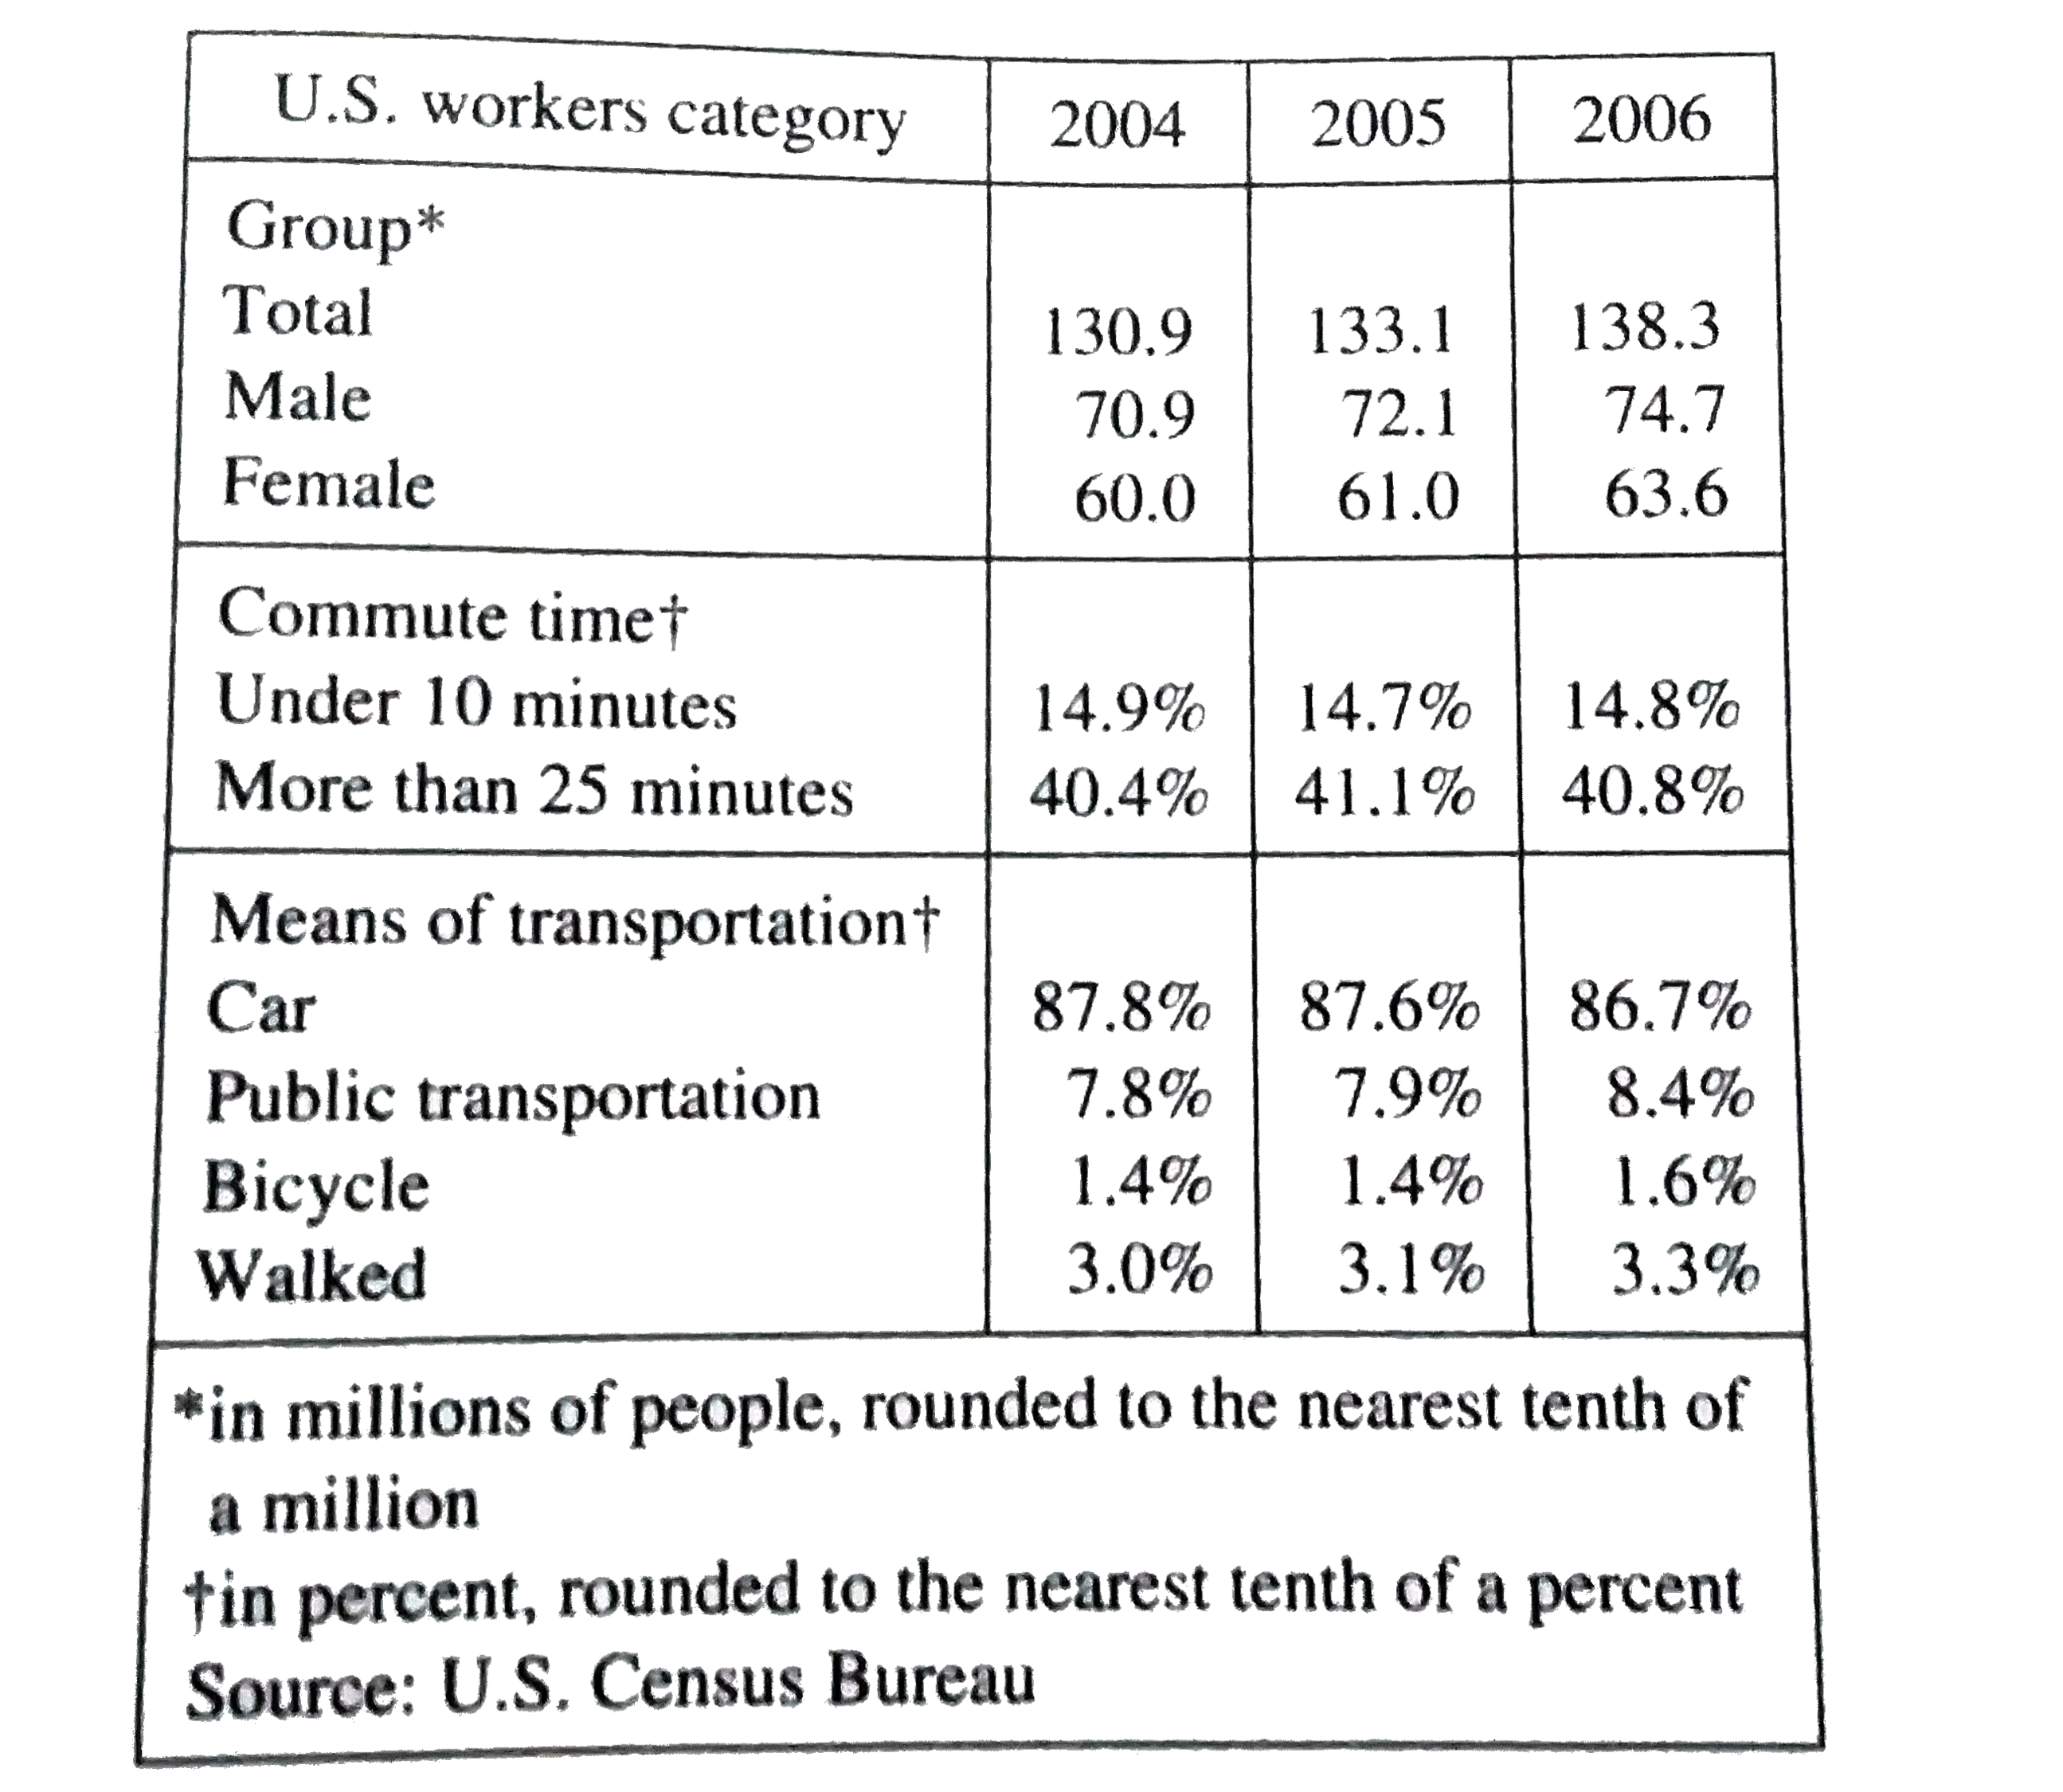
The the nearest percent , what percent of all U.S workers age 16 or over in 2004 was female ?
View Solution
