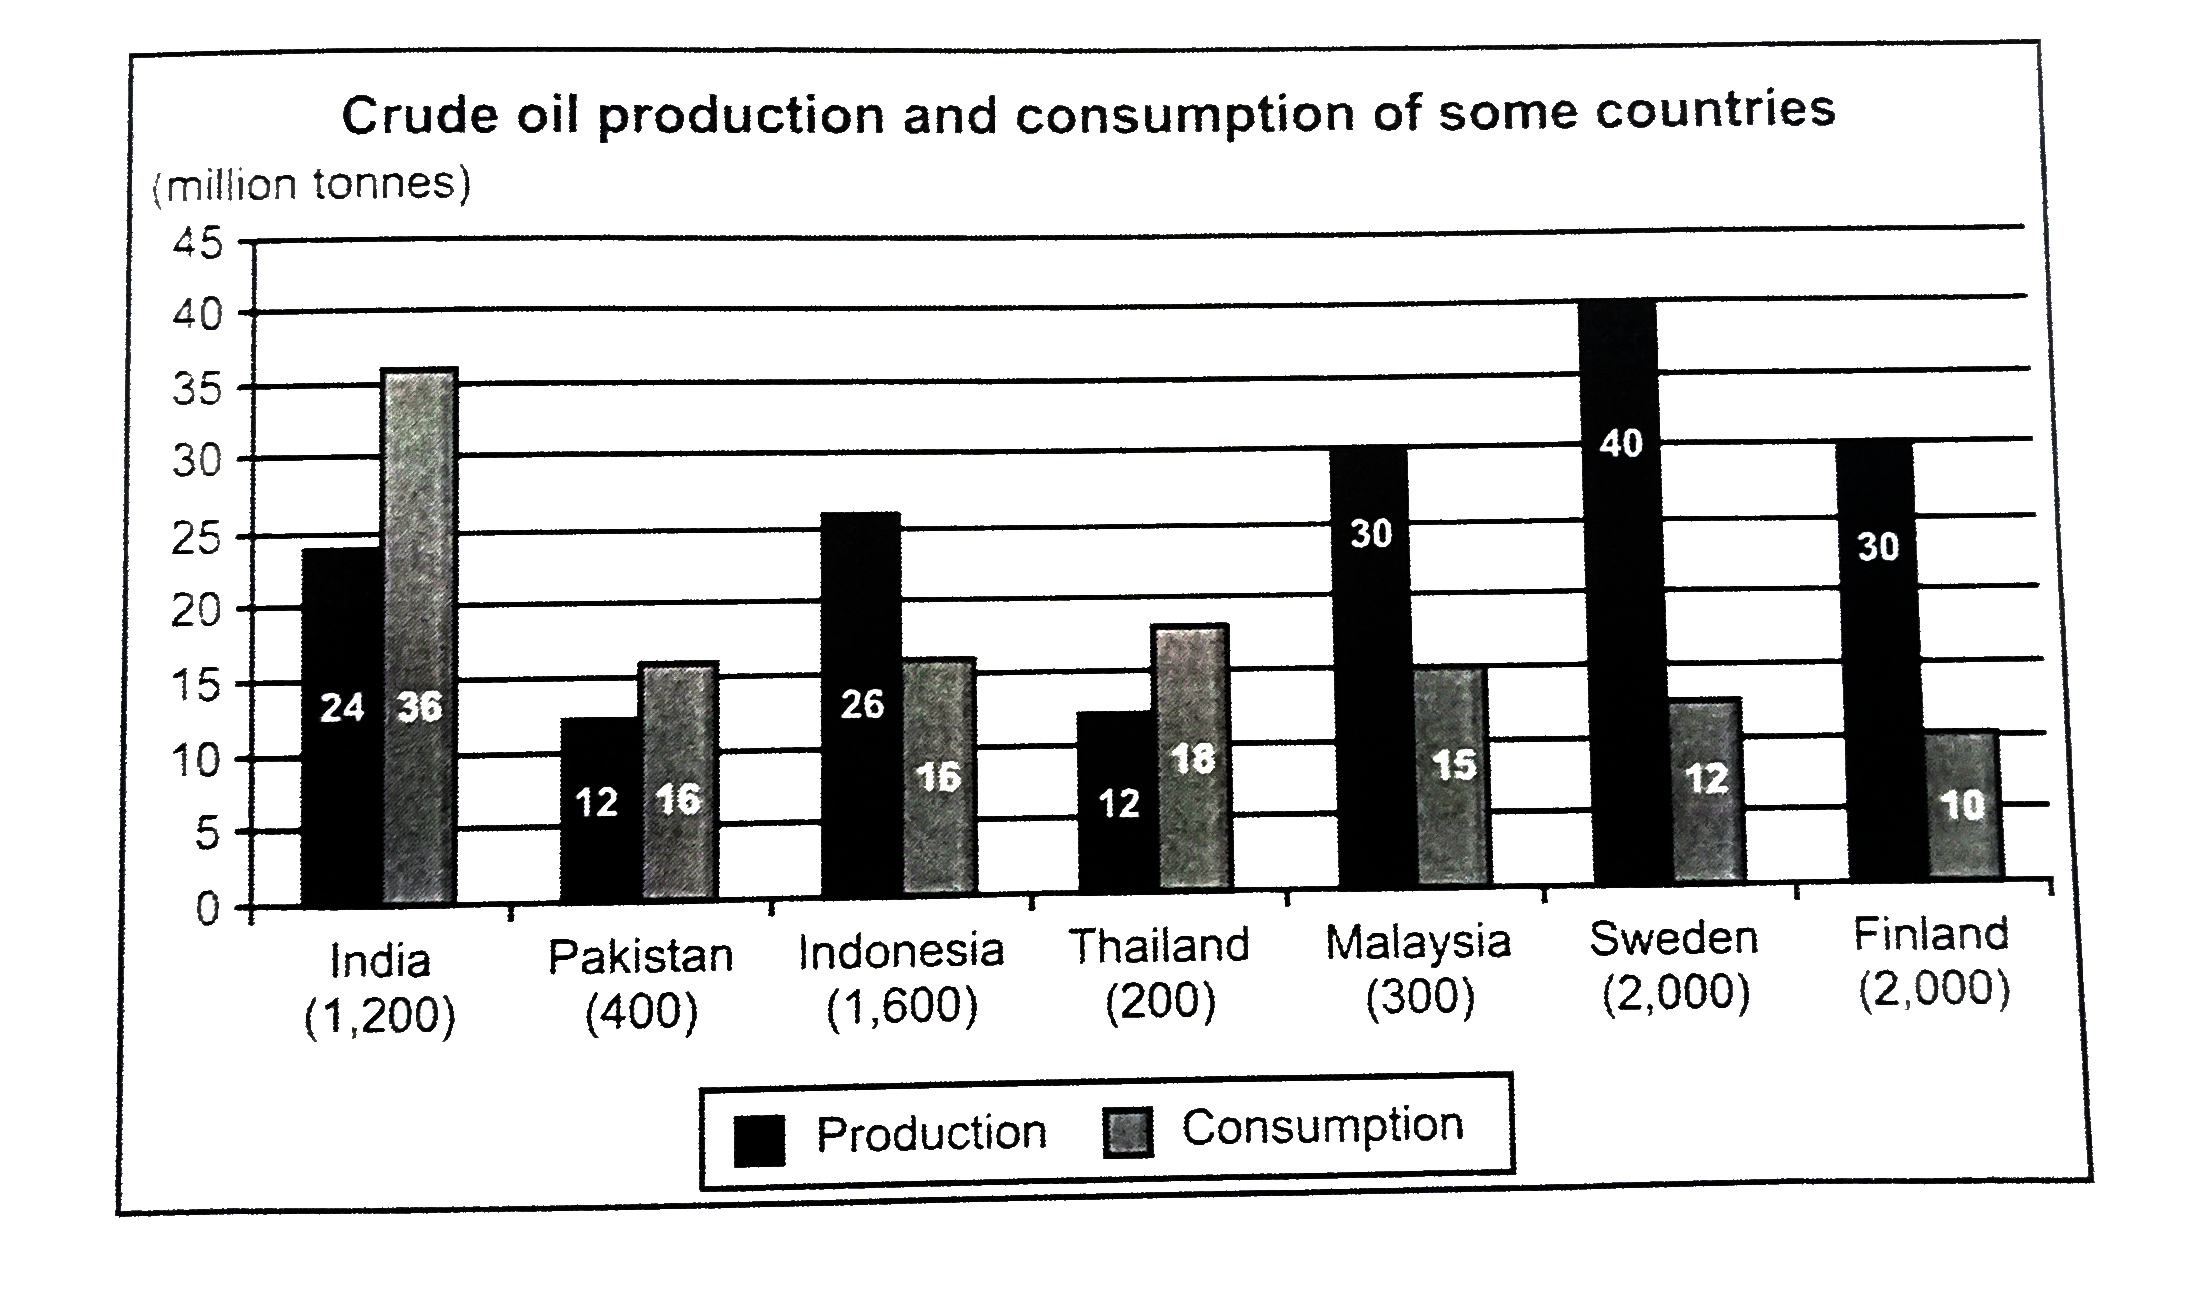
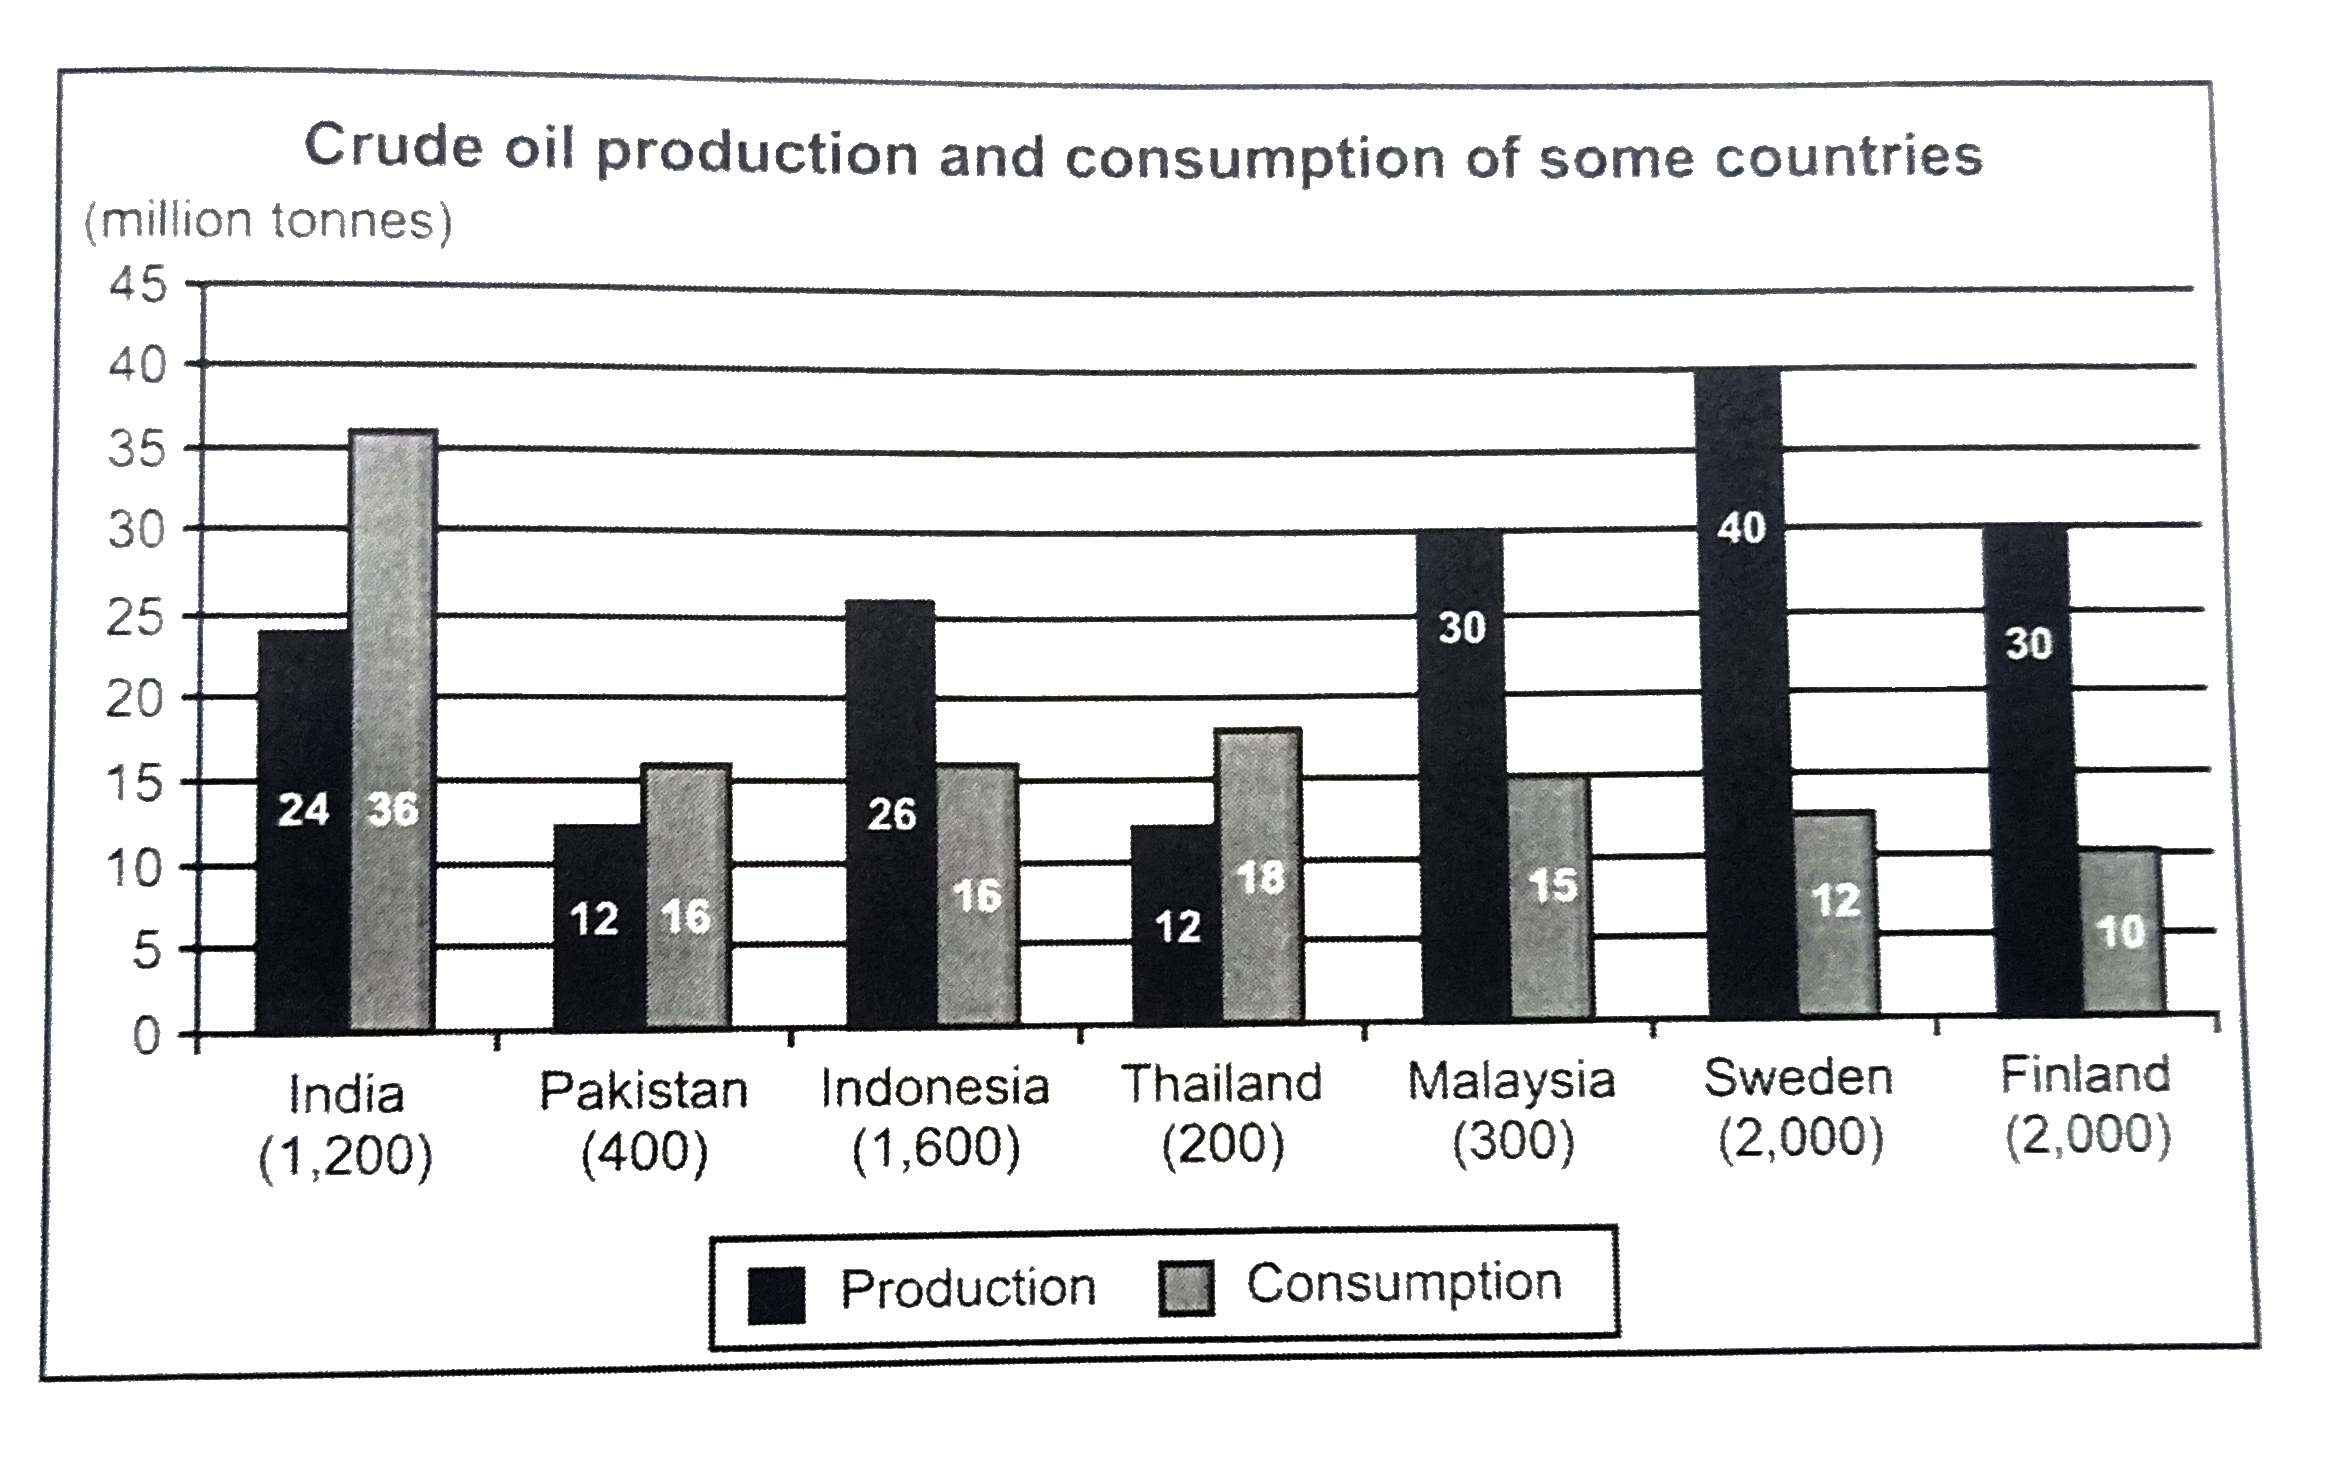
The graph below gives the production and consumption of crude oil in certain countries of the world. Answer the following question based on the graph below.
Figures below the names of the coutries indincation crude reserves in million tonnes.
Shortfall / (excess) between production and consumption is met by imports / (exports).
How long would the reserves last for the give countries together if we assume that there is no prouduction of crude oil in the give countries have the same consumption level in the future ?
45 years
53years
62 years
70 years
The correct Answer is:C
Step by step video, text & image solution for The graph below gives the production and consumption of crude oil in certain countries of the world. Answer the following question based on the graph below. Figures below the names of the coutries indincation crude reserves in million tonnes. Shortfall / (excess) between production and consumption is met by imports / (exports). How long would the reserves last for the give countries together if we assume that there is no prouduction of crude oil in the give countries have the same consumption level in the future ? by Maths experts to help you in doubts & scoring excellent marks in Class 12 exams.
Updated on:21/07/2023Topper's Solved these Questions
Similar Questions
Knowledge Check
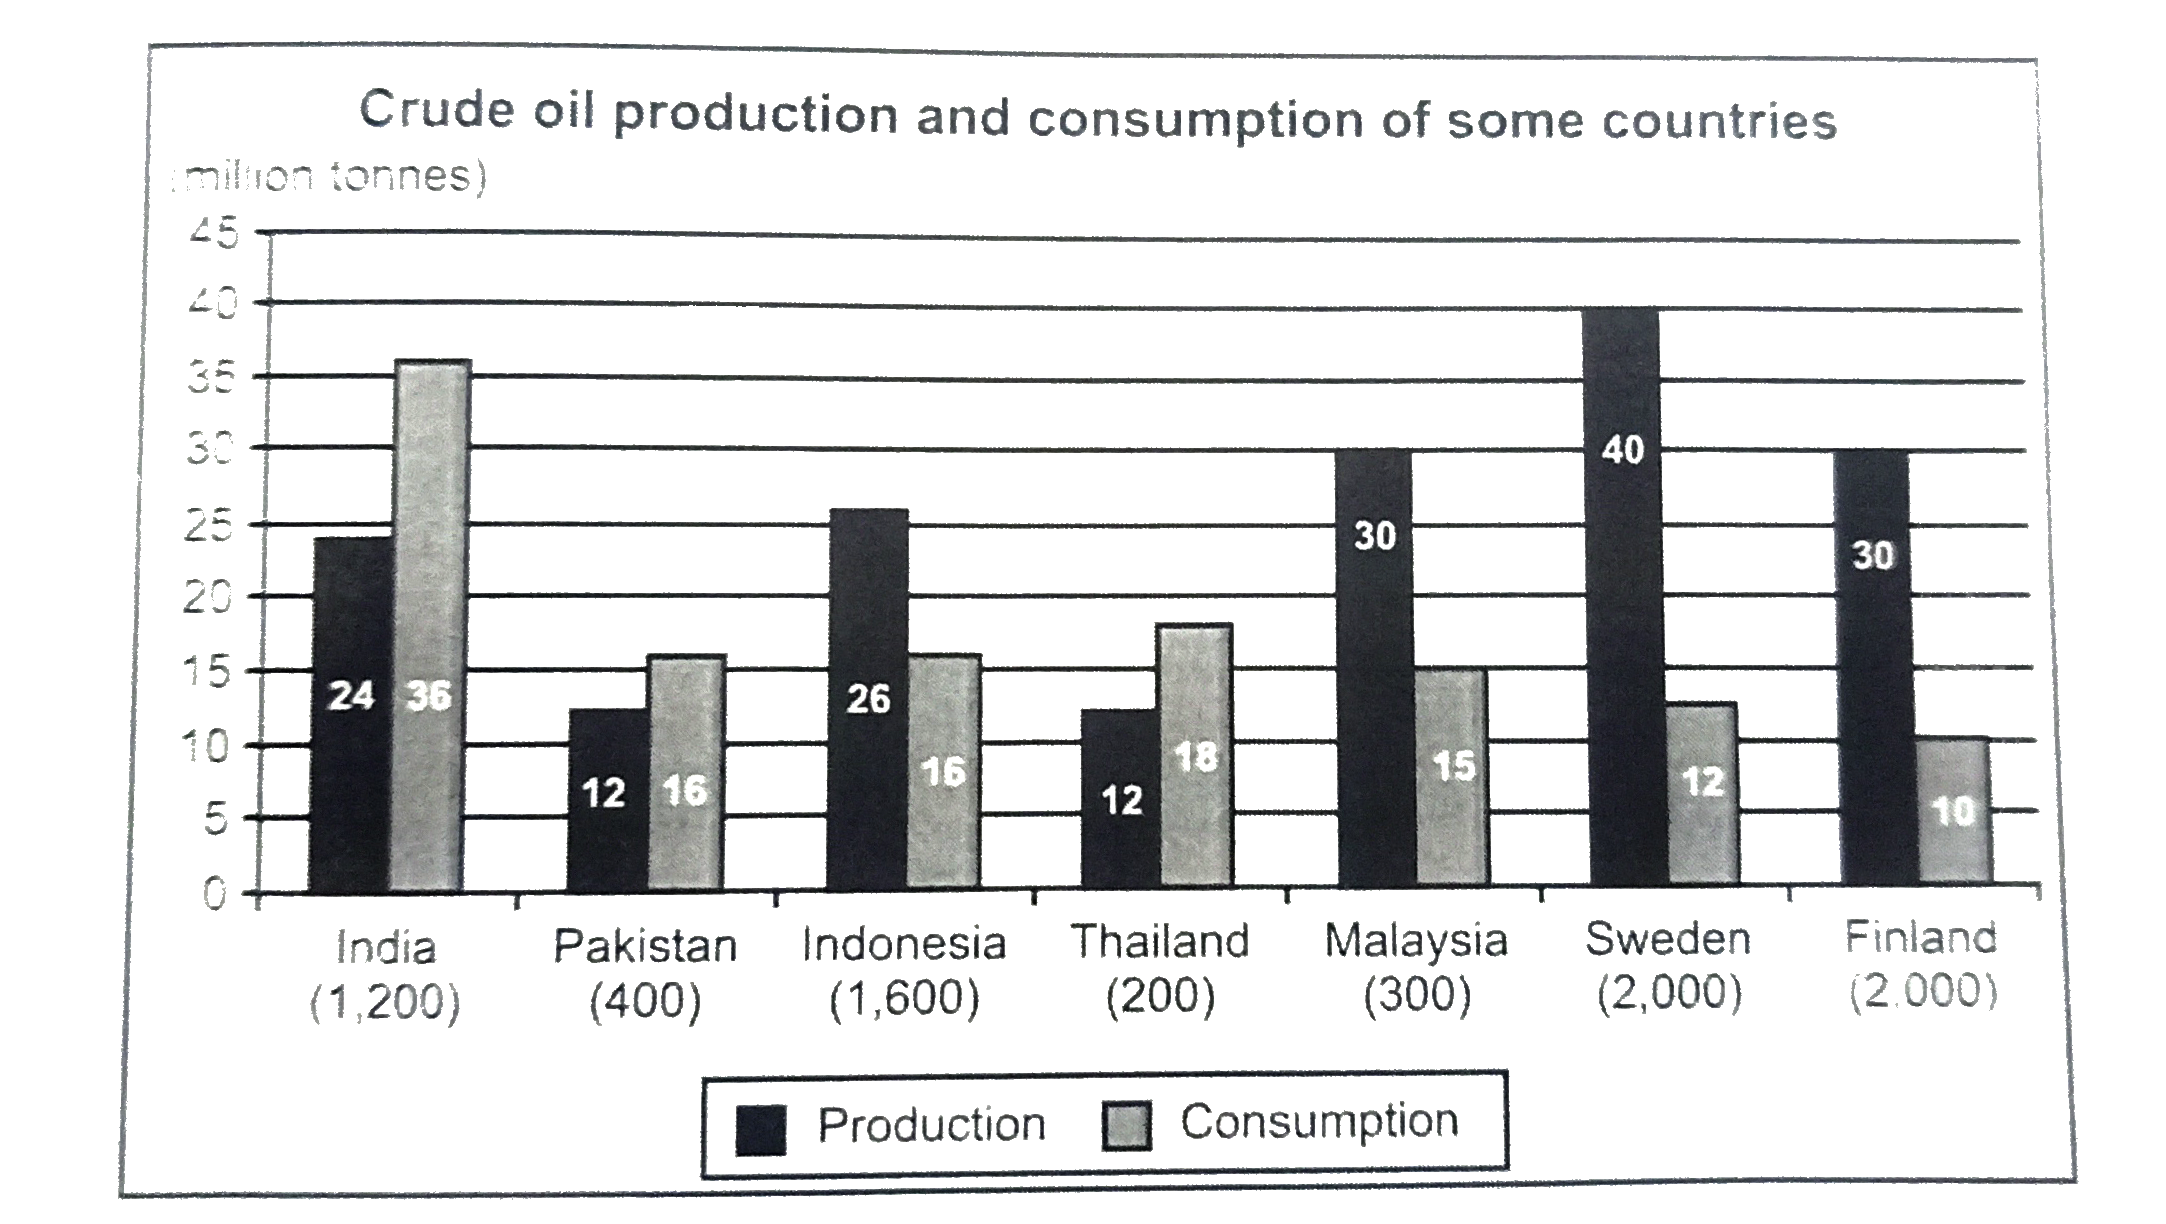
The graph below gives the production and consumption of crude oil in certain countries of the world. Answer the following question based on the graph below.
Figures below the names of the coutries indincation crude reserves in million tonnes.
Shortfall / (excess) between production and consumption is met by imports / (exports).
Which country has the maximum percenatge difference between its production and consumption ?
 AMalaysiaBSwedanCFinlandDIndonesia
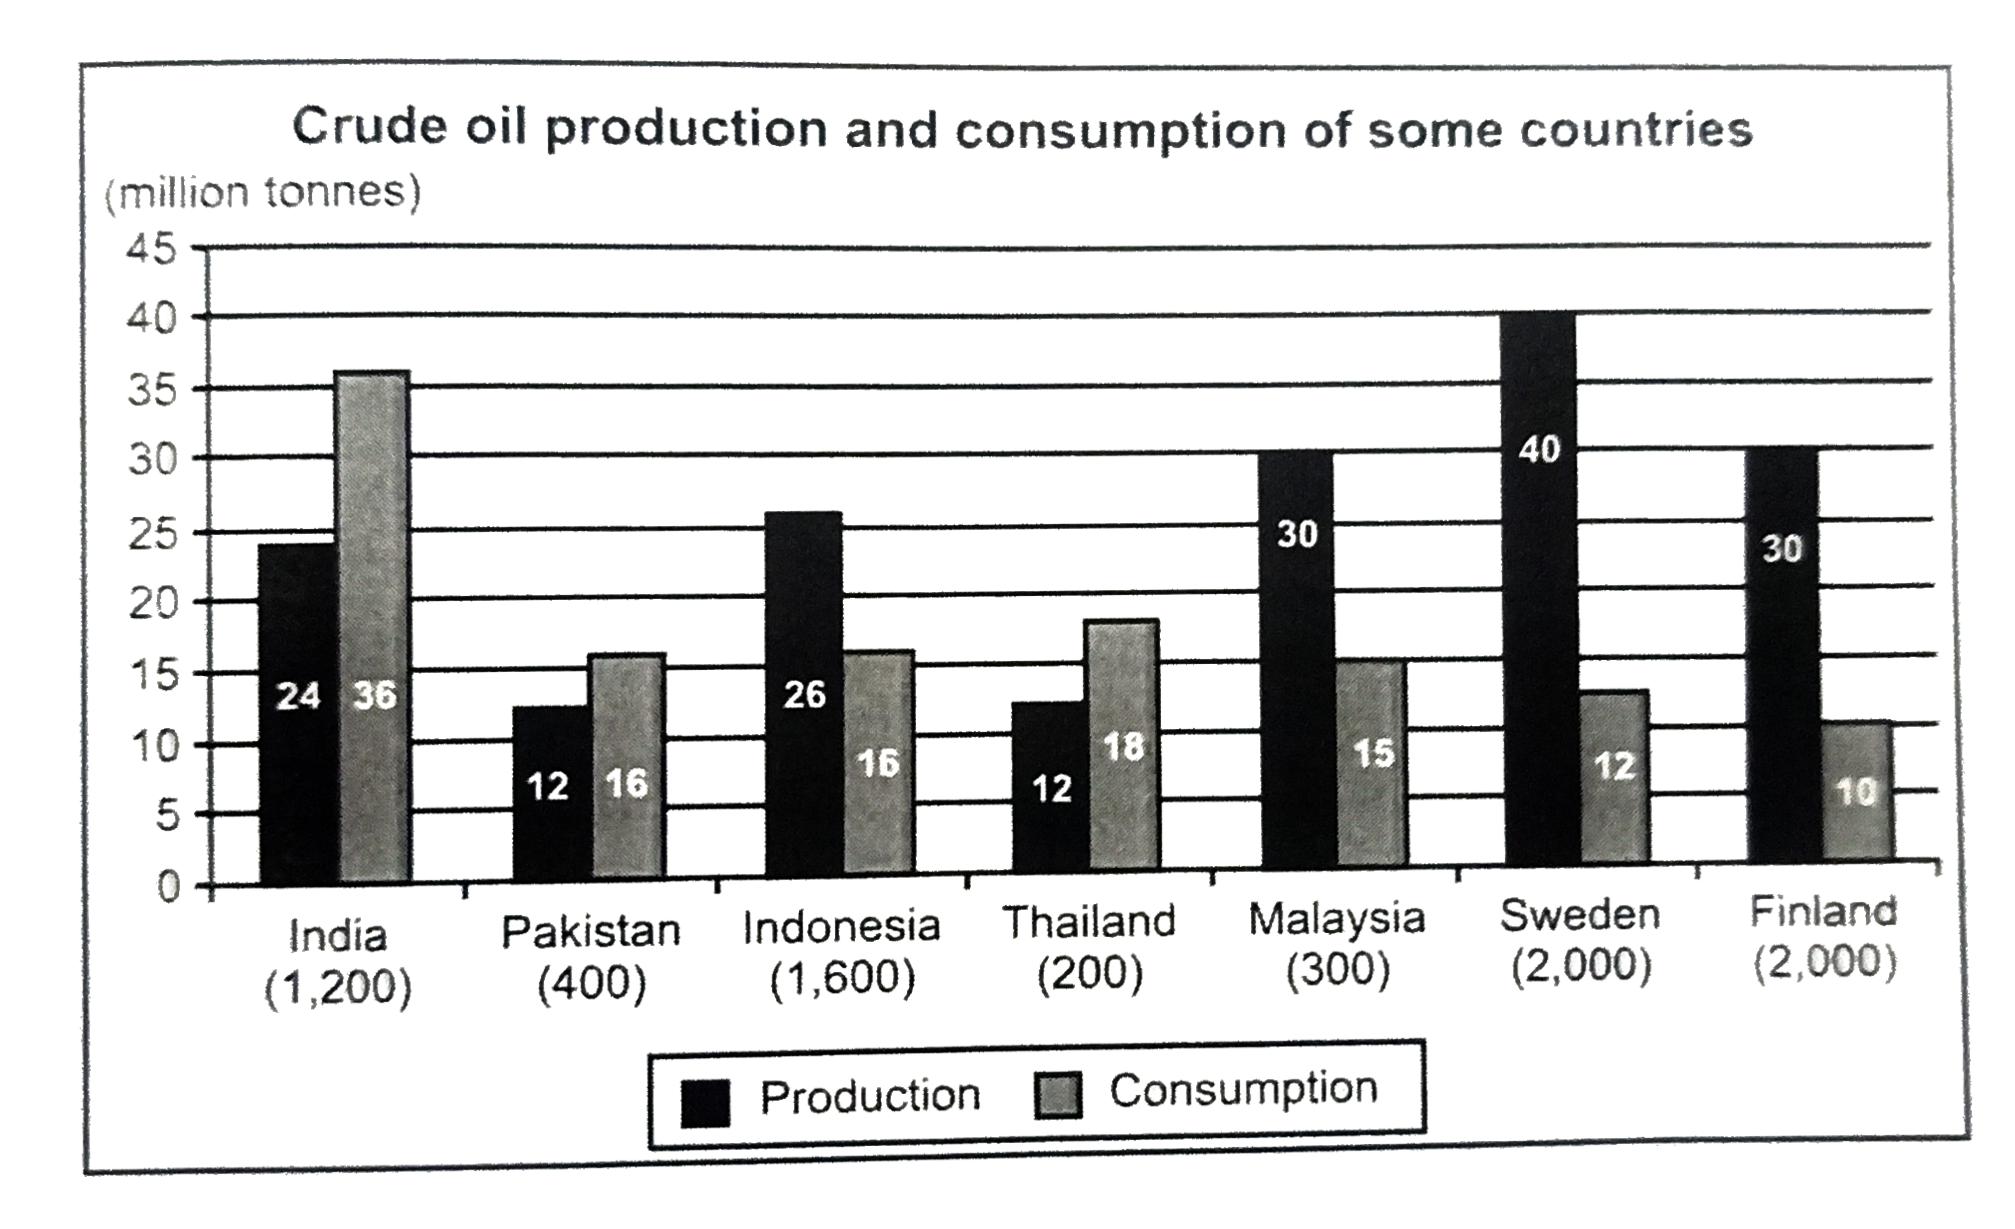
The graph below gives the production and consumption of crude oil in certain countries of the world. Answer the following question based on the graph below.
Figures below the names of the coutries indincation crude reserves in million tonnes.
Shortfall / (excess) between production and consumption is met by imports / (exports).
If India's entire important of crude oil is from Finland, what pecentage of Finland's exports are not to India ?
 A0.4B0.5C0.6D0.75
The graph below gives the production and consumption of crude oil in certain countries of the world. Answer the following question based on the graph below.
Figures below the names of the coutries indincation crude reserves in million tonnes.
Shortfall / (excess) between production and consumption is met by imports / (exports).
If Sweden produces 5% of world crude oil produce , then what is the percentage share of India in the world crude oil production ?
 A1.5%B3.0%C3.5%D4.0%
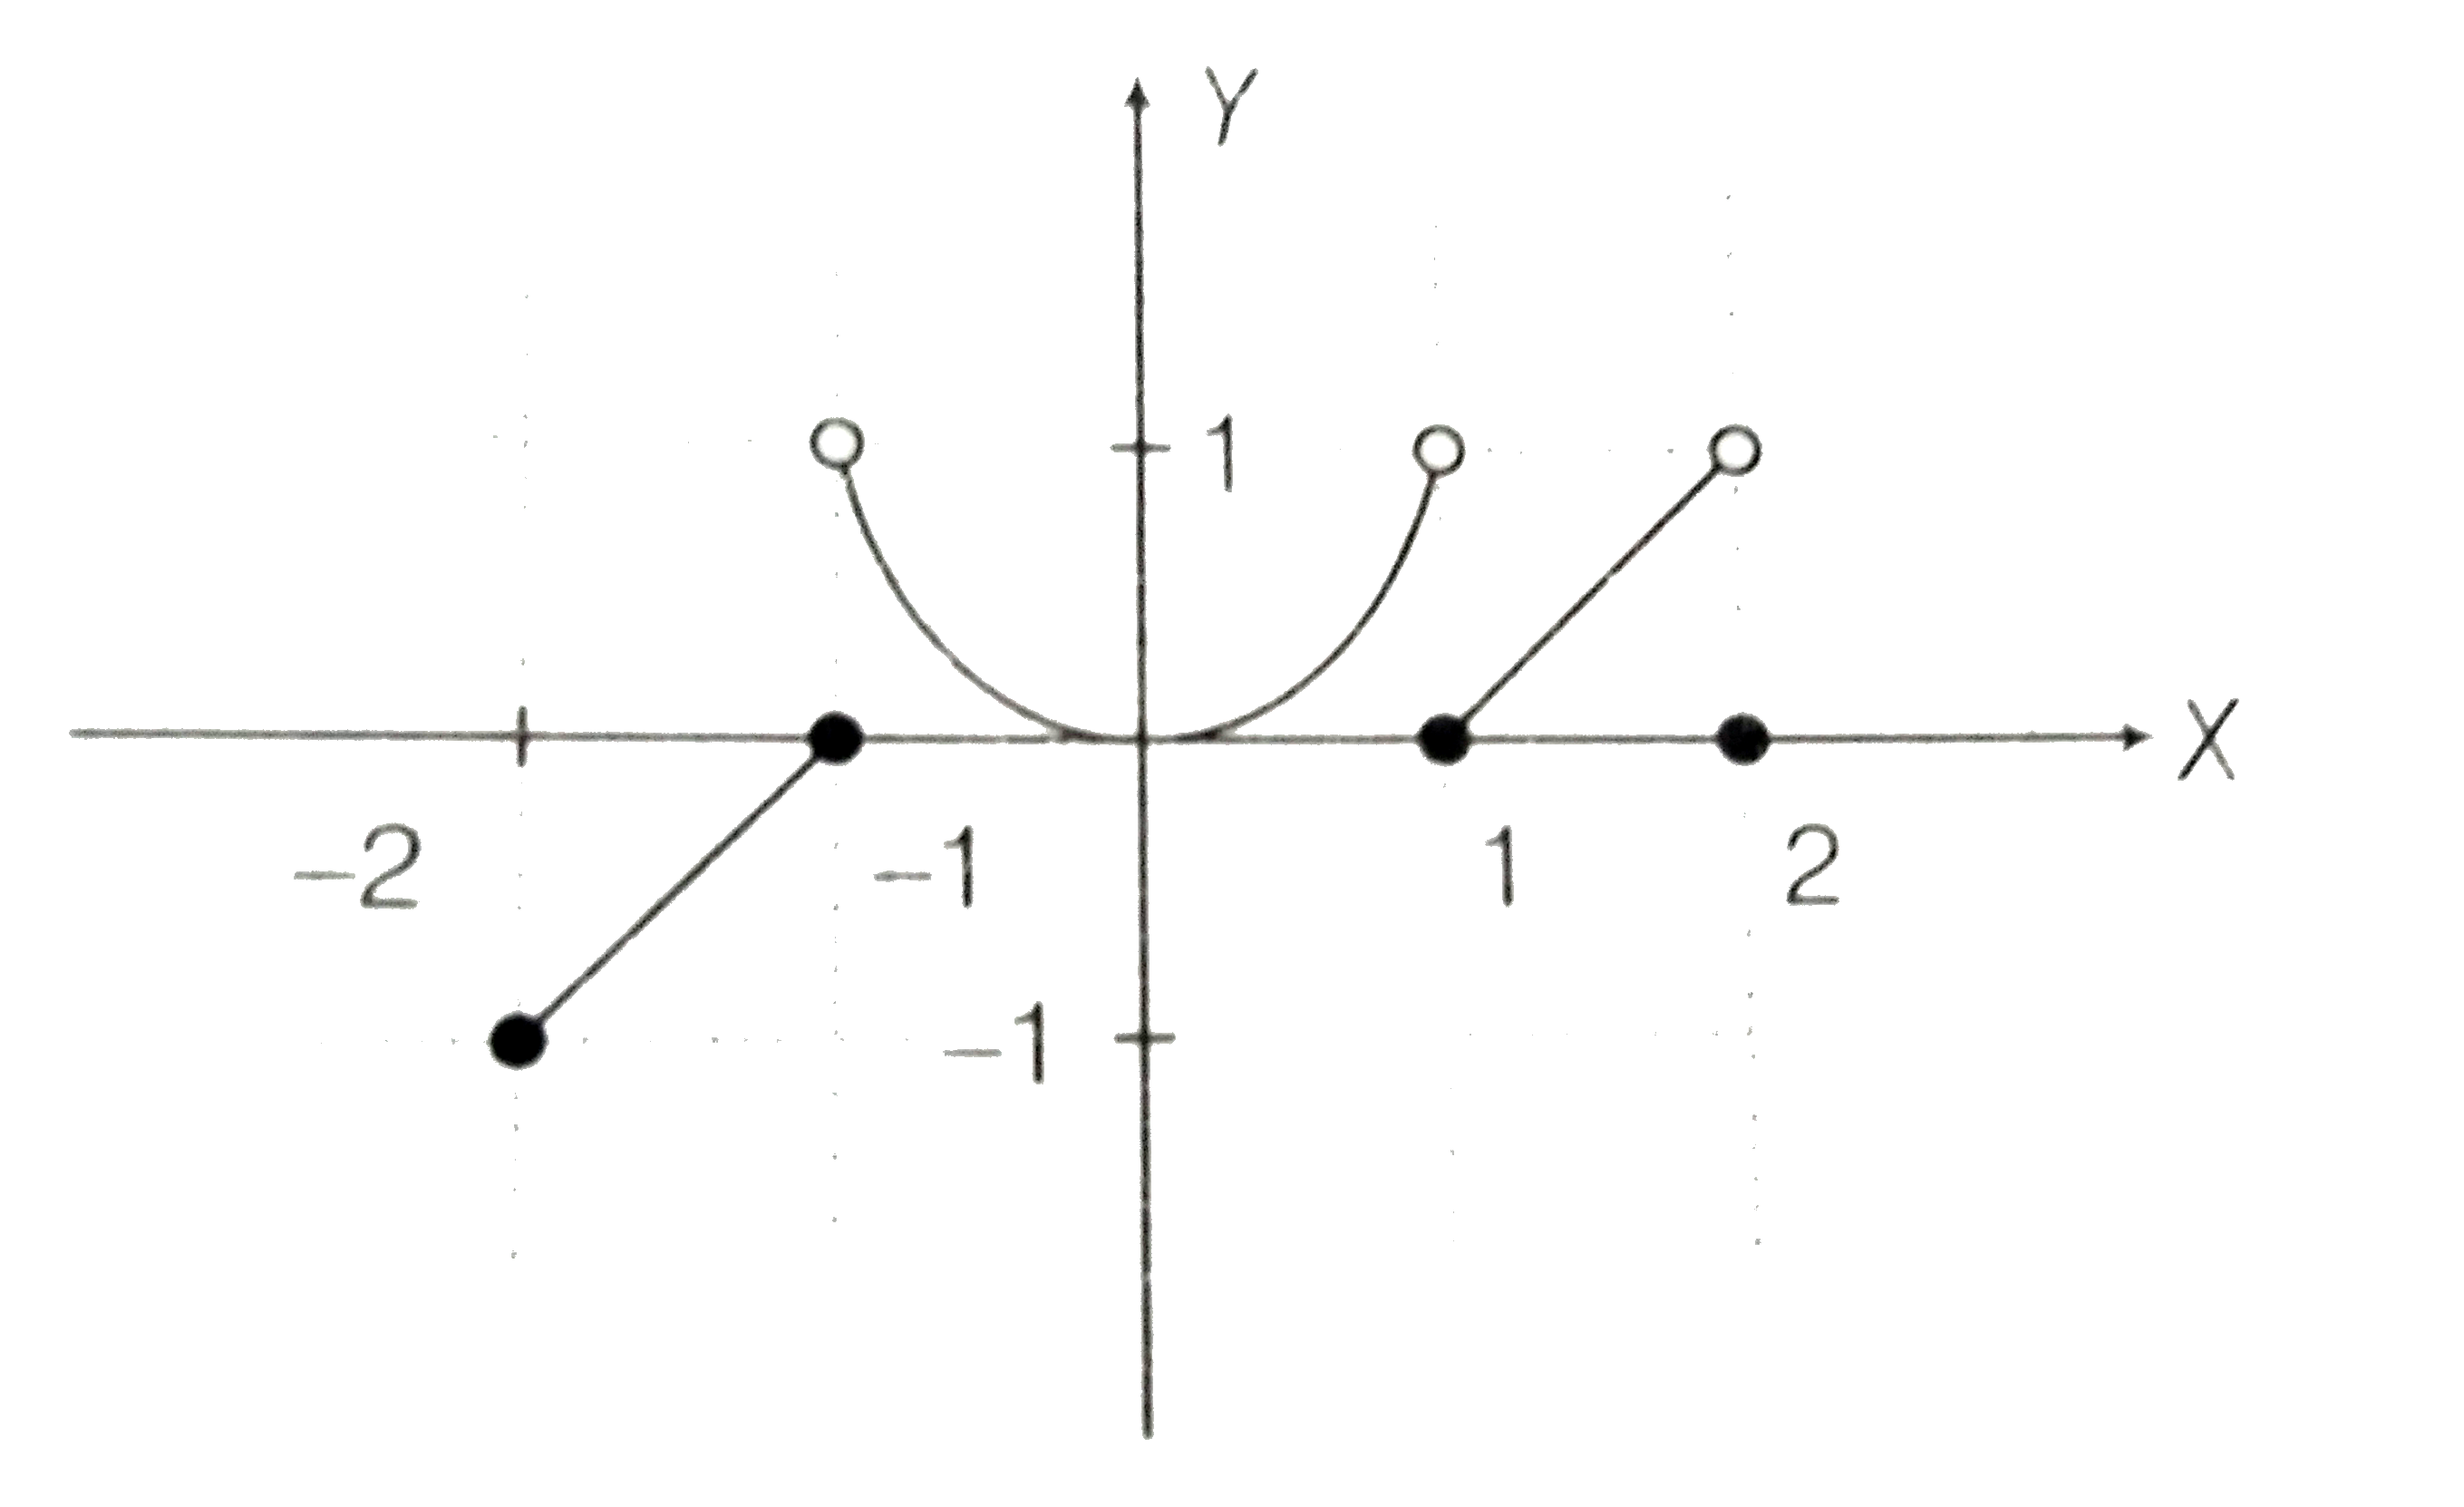
Consider the following function f whose graph is given below.
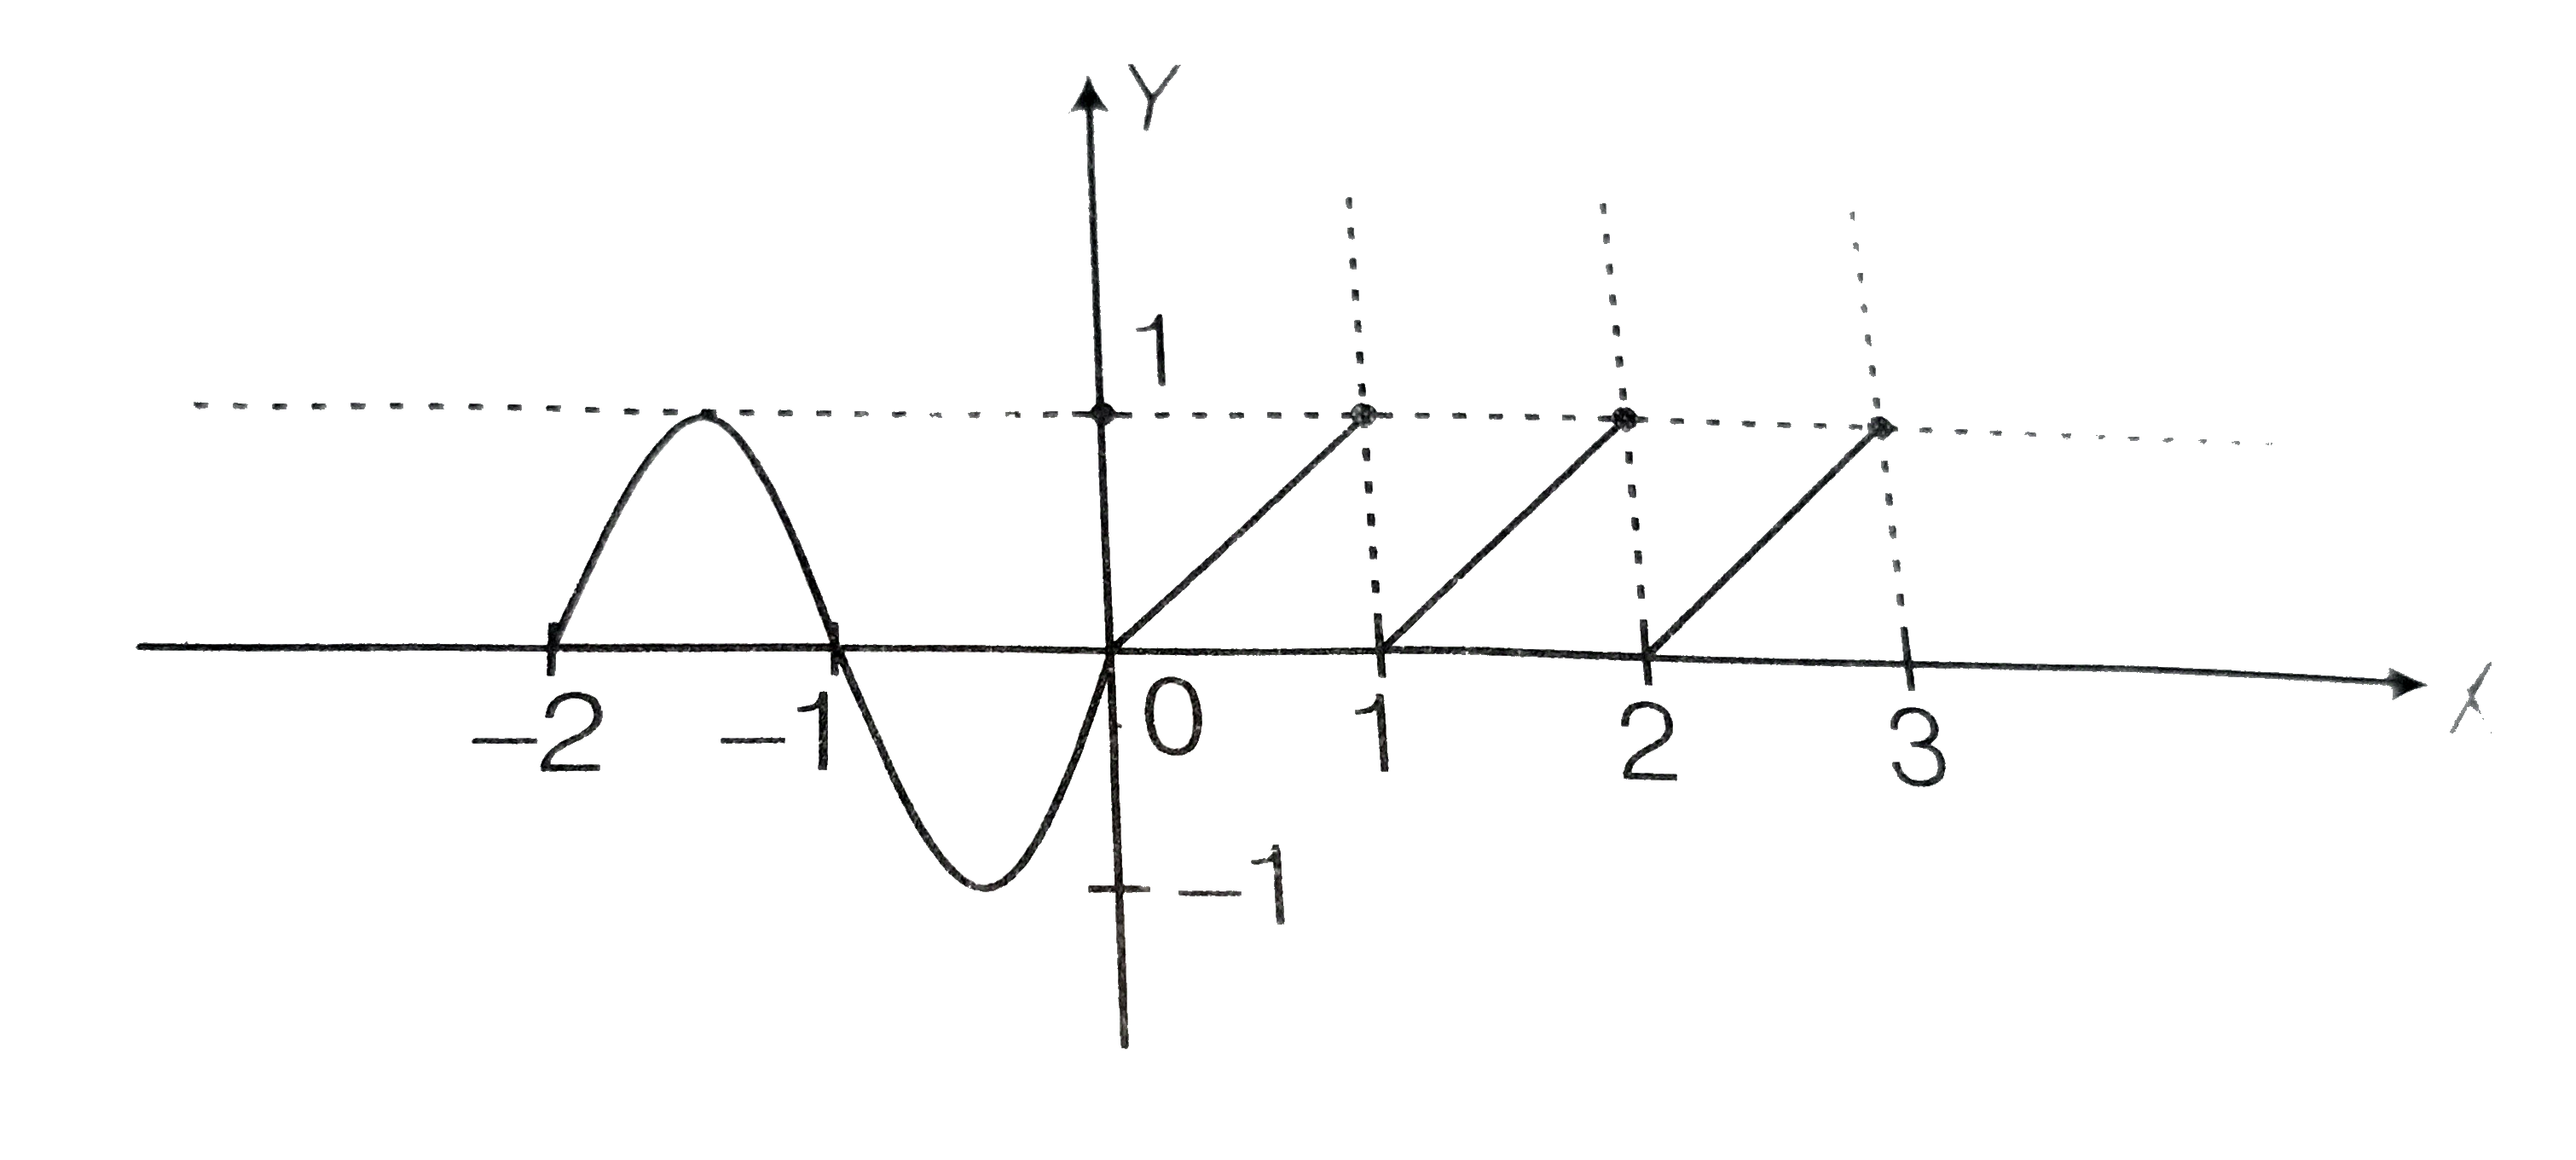
Draw the graph of f(−x)
View SolutionSundy the four graphs given below. Answer the follwing questions on the basis of these graphs.
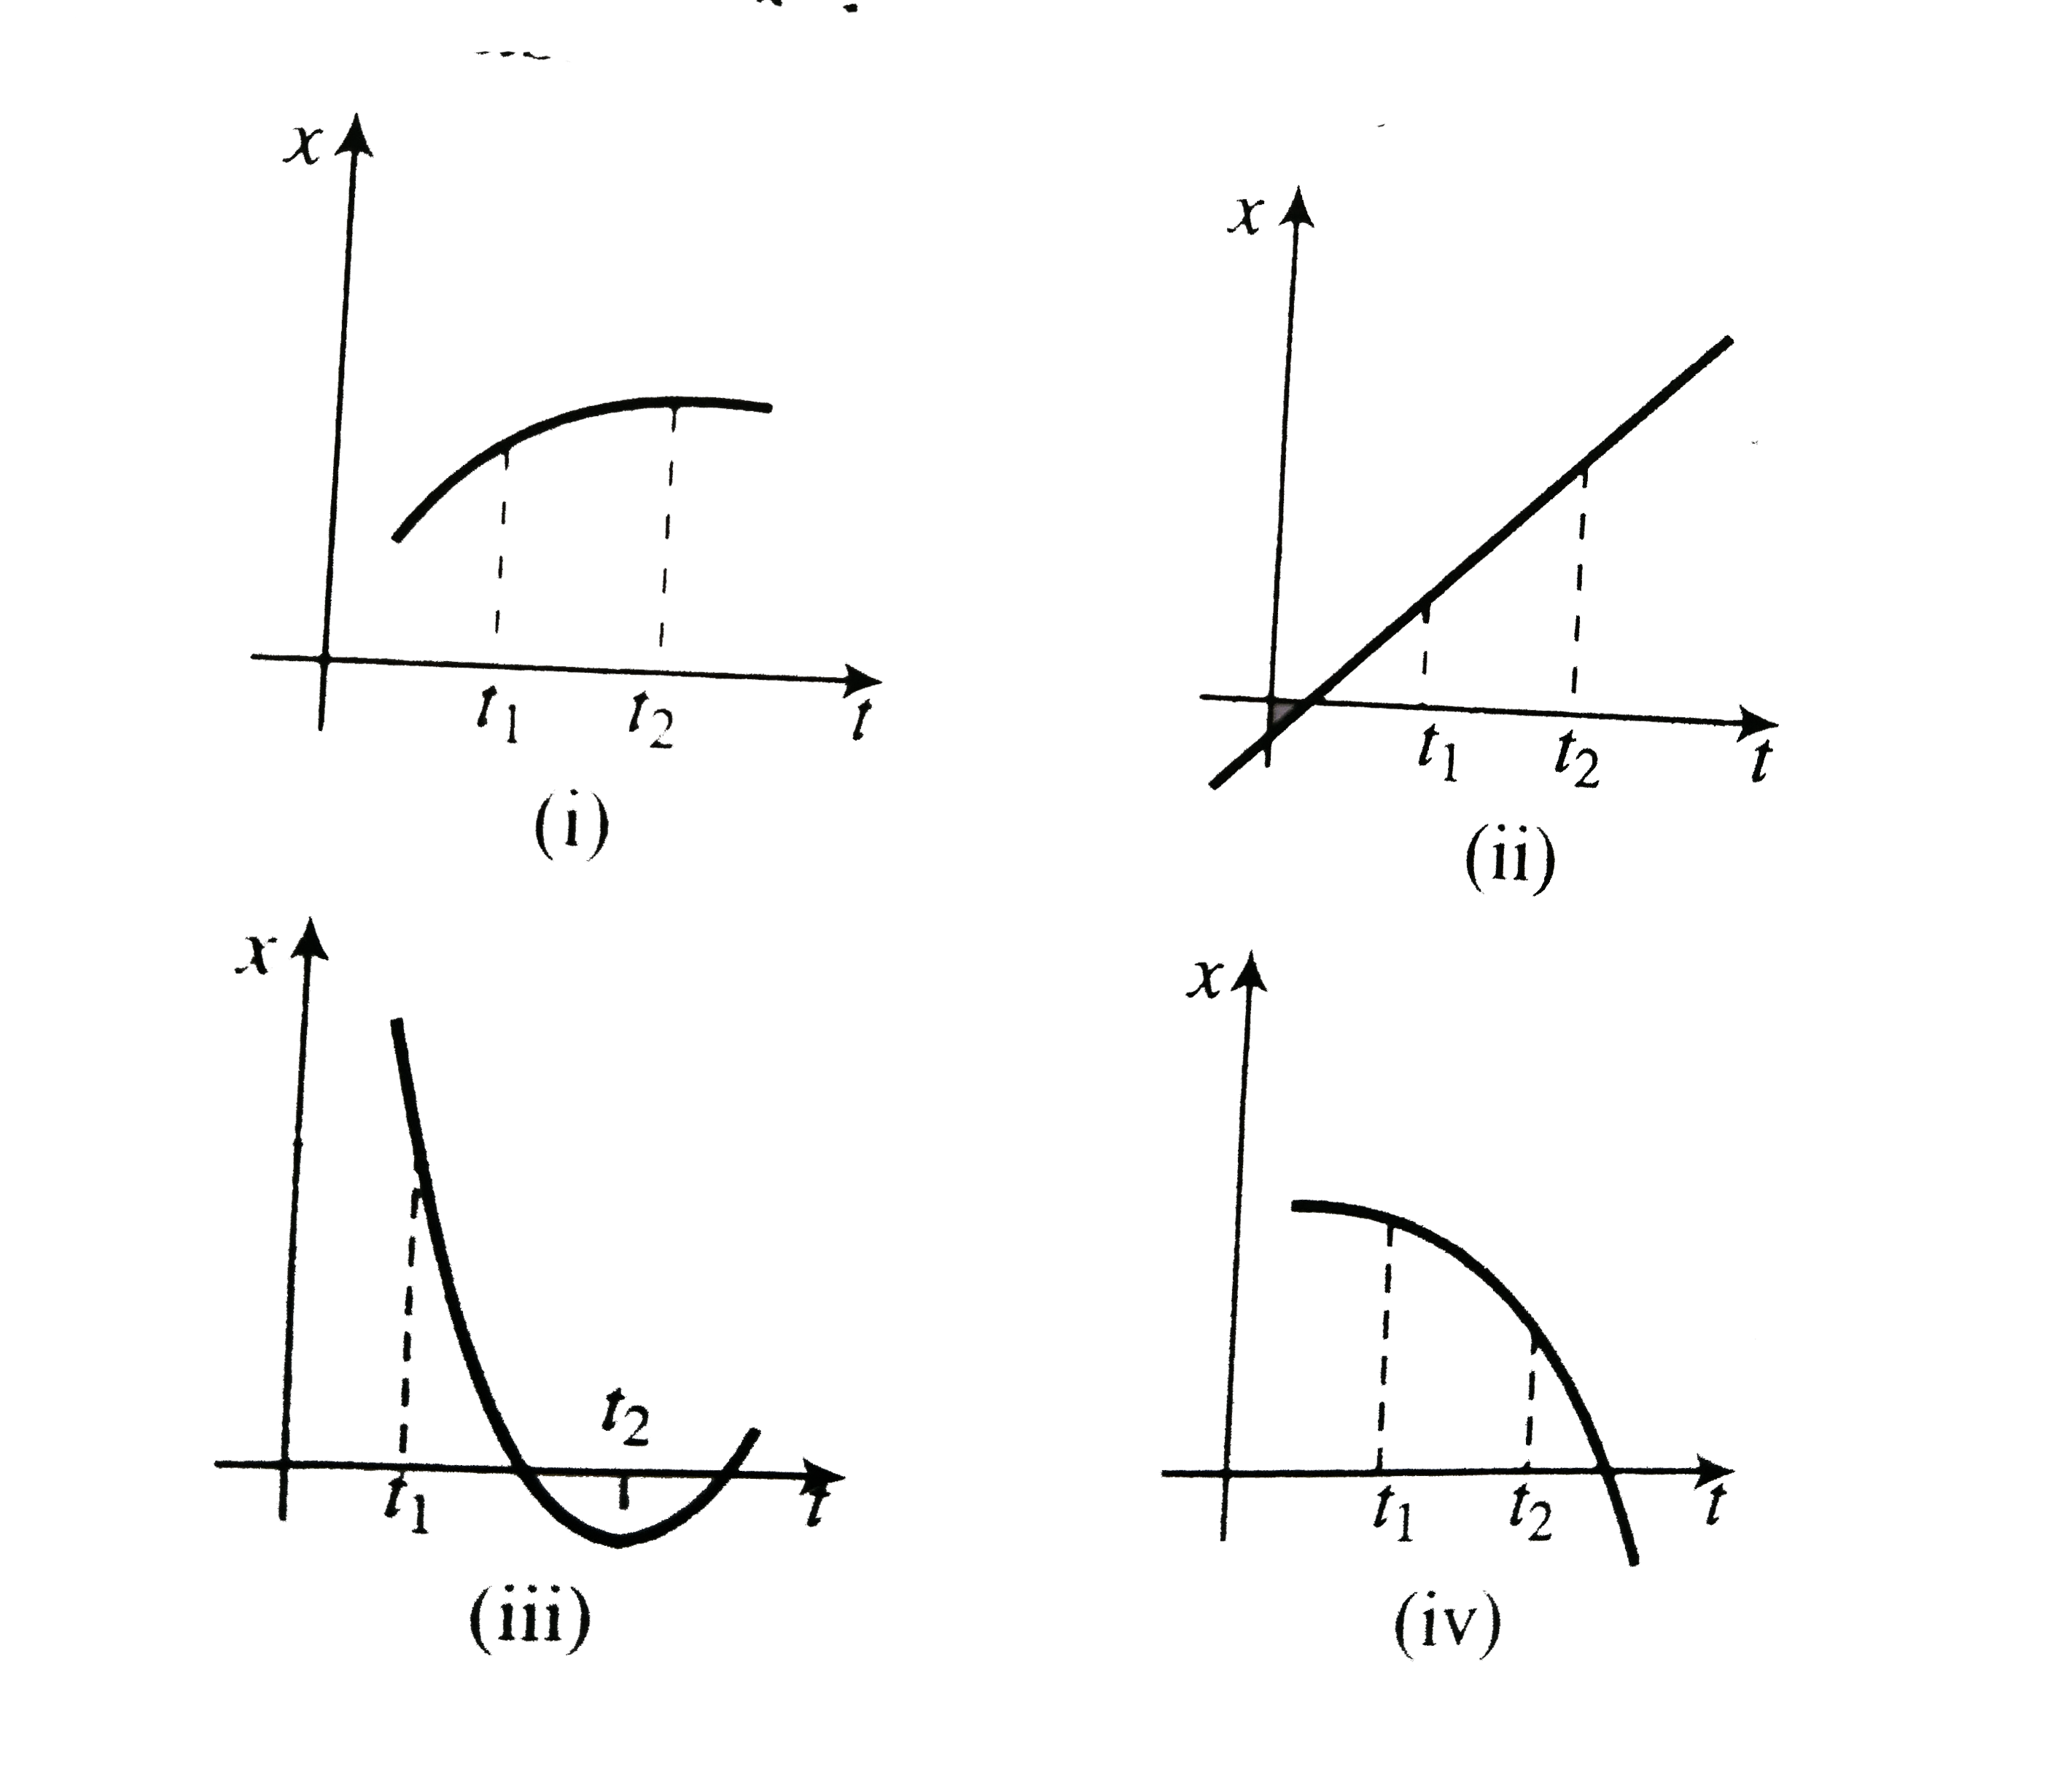
Acceleration of the particle is positive.
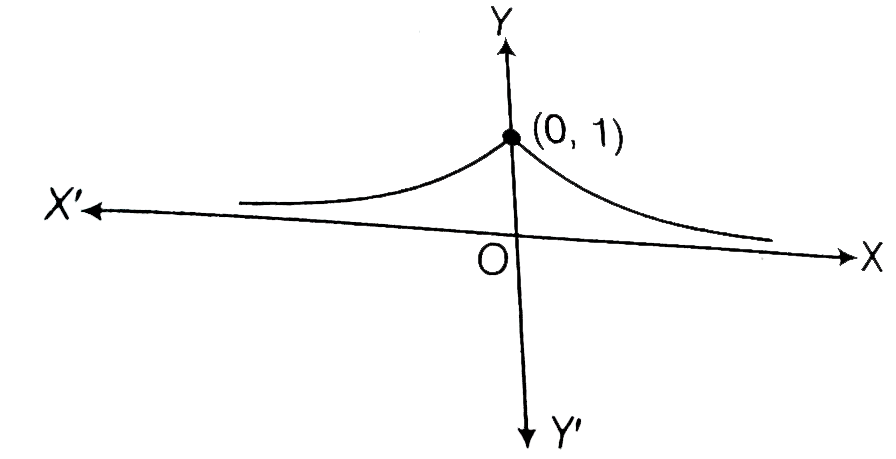
View SolutionWhich one of the following function best represents the graphs as shown below?
View SolutionConsider the following function f whose graph is given below.
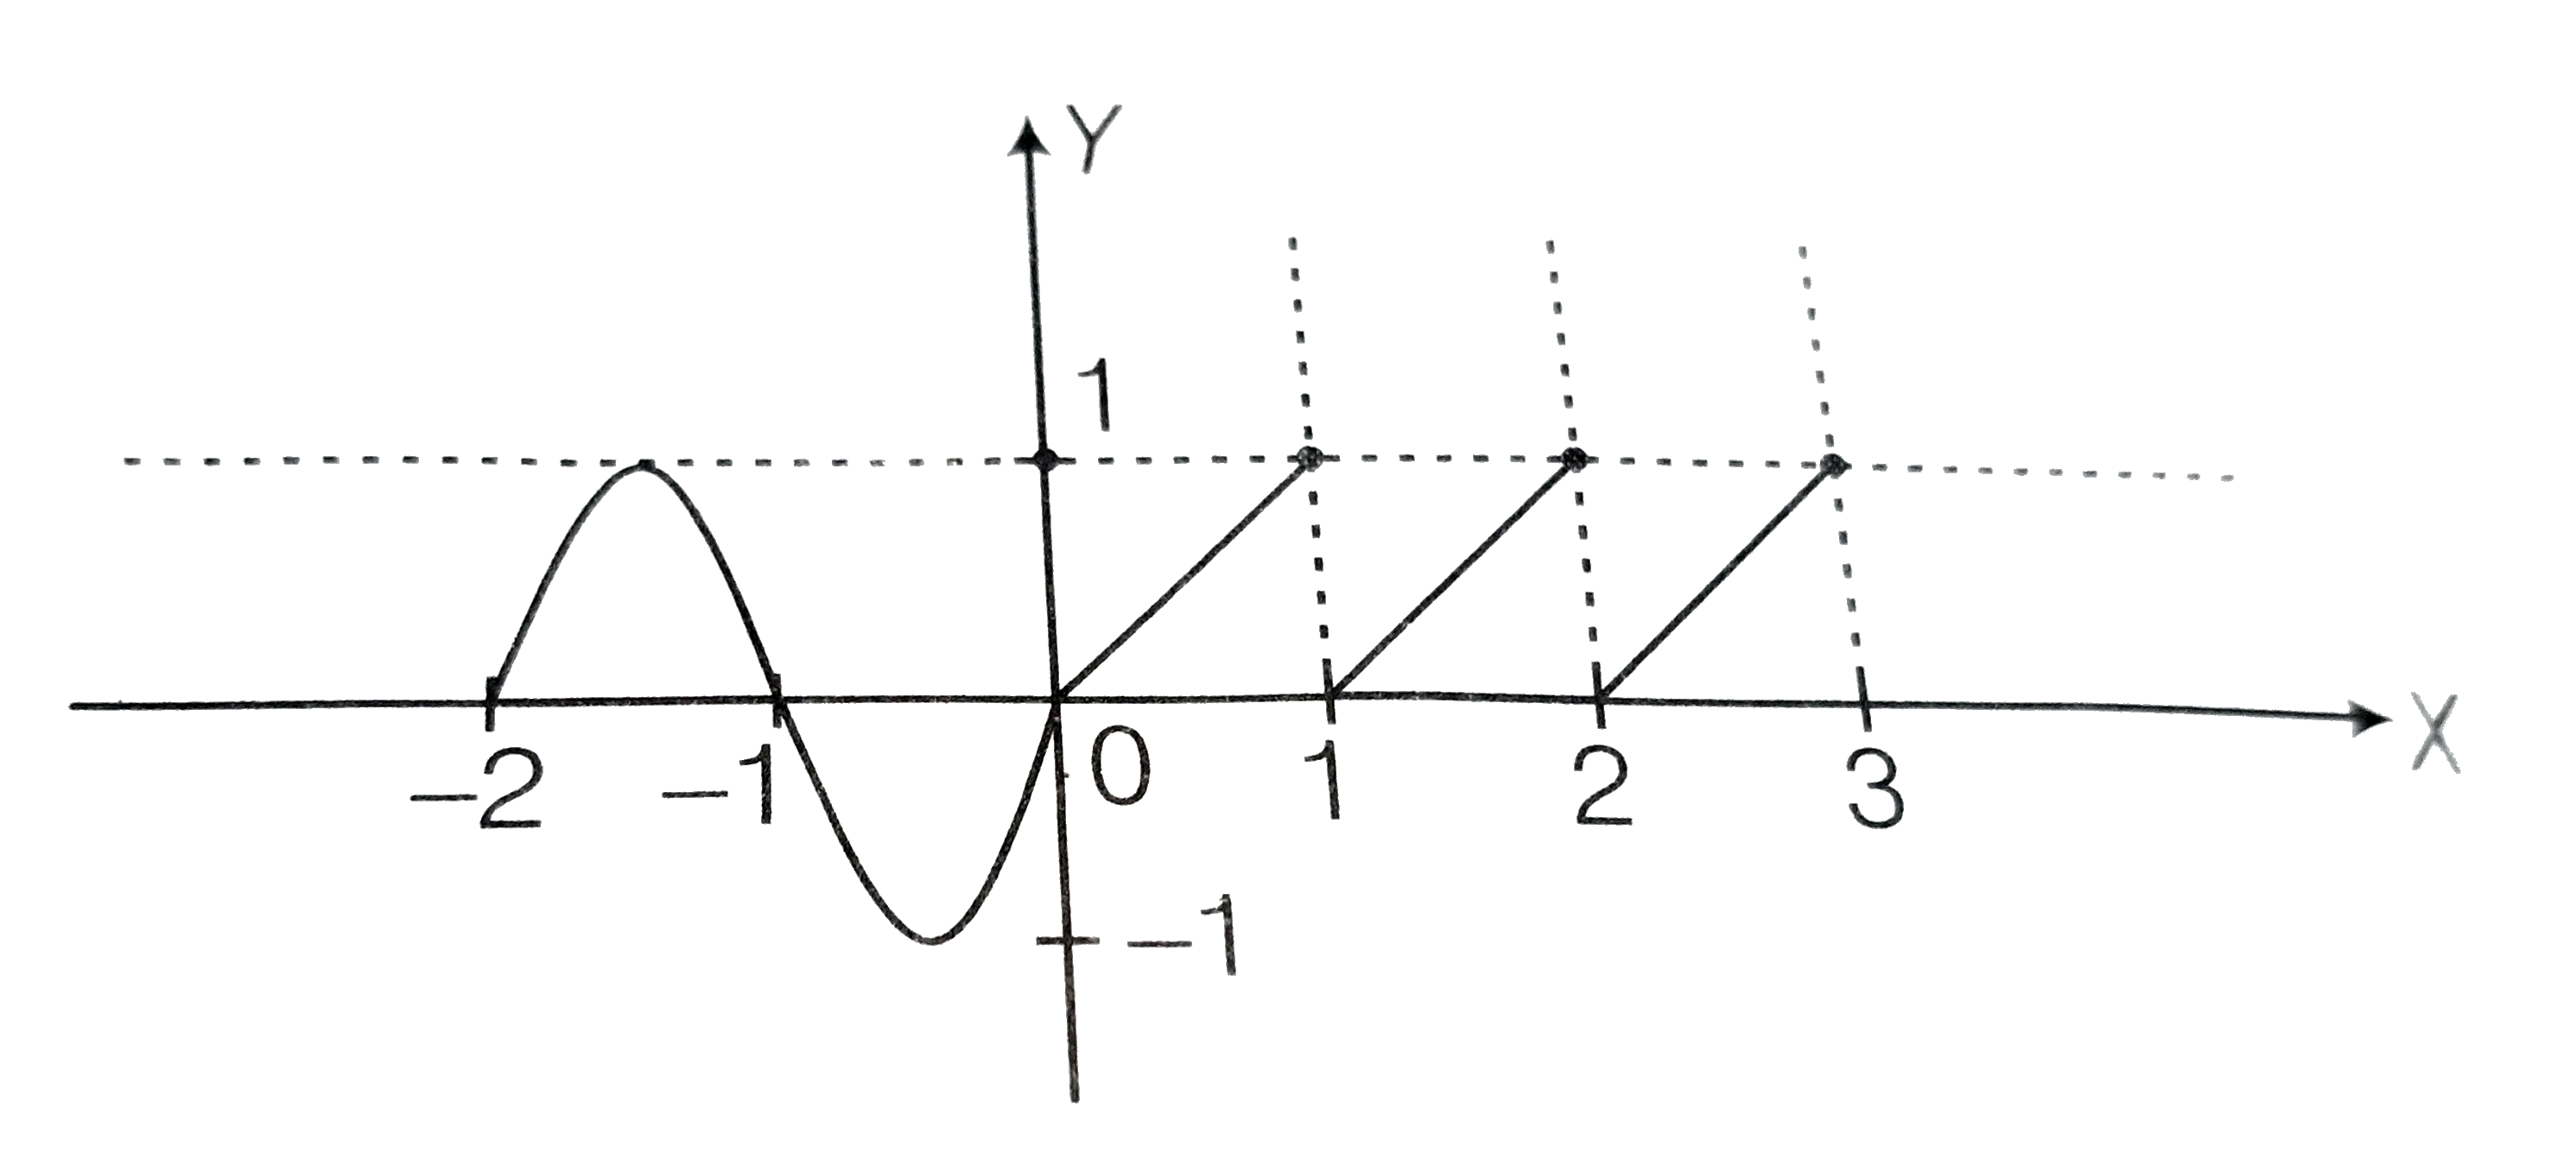
Draw the graph of [f(x)]
View SolutionIdentify P,Q, and R in the graph shown below

View Solution

