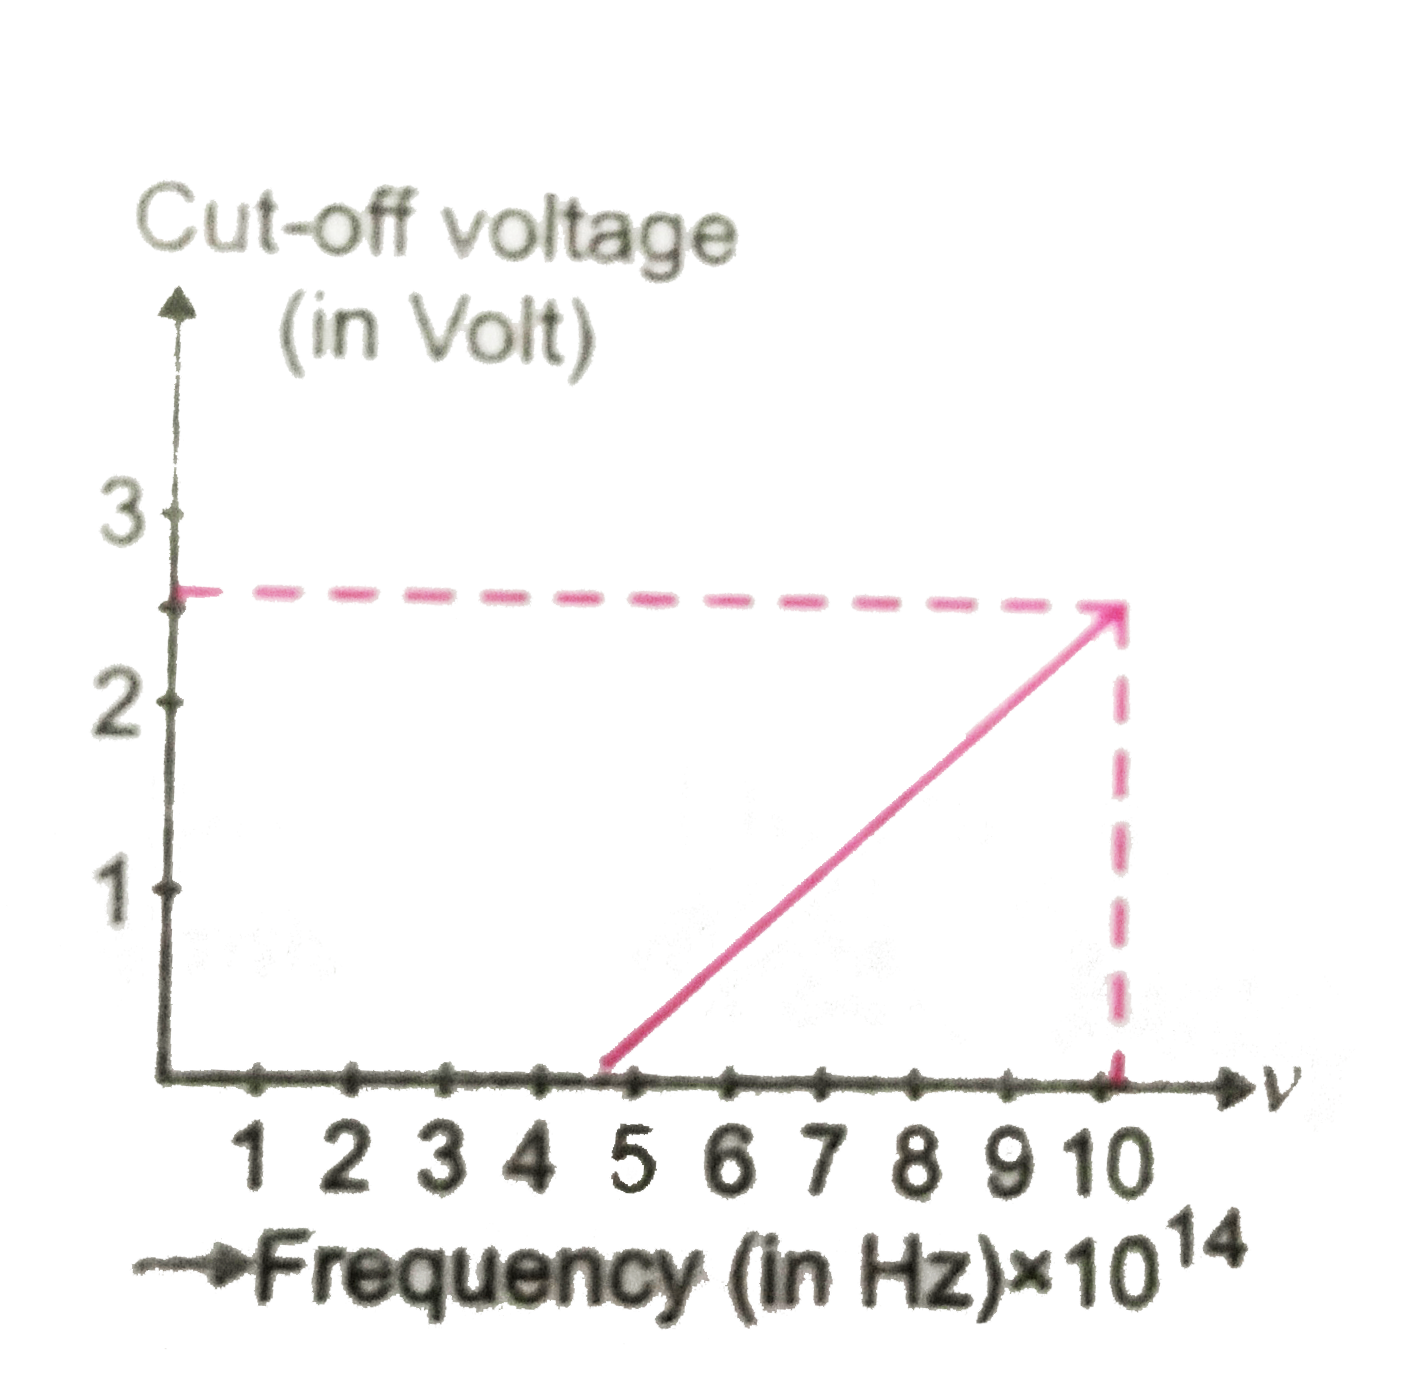
For photoelectronic effect in sodium, the figure shows the plot of cut-off voltage versus frequency of incident radiation. Calculate
threshold frequency
The threshold frequency is the frequency of incident light at which kinetic energy of ejected photoelectron is zero.
∴ From fig. threshold is zero.
v0=4.5×10¹⁴Hz
Similar Questions
For photoelectric effect in sodium, fig. shows the plot of cut-off voltage versus frequency of the incident radiation. Caclculate:

(i) the threshold frequency
(ii) the work function for sodium. (Use h=6.6×10⁻³⁴Js)
View SolutionIn an experiment on photoelectric effect, the slope of the cut-offf voltage versus frequency of incident light is found to be 4.12×10⁻¹⁵V s. calculate the value of Planck's constant.
View Solution
Knowledge Check
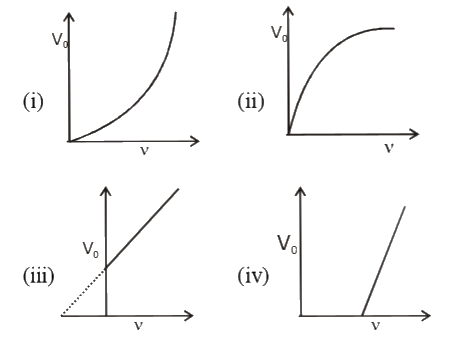
For a photoelectric cell, the graph shown the variation of cut off voltage (V0) with frequency (v) of incident light is
 A(i)B(ii)C(iii)D(iv)
In an experiment on the photoelectric effect , the slope of the cut - off voltage versus frequency of incident light is found to be 4.12×10⁻¹⁵V s . The value of Planck's constant is
A6.592×10−34 J sB6.592×10−31 J sC9.592×10−34 J sD6.592×10−30 J s
Find a relation between cut-off potential, frequency of the incident light and threshold frequency.
View SolutionThe de Broglie wavelenght (λ) associated with a photoelectron varies with the frequency (v) of the incident radiation as,[v0 is threshold frequency]:
View SolutionThe de Broglie wavelenght (λ) associated with a photoelectron varies with the frequency (v) of the incident radiation as,[v0 is threshold frequency]:
View SolutionThe de Broglie wavelenght (λ) associated with a photoelectron varies with the frequency (v) of the incident radiation as,[v0 is threshold frequency]:
View SolutionWhat is the photoelectric effect? With the help of suitable graph show the variation of photocurrent with (i) the intensity of incident radiation. (ii) the voltage applied between cathode and anode. (iii) the frequency of incident radiation.
View Solution(i) Plot a labelled graph of |Vs| where Vs is stopping potential versus frequency f of the incident radiation.
(ii) State how will you use this graph to determine the value of Planck.s constant.
View Solution
