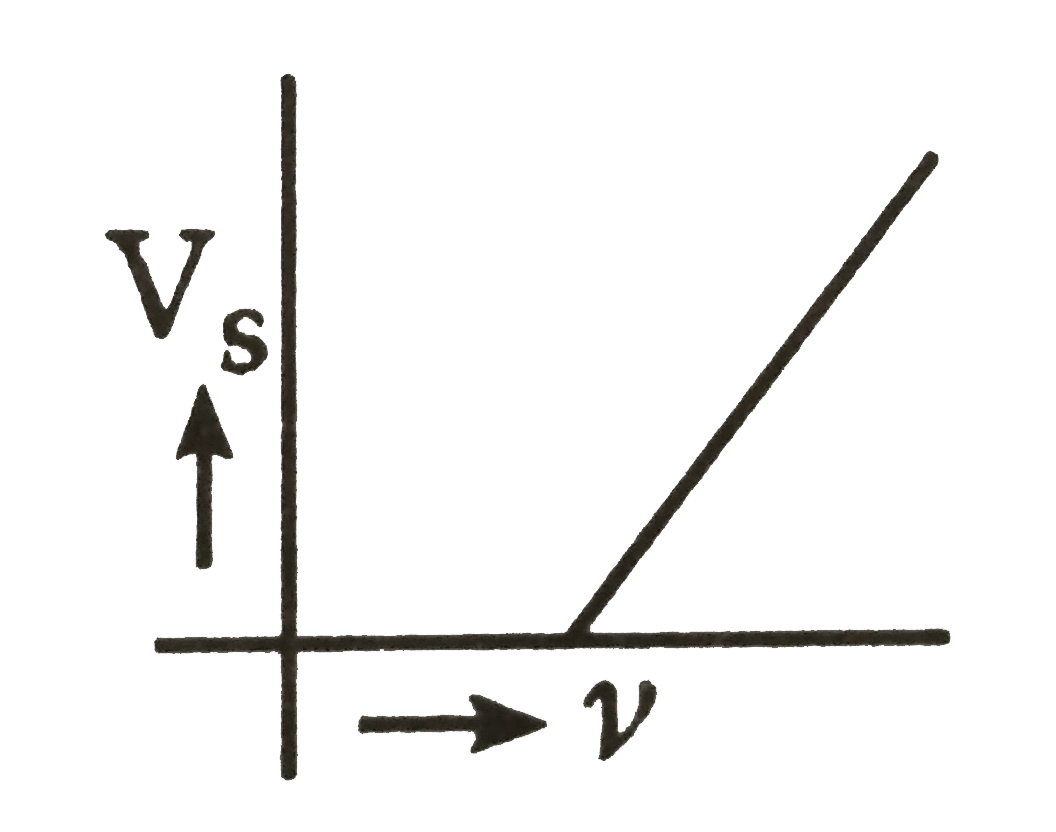
What is the photoelectric effect? With the help of suitable graph show the variation of photocurrent with (i) the intensity of incident radiation. (ii) the voltage applied between cathode and anode. (iii) the frequency of incident radiation.
Step-by-Step Solution:
Step 1: Define the Photoelectric Effect
The photoelectric effect is the phenomenon in which electrons are emitted from a material (usually a metal) when it is exposed to light (or electromagnetic radiation) of sufficient frequency. When photons strike the surface of the metal, they transfer their energy to the electrons, which can then escape from the surface if the energy of the photons is greater than the work function of the metal.
Step 2: Variation of Photocurrent with Intensity of Incident Radiation
- Explanation: The photocurrent is directly proportional to the intensity of the incident radiation. As the intensity increases, more photons strike the surface of the metal, leading to the emission of more photoelectrons and thus a higher photocurrent.
- Graph: The graph will show photocurrent on the y-axis and intensity on the x-axis. It will be a straight line starting from the origin, indicating that as intensity increases, photocurrent increases linearly.
Step 3: Variation of Photocurrent with Voltage Applied Between Cathode and Anode
- Explanation: The photocurrent also depends on the voltage applied between the cathode and anode. Initially, as the voltage increases, the photocurrent increases because more emitted electrons reach the anode. However, after a certain voltage (the saturation voltage), the photocurrent becomes constant because all emitted electrons are collected.
- Graph: The graph will have photocurrent on the y-axis and voltage on the x-axis. It will show an initial linear increase followed by a plateau, indicating saturation.
Step 4: Variation of Photocurrent with Frequency of Incident Radiation
- Explanation: The photocurrent is dependent on the frequency of the incident radiation. If the frequency is below a certain threshold (the threshold frequency), no photoelectrons are emitted regardless of intensity. Above this frequency, the photocurrent increases with frequency but will eventually saturate as the number of emitted electrons reaches a maximum.
- Graph: The graph will show photocurrent on the y-axis and frequency on the x-axis. It will start at zero for frequencies below the threshold and will increase sharply above the threshold frequency.
Summary of Graphs:
1. Photocurrent vs. Intensity: Linear increase.
2. Photocurrent vs. Voltage: Initial linear increase followed by saturation.
3. Photocurrent vs. Frequency: Starts at zero and increases after the threshold frequency.
The photoelectric effect is the phenomenon in which electrons are emitted from a material (usually a metal) when it is exposed to light (or electromagnetic radiation) of sufficient frequency. When photons strike the surface of the metal, they transfer their energy to the electrons, which can then escape from the surface if the energy of the photons is greater than the work function of the metal.
- Explanation: The photocurrent is directly proportional to the intensity of the incident radiation. As the intensity increases, more photons strike the surface of the metal, leading to the emission of more photoelectrons and thus a higher photocurrent.
- Graph: The graph will show photocurrent on the y-axis and intensity on the x-axis. It will be a straight line starting from the origin, indicating that as intensity increases, photocurrent increases linearly.
- Explanation: The photocurrent also depends on the voltage applied between the cathode and anode. Initially, as the voltage increases, the photocurrent increases because more emitted electrons reach the anode. However, after a certain voltage (the saturation voltage), the photocurrent becomes constant because all emitted electrons are collected.
- Graph: The graph will have photocurrent on the y-axis and voltage on the x-axis. It will show an initial linear increase followed by a plateau, indicating saturation.
- Explanation: The photocurrent is dependent on the frequency of the incident radiation. If the frequency is below a certain threshold (the threshold frequency), no photoelectrons are emitted regardless of intensity. Above this frequency, the photocurrent increases with frequency but will eventually saturate as the number of emitted electrons reaches a maximum.
- Graph: The graph will show photocurrent on the y-axis and frequency on the x-axis. It will start at zero for frequencies below the threshold and will increase sharply above the threshold frequency.
1. Photocurrent vs. Intensity: Linear increase.
2. Photocurrent vs. Voltage: Initial linear increase followed by saturation.
3. Photocurrent vs. Frequency: Starts at zero and increases after the threshold frequency.
Similar Questions
Knowledge Check
- Question 1 - Select One
According to Einstein's photoelectric equation , the graph between the kinetic energy of photoelectrons ejected and the frequency of incident radiation is
A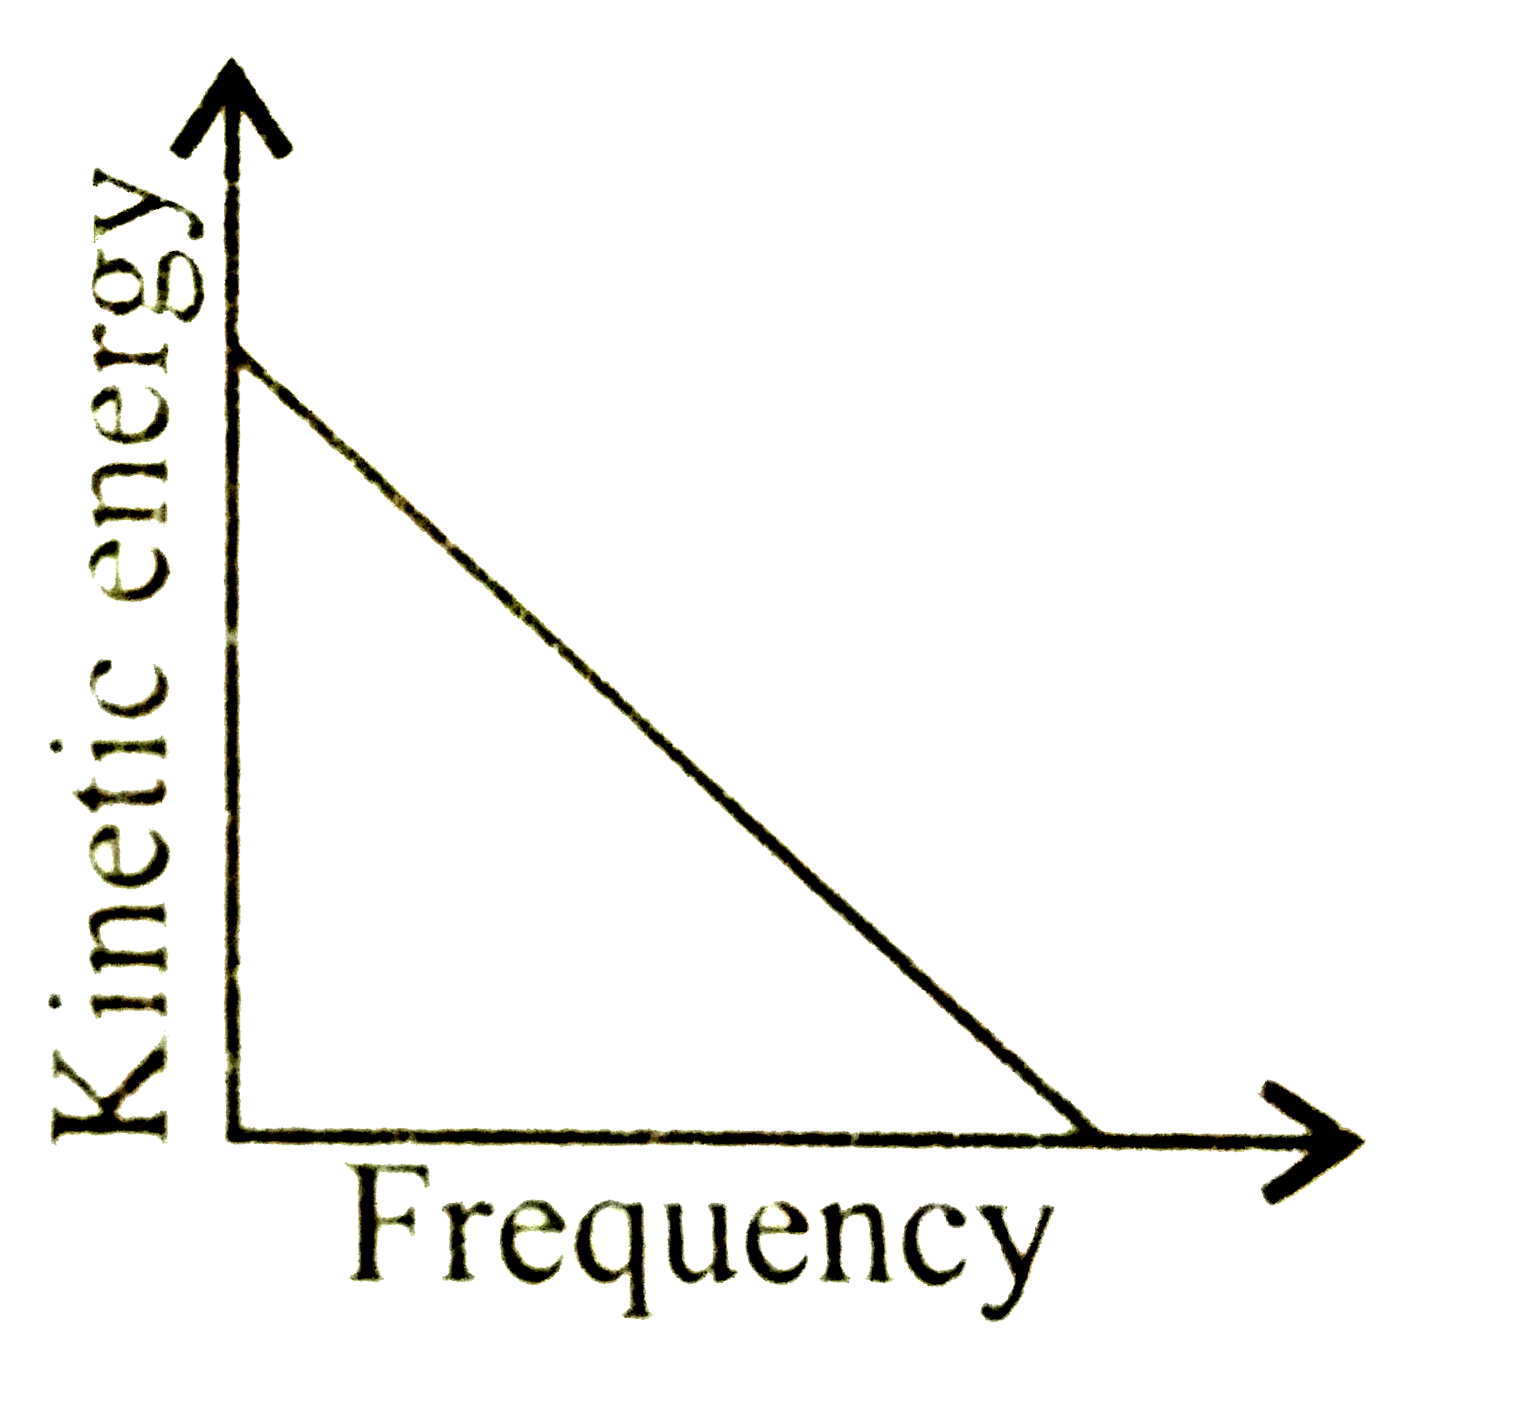 B
B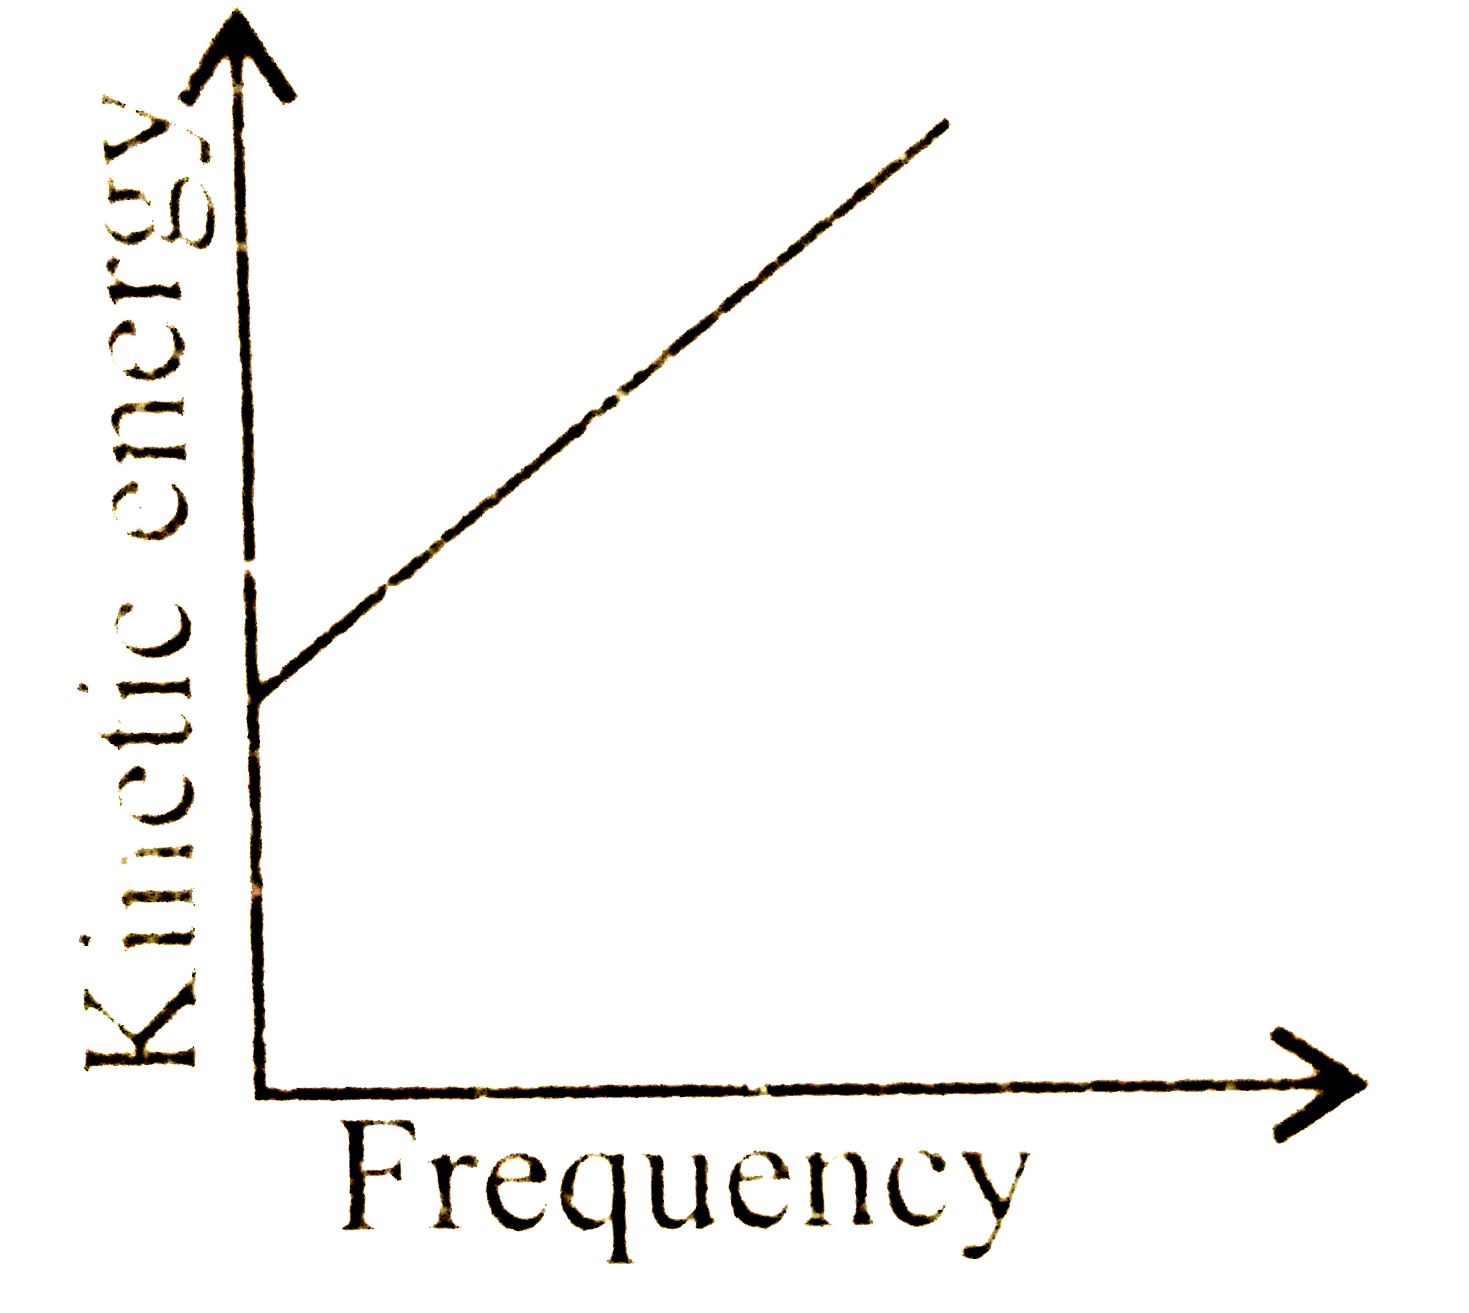 C
C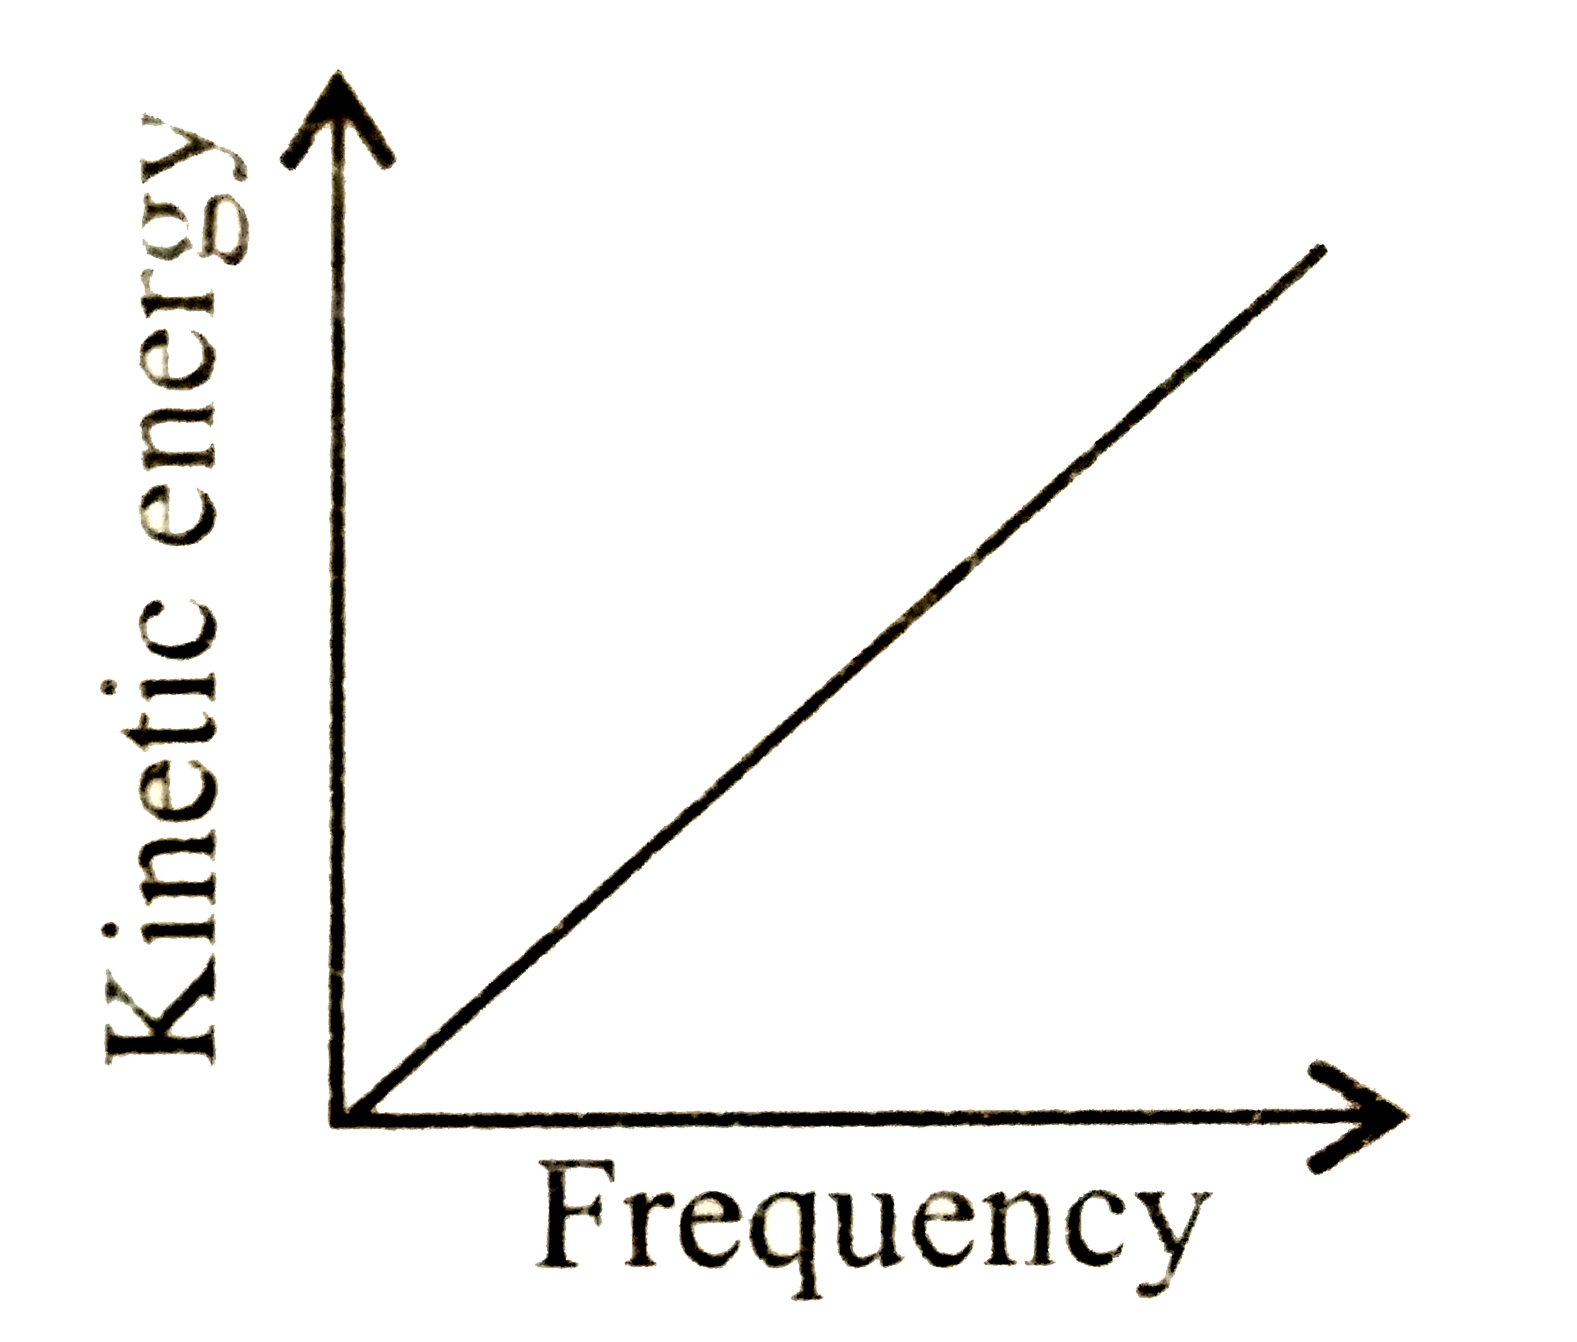 D
D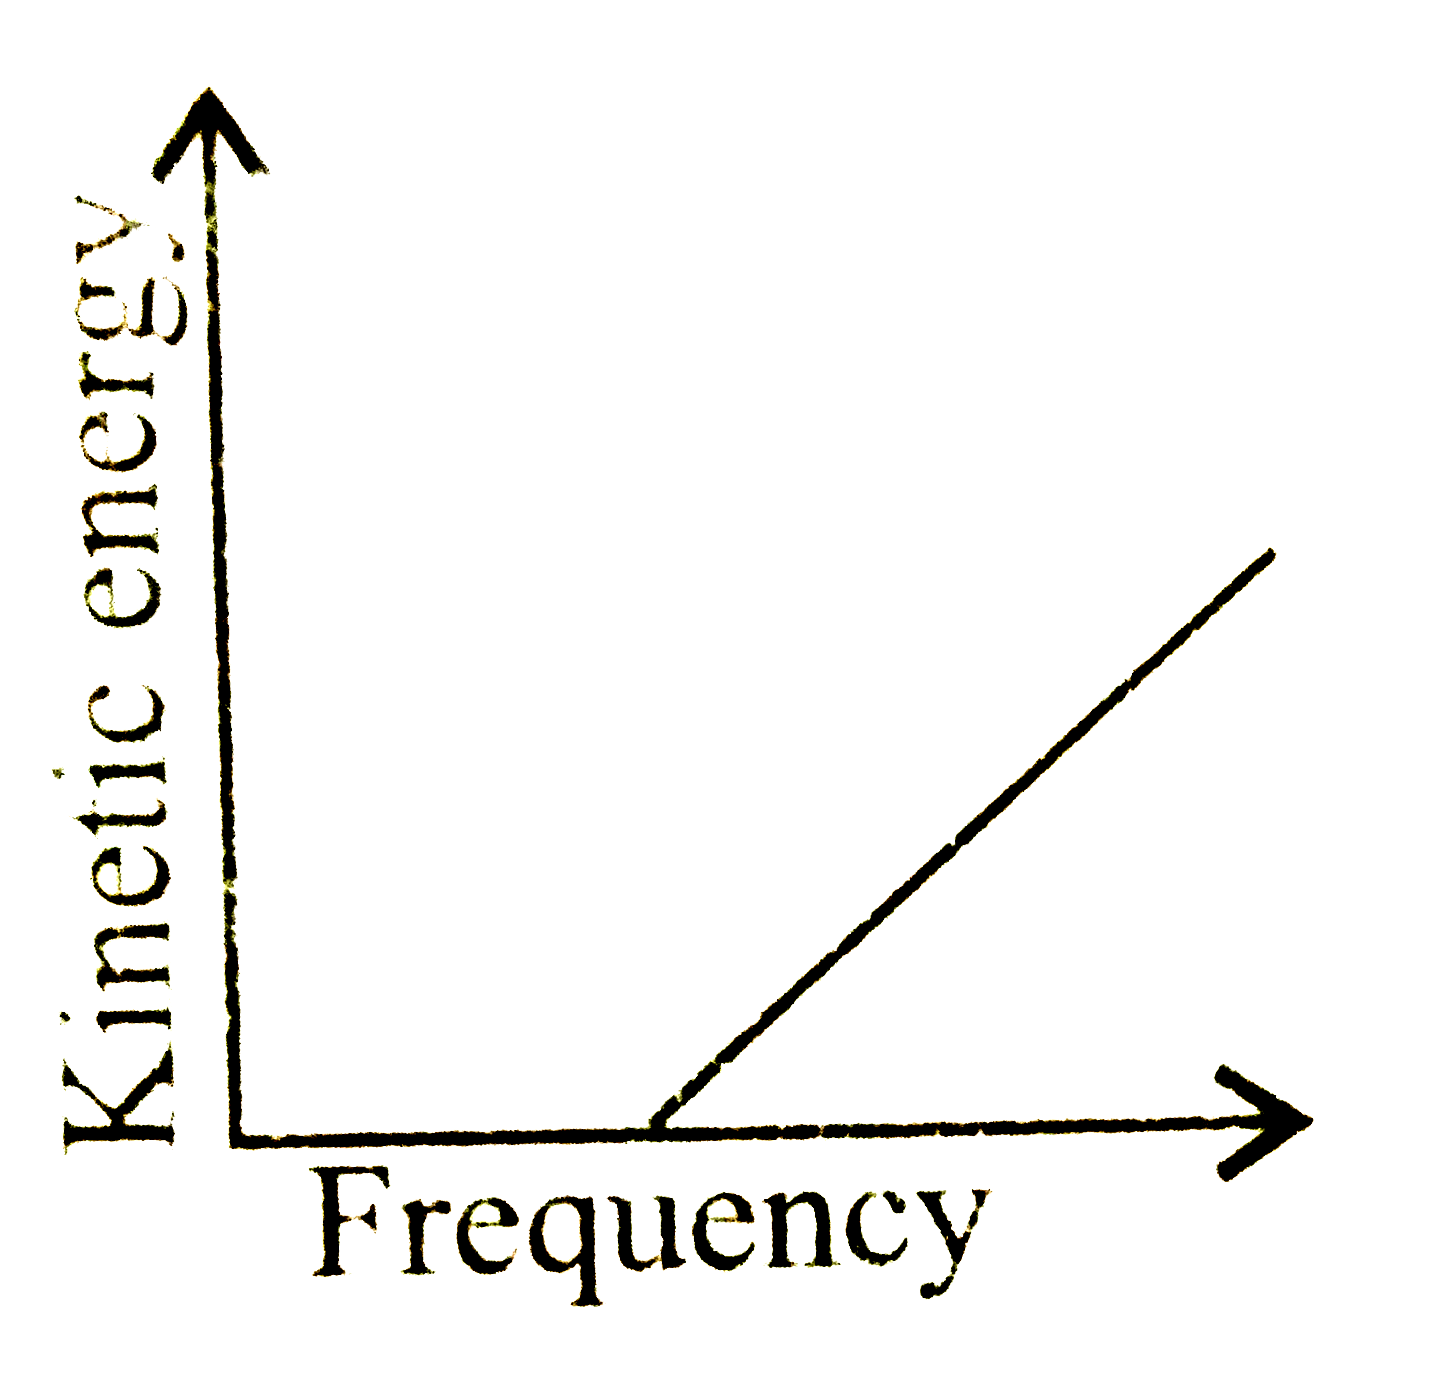
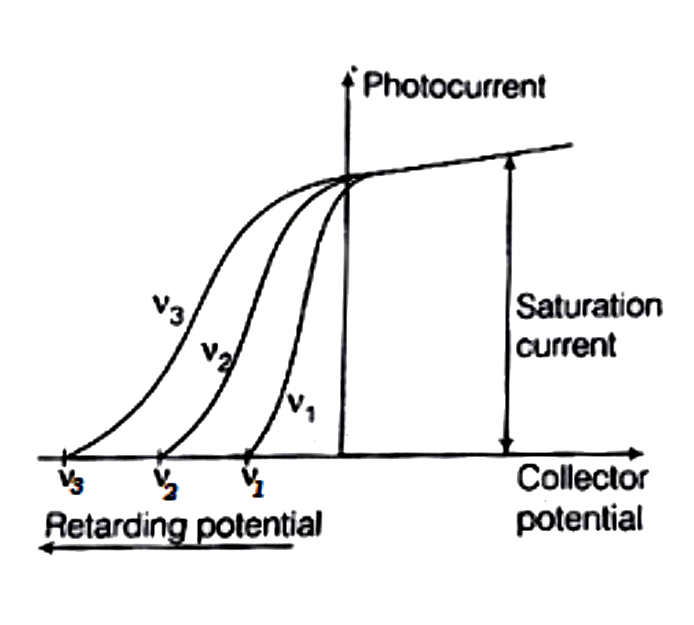
The variation of photocurrent with collector potential for different frequencies of incident radiation v1,v2,v3 is as shown in the the graph , then
 View Solution
For a photoelectric cell the graph showing the variation of cut of voltage (V0) with frequency (v) of incident light is best represented by
 View Solution
According to Einstein's photoelectric equation, the graph between kinetic energy of photoelectrons ejected and the frequency of the incident radiation is :
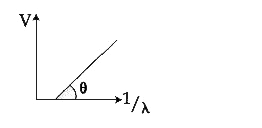
View SolutionIn a photoelectric effect experiment, the graph of stopping potential V versus reciprocal of wavelength obtained is shown in the figure. As the intensity of incident radiation is increased :
 View Solution
Explain giving reasons for the following :
(a) Photoelectric current in a photocell increases with the increase in intensity of the incident radiation.
(b) The stopping potential V0 varies linearly with the frequency ν of the incident radiation for a given photosensitive surface with the slope remaining the same for different surfaces.
(c) Maximum kinetic energy of the photoelectrons is independent of the intensity of incident radiation.View SolutionDarw graphs showing variation of photoelctric current with applied voltage for two incident radiations of equal frequecny and different intensities. Mark the graph for the radiaiton of higher intensity.
View SolutionWhat is the effect on the maximum kinetic energy and the numver of photoelectrons when (i) The intensity of incident light decreases. (ii) The emitting surcac is charged. (iii) Wavelength of incident light increase.
View Solution

