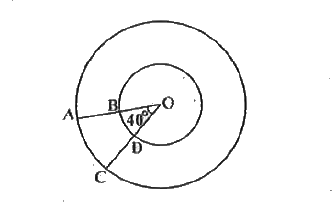
Find the area of the shaded region in Fig., if radii of the two conecntric circles with centrre O are 7 cm and 14 cm respectively and ∠AOC=40∘.
 Solution in Kannada
Step by step video & image solution for Find the area of the shaded region in Fig., if radii of the two conecntric circles with centrre O are 7 cm and 14 cm respectively and angleAOC=40^(@). by Maths experts to help you in doubts & scoring excellent marks in Class 10 exams.
Updated on:21/07/2023Topper's Solved these Questions
- AREAS RELATED TO CIRCLESBOOK - SUBHASH PUBLICATIONCHAPTER - AREAS RELATED TO CIRCLESEXERCISE - EXERCISE 5.2
19 Videos
- ANNUAL EXAMINATION QUESTION PAPER JUNE-2019 (WITH ANSWERS)BOOK - SUBHASH PUBLICATIONCHAPTER - ANNUAL EXAMINATION QUESTION PAPER JUNE-2019 (WITH ANSWERS)EXERCISE - EXERCISE
35 Videos
- ARITHMETIC PROGRESSIONBOOK - SUBHASH PUBLICATIONCHAPTER - ARITHMETIC PROGRESSIONEXERCISE - Exericise 1.3
31 Videos
Similar Questions
Find the area of a sector of a circle with radius 6 cm if angle of the sector is 60∘. use π=227
View SolutionWrite the formula to find the sum of first n terms of an Arithmetic progression, whose first term is a and the last term is an.
View SolutionFind the sum of the following APs :
2,7,12,…to 10th terms.
View SolutionDetermine the point of symmetry of a regular hexagon.
View SolutionFind the area of the shaded region, given that the radius of each circle is equal to 5 cm.
View SolutionMatch the following Column A to Column B

View SolutionMatch the following Column A to Column B

View SolutionMatch the following Column A to Column B

View SolutionFind the area of figure given below.

View SolutionFind the area of the figure given below.

View SolutionThe area of the shaded part in the figure given below is ______.

View Solution
Find the area of the shaded part in the figure given above.
View SolutionThe inequation represented by the graph given below is :
View SolutionThe inequation that best describes the graph given below is _________
View SolutionThe inequation that best describes the following graph is _________
View SolutionWhich inequations represent the shaded region in the given figure
View Solution
