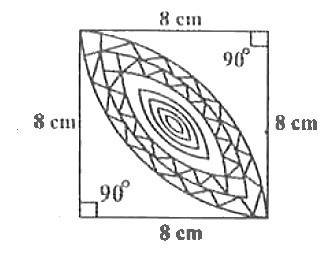
Calculate the area of the designed region in Fig. 5.34 common between the two quadrants of circle of radius 8 cm each.
 Solution in Kannada
Step by step video & image solution for Calculate the area of the designed region in Fig. 5.34 common between the two quadrants of circle of radius 8 cm each. by Maths experts to help you in doubts & scoring excellent marks in Class 10 exams.
Updated on:21/07/2023Topper's Solved these Questions
- AREAS RELATED TO CIRCLESBOOK - SUBHASH PUBLICATIONCHAPTER - AREAS RELATED TO CIRCLESEXERCISE - EXERCISE 5.2
19 Videos
- ANNUAL EXAMINATION QUESTION PAPER JUNE-2019 (WITH ANSWERS)BOOK - SUBHASH PUBLICATIONCHAPTER - ANNUAL EXAMINATION QUESTION PAPER JUNE-2019 (WITH ANSWERS)EXERCISE - EXERCISE
35 Videos
- ARITHMETIC PROGRESSIONBOOK - SUBHASH PUBLICATIONCHAPTER - ARITHMETIC PROGRESSIONEXERCISE - Exericise 1.3
31 Videos
Similar Questions
Find the area of a sector of a circle with radius 6 cm if angle of the sector is 60∘. use π=227
View SolutionWrite the formula to find the sum of first n terms of an Arithmetic progression, whose first term is a and the last term is an.
View SolutionFind the sum of the following APs :
2,7,12,…to 10th terms.
View SolutionDetermine the point of symmetry of a regular hexagon.
View SolutionFind the area of the shaded region, given that the radius of each circle is equal to 5 cm.
View SolutionMatch the following Column A to Column B

View SolutionMatch the following Column A to Column B

View SolutionMatch the following Column A to Column B

View SolutionFind the area of figure given below.

View SolutionFind the area of the figure given below.

View SolutionCalculate the volume of the given solid.
ltimg src="https://d10lpgp6xz60nq.cloudfront.net/physics_images/PS_MATH_VII_C06_E03_002_Q01.png" width="80%"gt
View SolutionThe area of the shaded part in the figure given below is ______.

View SolutionThe inequation represented by the graph given below is :
View SolutionThe inequation that best describes the graph given below is _________
View SolutionThe inequation that best describes the following graph is _________
View Solution
