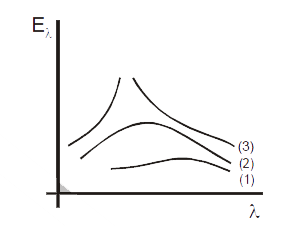
Three graphs marked as 1,2,3 representing the variation of maximum emissive power and wavelength of radiation of the sun, a welding arc and a tungsten filament. Which of the following combination is correct
1−bulb.2→welding arc,3→sun
2−bulb.3→welding arc,1→sun
3−bulb.1→welding arc,2→sun
2−bulb.1→welding arc,3→sun
Step by step video & image solution for Three graphs marked as 1,2,3 representing the variation of maximum emissive power and wavelength of radiation of the sun, a welding arc and a tungsten filament. Which of the following combination is correct by Physics experts to help you in doubts & scoring excellent marks in Class 12 exams.
Updated on:21/07/2023Topper's Solved these Questions
- HEAT - 1BOOK - MOTIONCHAPTER - HEAT - 1EXERCISE - EXERCISE -4 (Level - I) Previous Year | JEE Main
10 Videos
- GRAVITATIONBOOK - MOTIONCHAPTER - GRAVITATIONEXERCISE - Exercise - 4 Section - B Previous Years Problems
15 Videos
- HEAT TRANSFER & THERMAL EXPANSION BOOK - MOTIONCHAPTER - HEAT TRANSFER & THERMAL EXPANSION EXERCISE - Exercise - 3 Section-B
19 Videos
Similar Questions
Knowledge Check
Variation of radiant energy emitted by sun, filament of tungsten lamp and welding arc as a function of its wavelength is shown in figure. Which of the following option is the correct match?
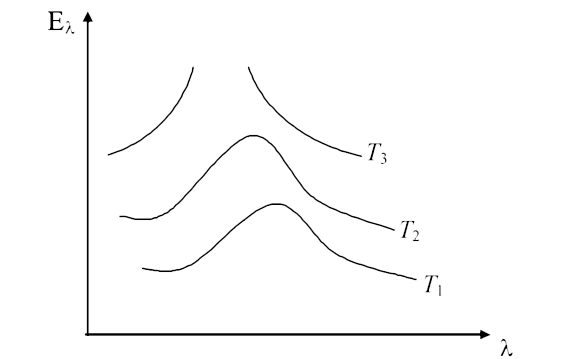 ASun−T3,tungstenfilament−T1,weld∈garc−T2BSun−T2,tungstenfilament−T1,weld∈garc−T3CSun−T3,tungstenfilament−T2,weld∈garc−T1DSun−T1,tungstenfilament−T2,weld∈garc−T3
The given graph represents V-1 characteristic for a semiconductor device.
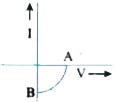
Which of the following statement is correct?AIt is V-1 characteristic for solar cell where point A represents open circuit voltage and point B short circuit currentBIt is for a solar cell and points A and B represent open circuit voltage and current, respectivelyCIt is for a photodiode and points A and B represent open circuit voltage and current, respectivelyDIt is for an LED and points A and B represents open circuit voltage and short circuit currrent respectivelyWhich of the following graph represent the variation of particle momentum and associated de Broglie wavelength?
A B
B C
C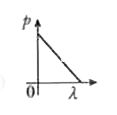 D
D
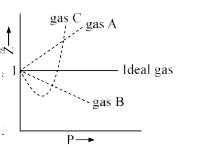
The given graph represents the variations of compressibility factor Z=pv/nRT vs P for three real gases Which of the following statements is wrong?
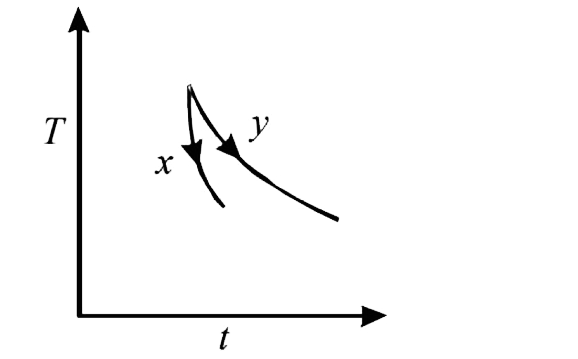
View SolutionThe graph, shown in the adjacent diagram, represents the variation of temperature (T) of two bodies, x and y having same surface area, with time (t) due to the emission of radiation. Find the correct relation between the emissivity and absorptivity power of the two bodies
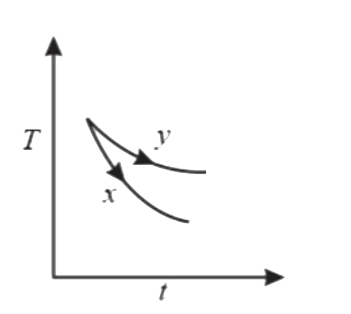
View SolutionThe graph shown in the adjacement diagram represents the variation of temperature (T) of two bodies x and y having the same surface area, with time (t). Both of these bodies lose heat only due to the emission of radiation. Find the correct relation between the emissive and absorptive power of the two bodies.
View SolutionWhich of the following graphs correctly represents the variation of particle momentum with associated de Broglie wavelength?
View SolutionAn incandescent bulb has a thin filament of tungsten that is heated to high temperature by passing an electric current. The hot filament emits black - body radiation. The filament is observed to break up at random to break up at random locations after a sufficiently long time of operation due to non-uniform evaporation of tungsten from the fialment. If the bulb is powered at constant voltage, which of the following statement (s) is (are) true?
View Solution

