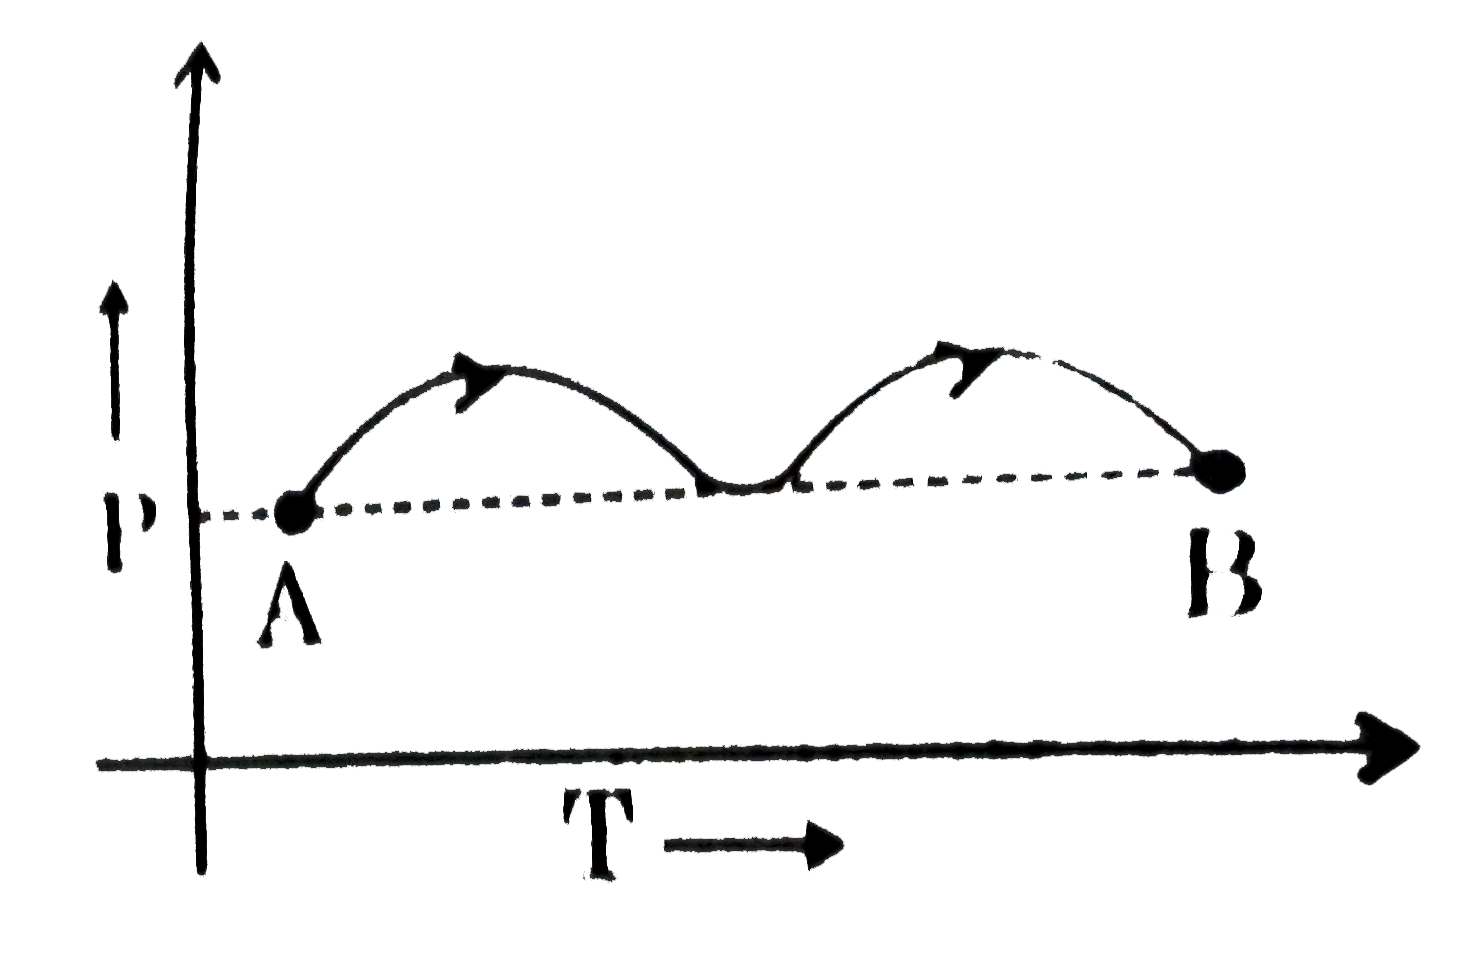
The P-T graph, as given below, was observed for a process on an ideal gas. Which of the statement is true ?
The correct Answer is:C
Step by step video & image solution for The P-T graph, as given below, was observed for a process on an ideal gas. Which of the statement is true ? by Chemistry experts to help you in doubts & scoring excellent marks in Class 12 exams.
Updated on:21/07/2023Topper's Solved these Questions
Similar Questions
Knowledge Check
The P-T graph, as given below, was observed for a process on an ideal gas. Which of the statement is true ?
 Aw=+ve,ΔH=+veBw=−ve,ΔH=−veCw=−ve,ΔH=+veDw=+ve,ΔH=−ve
The graph given below shows the P-V plot for a process on an ideal gas. Select the correct statement.
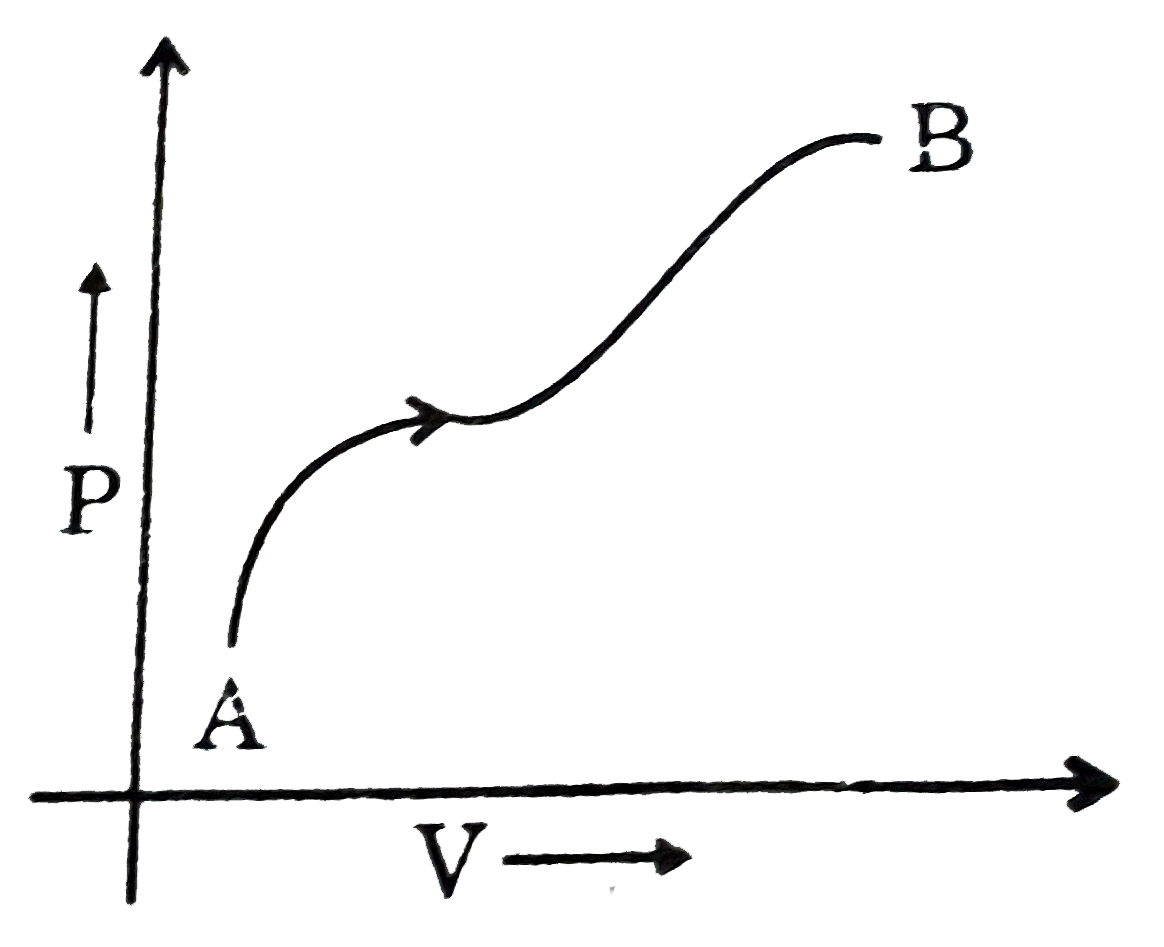 AEnthalpy content of the gas is constantly increasing and the process is carried out slowlyBEnthalpy content of the gas first increases then decreases and the process is quasistaticlyCEnthalpy content of the gas is constant and the process taken infinite amount of time for completionDEnthalpy content first decreases then increases and the process is reversible
Which of the below given statements stands true?
AA person can contract AIDS due to unprotected sexual intercourse with an infected person.BA person can contract AIDS while getting permanent tattooing with an infected needle.CA person cannot contract AIDS by donating blood to a HIV infected person.DAll of these
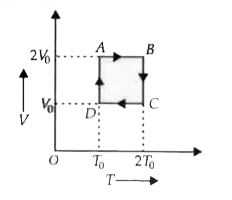
One mole of an ideal gas is taken through a cyclic process as shown in the V-T diagram. Which of the following statements is true ?
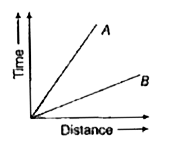
View SolutionThe distance-time graph for the motion of two vehicles A and B is given below. Which one of the following statements is true ?
View SolutionA graph between vapour pressure and temperature of few liquids is given below. Study the graph and answer following question.
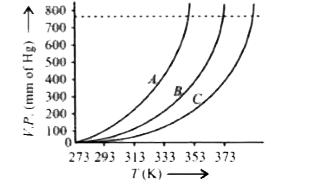
Which of the following statements is not true?
View SolutionThe P−T graph for the given mass of an ideal gas is shown in figure. Then the volume
_E01_022_Q01.png)
View SolutionThe distance - time graph for the motion of two vehicles . A and B is given below. Which one of the following statements is true ?
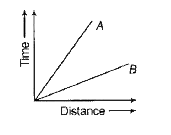
View Solution

