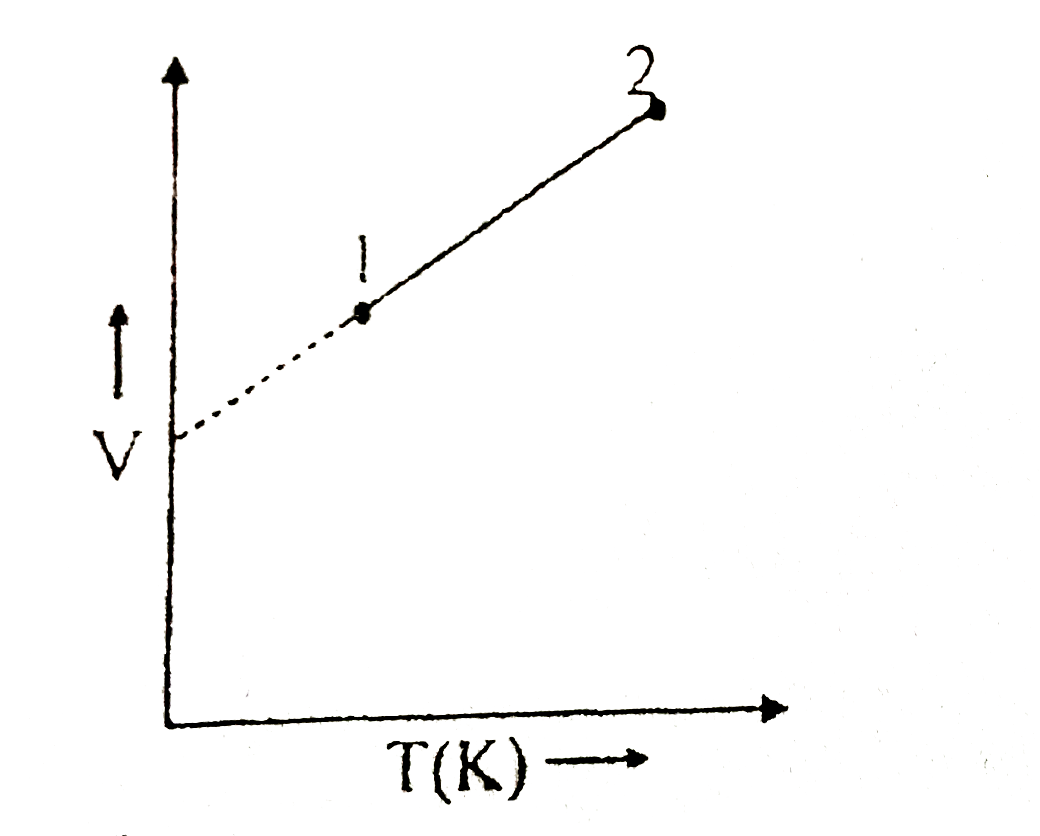
For the given graph which of the following is correct : (n = mole of gas and P = Pressure)

P2>P1 with n is constant
P2<P1 with n is constant
P2=P1 with n is constant
can't compare P1 and P2
The correct Answer is:A
From the graph, it is clear that slope is not 1. Hence volume will not increase as much as increase in mperature.
For or PV = nRT
P will also increase, P2>P1 (n = constant)
Topper's Solved these Questions
- TEST PAPERSBOOK - BANSALCHAPTER - TEST PAPERSEXERCISE - CHEMISTRY PART (A)
14 Videos
- TEST PAPERSBOOK - BANSALCHAPTER - TEST PAPERSEXERCISE - CHEMISTRY PART (B)
1 Videos
- TEST PAPERSBOOK - BANSALCHAPTER - TEST PAPERSEXERCISE - Chemistry PART D
4 Videos
- SOLUTIONSBOOK - BANSALCHAPTER - SOLUTIONSEXERCISE - Exercise4
32 Videos
- THERMOCHEMISTRYBOOK - BANSALCHAPTER - THERMOCHEMISTRYEXERCISE - Exercise 4
15 Videos
Similar Questions
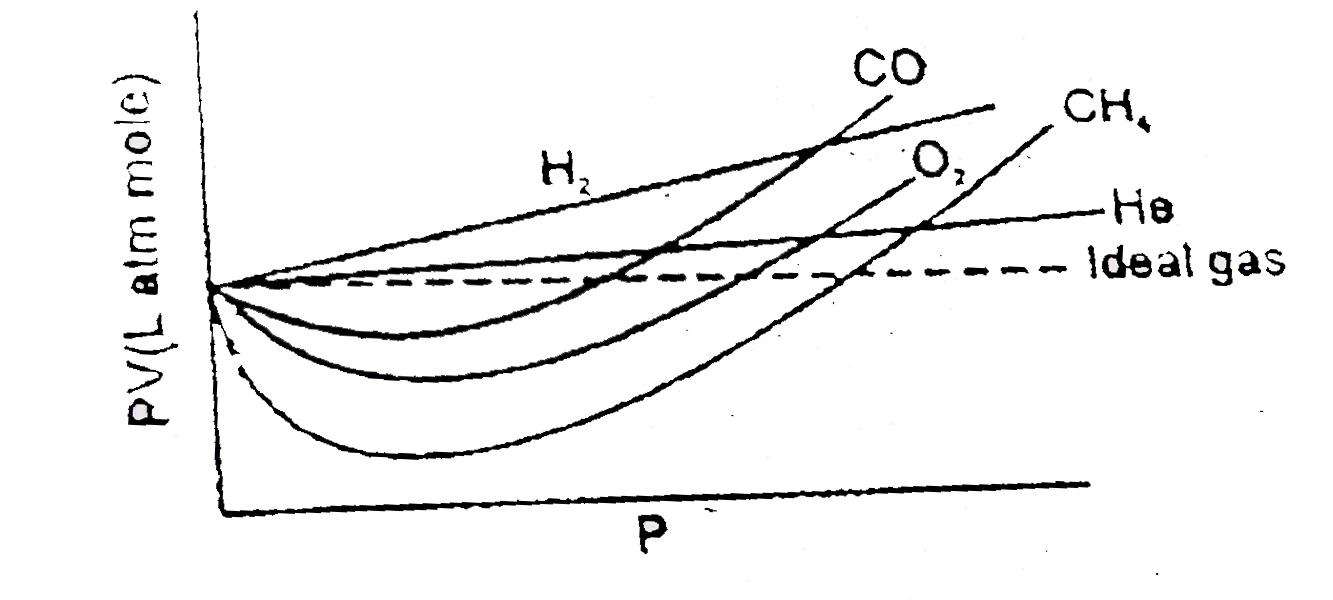
The curve of pressure volume (PV) against pressure (P) of the gas at a particular temperature is as shown, according to the graph which of the following is/are incorrect (in low pressure region):

View SolutionWhich of the following curve is correct for a given amount of an ideal gas at constant pressure?
View Solution
Knowledge Check
The curve of pressure volume (PV) against pressure (P) of the gas at a particular temperature is as shown, according to the graph which of the following is incorrect (in the low pressure region):
 AH2 and He shows +ve deviation from ideal gas equation.BCO,CH4 and O2 show negative deviation from ideal gas equation.CH2 and He show negative deviation while CO,CH4 and O2 show positive deviation.DH2 and He are less compressible than that of an ideal gas while CO,CH4 and O2 more compressible than that of ideal gas.
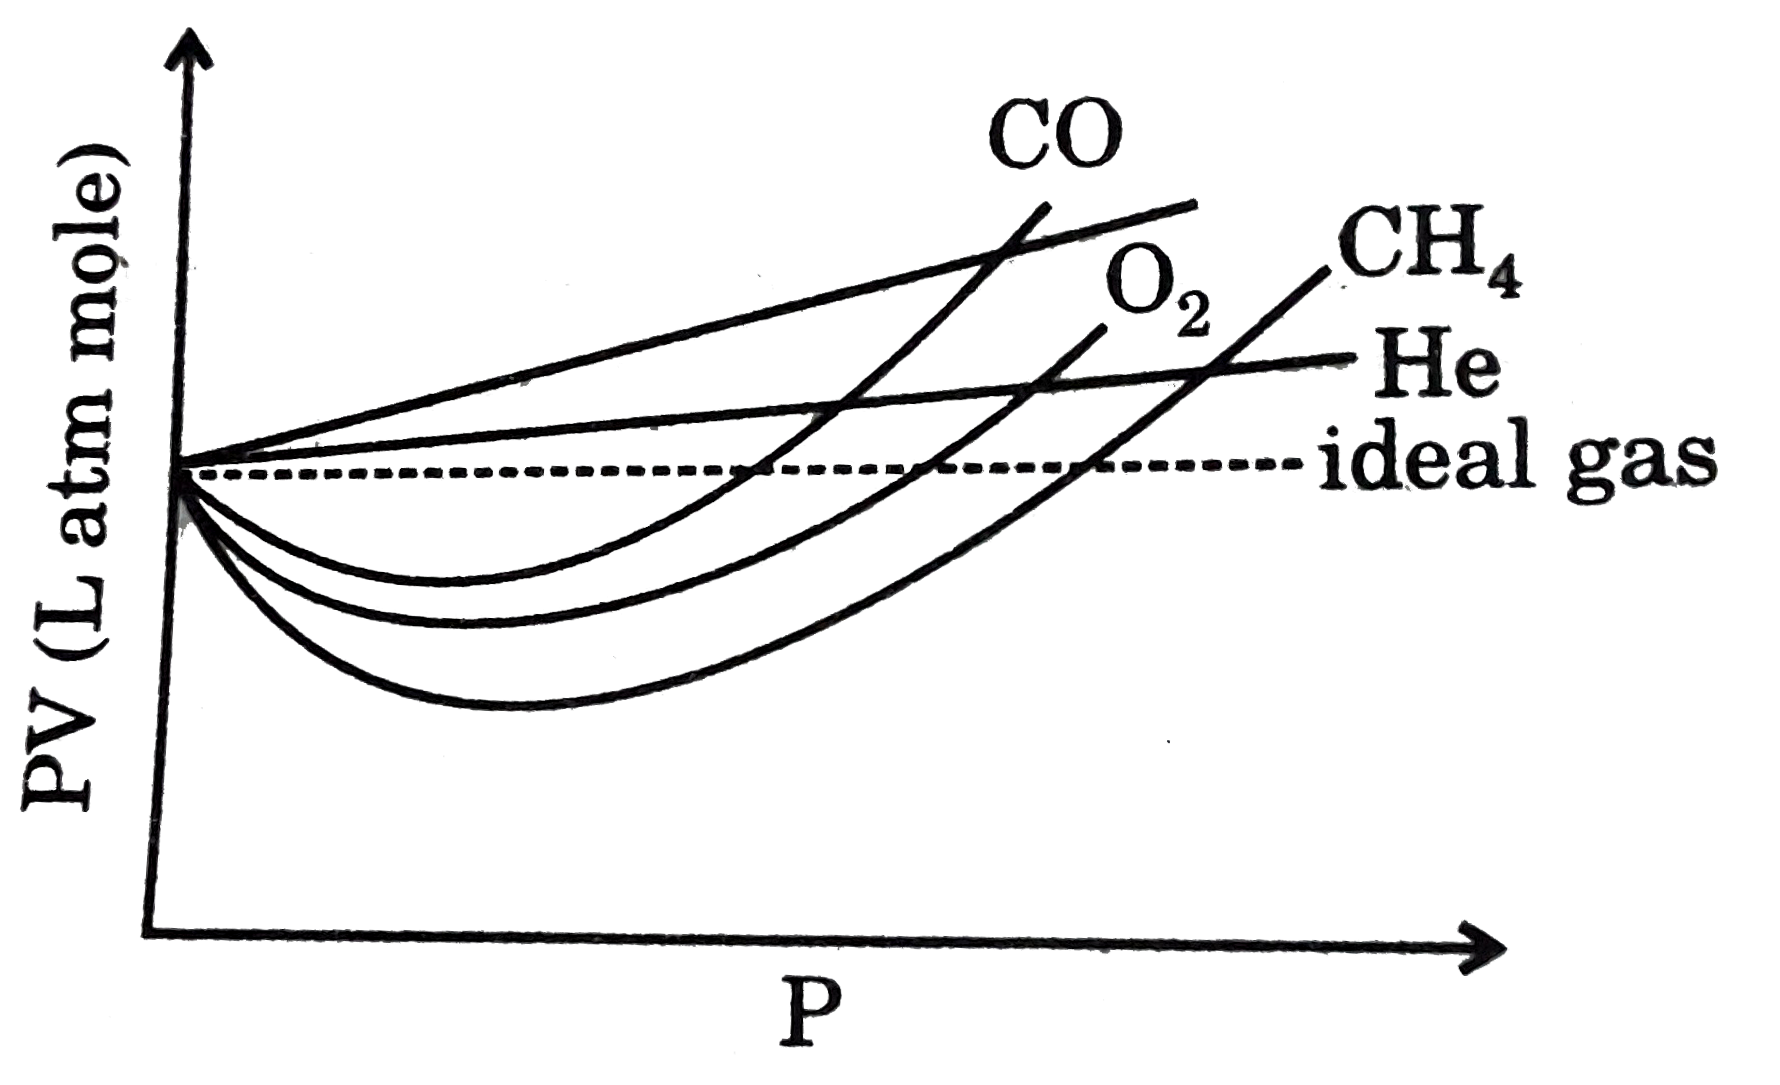
The curve of pressure volume (PV) against pressure (P) of the gas at a particular temperature is as shown, according to the graph which of the following is/are incorrect (in low pressure region):
 AH2 and He show positive deviation from ideal gas equationBCO, CH4 and O2 show negative deviation from ideal gas equationCH2 and He show negative deviation while CO2,CH4 and O2 show positive deviationDH2 and He are less compressible than that of an ideal gas while CO2,CH4 and O2 more compressible than that of ideal gas.
The curve of pressure volume (PV) against pressure (P) of the gas at a particular temperature is as shown, according to the graph. Which of the following is incorrect (in the low pressure region)?
 AH2 and He shows +ve deviation from ideal gas equationBCO,CH4 and O2 show negative deviation from ideal gas equation.CH2 and He show negative deviation while CO2,CH4 and O2 show positive deviationDH2 and He are less compressible than that of an ideal gas while CO2,CH4 and O2 more compressible than that of ideal gas.
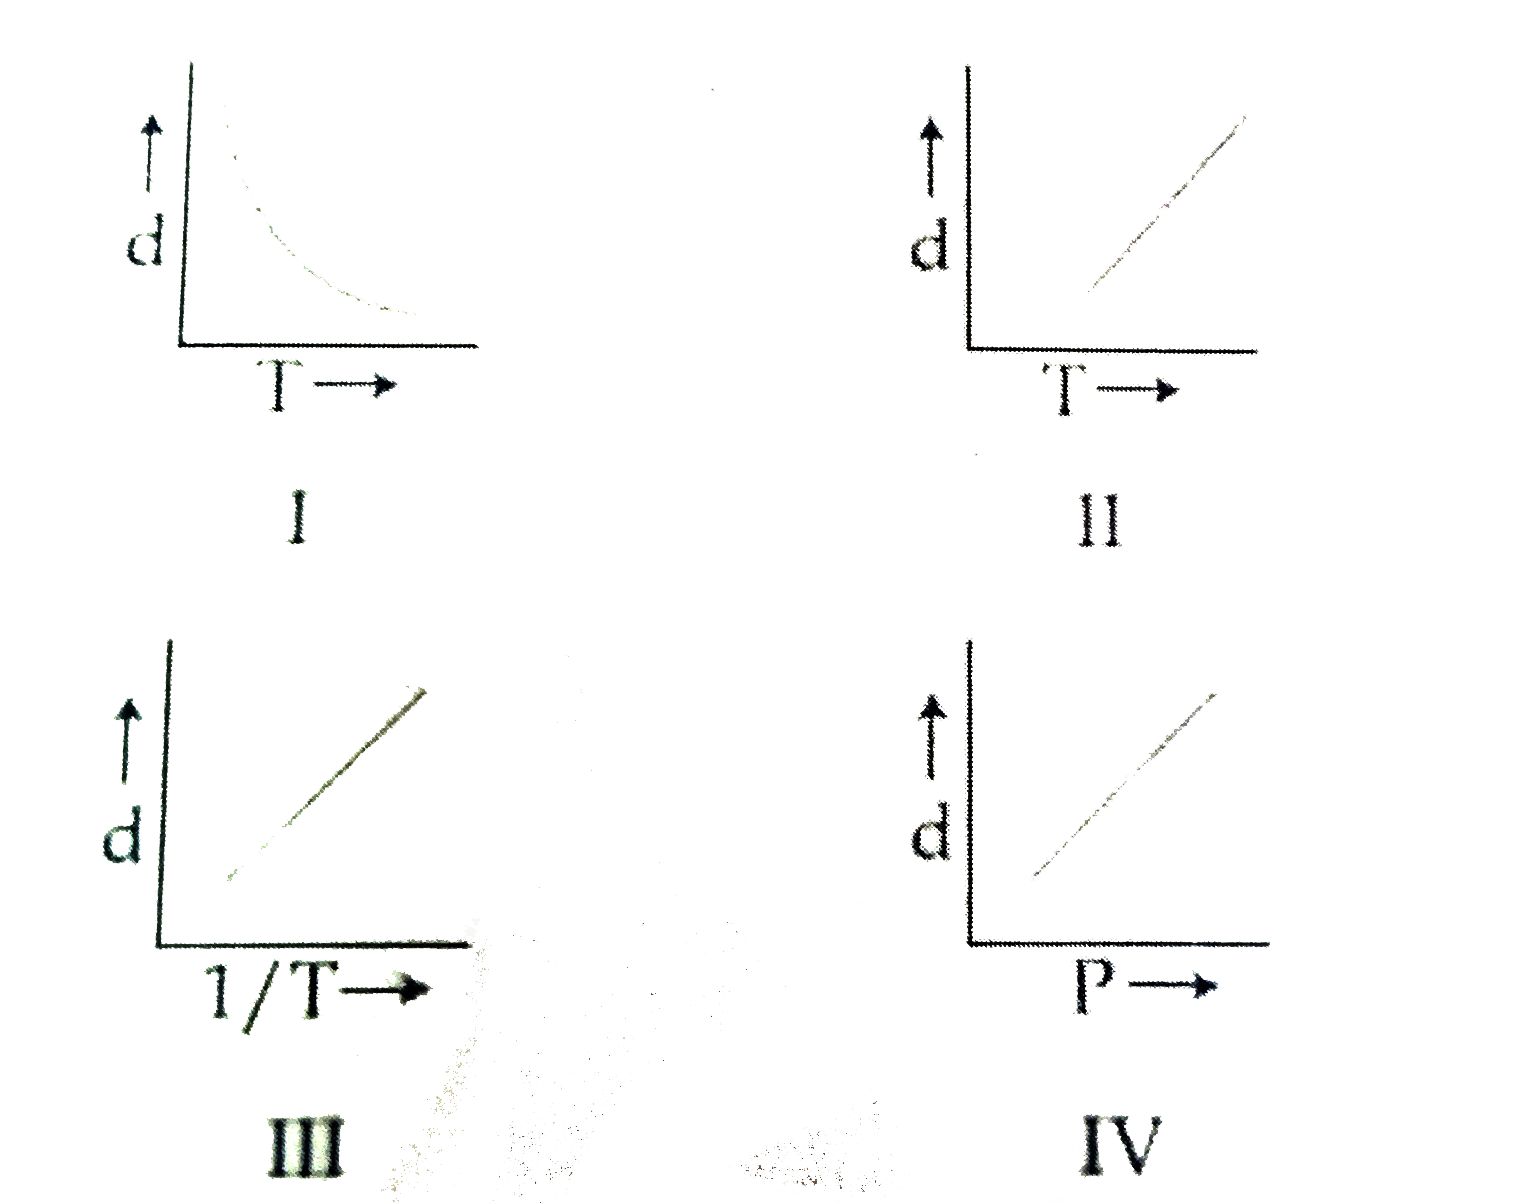
which one of the following graph is not correct for ideal gas ?

d=density ,P=pressure,T=Temperature
View Solutionwhich one of the following graph is not correct for ideal gas ?

d=density ,P=pressure,T=Temperature
View SolutionWhich one of the following graph is correct at constant pressure?
View SolutionWhich of the following curve is correct for a given amount of an ideal gas at constant pressure?
View SolutionFor the given circuit of p-n junction diode, which of the following statement is correct?

View Solution
