Which of the following may represent the curve x = 2y+ 3?
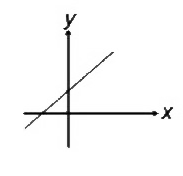
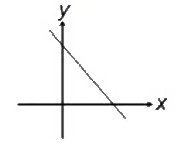
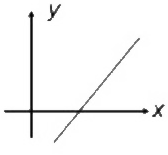
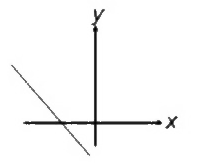
The correct Answer is:A
To solve the question "Which of the following may represent the curve x = 2y + 3?", we will follow these steps:
Step 1: Rearrange the given equation
The given equation is:
x=2y+3
We want to express this in the form of y=mx+c (the slope-intercept form).
Step 2: Solve for y
To isolate y, we can rearrange the equation:
2y=x−3
Now, divide both sides by 2:
y=12x−32
Step 3: Identify the slope and y-intercept
From the equation y=12x−32:
- The slope m is 12.
- The y-intercept c is −32.
Step 4: Determine points for graphing
To graph this line, we can find two points:
1. When y=0:
0=12x−32⟹12x=32⟹x=3
So, the point is (3,0).
2. When x=0:
y=12(0)−32=−32
So, the point is (0,−32).
Step 5: Plot the points and draw the line
Now, we can plot the points (3,0) and (0,−32) on the graph. Draw a straight line through these points.
Step 6: Compare with options
Finally, we compare the graph we have drawn with the options provided in the question to identify which one matches our graph.
Conclusion
The graph that matches our derived equation y=12x−32 will be the correct representation of the curve x=2y+3.
---
The given equation is:
x=2y+3
We want to express this in the form of y=mx+c (the slope-intercept form).
To isolate y, we can rearrange the equation:
2y=x−3
Now, divide both sides by 2:
y=12x−32
From the equation y=12x−32:
- The slope m is 12.
- The y-intercept c is −32.
To graph this line, we can find two points:
1. When y=0:
0=12x−32⟹12x=32⟹x=3
So, the point is (3,0).
y=12(0)−32=−32
So, the point is (0,−32).
Now, we can plot the points (3,0) and (0,−32) on the graph. Draw a straight line through these points.
Finally, we compare the graph we have drawn with the options provided in the question to identify which one matches our graph.
The graph that matches our derived equation y=12x−32 will be the correct representation of the curve x=2y+3.
Similar Questions
Knowledge Check
- Question 1 - Select One
Which of the following can represent the curve x2=−2y ?
A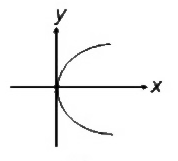 B
B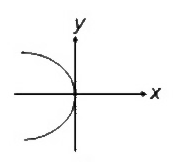 C
C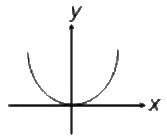 D
D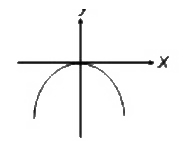
- Question 2 - Select One
Which of the following curves may represent the speed of the electron in a hydrogen atom as a function of the principal quantum number n ?
A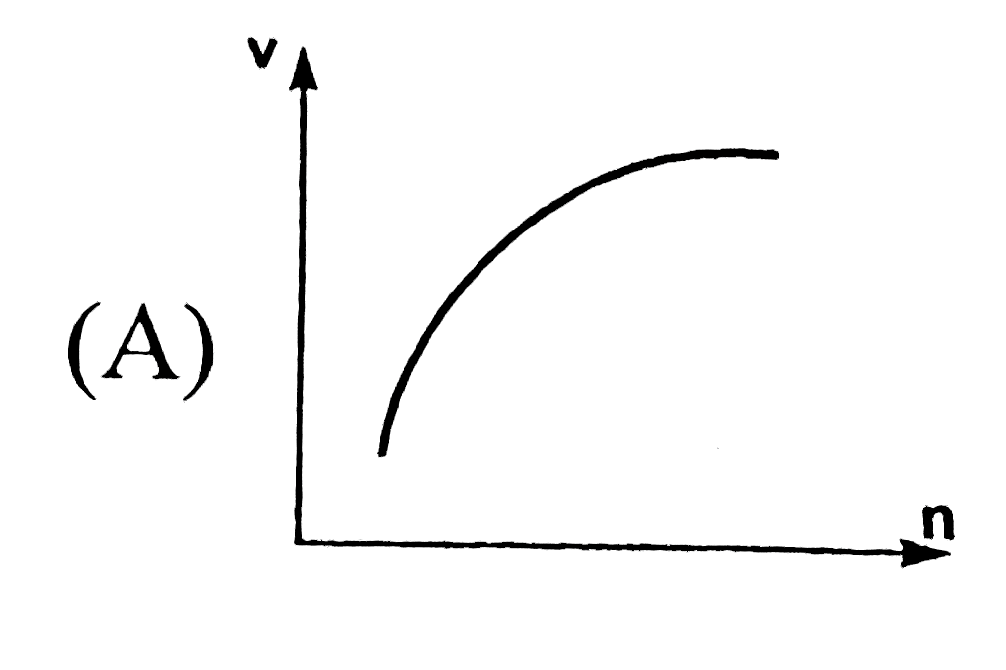 B
B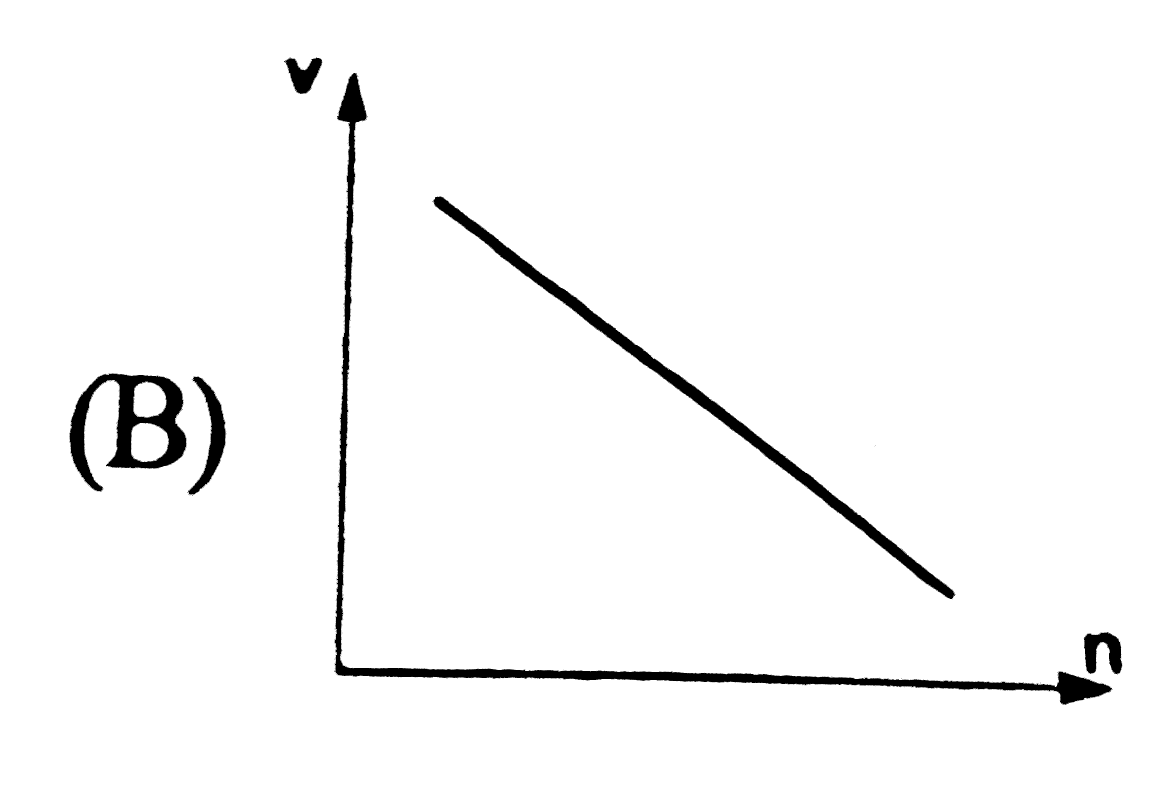 C
C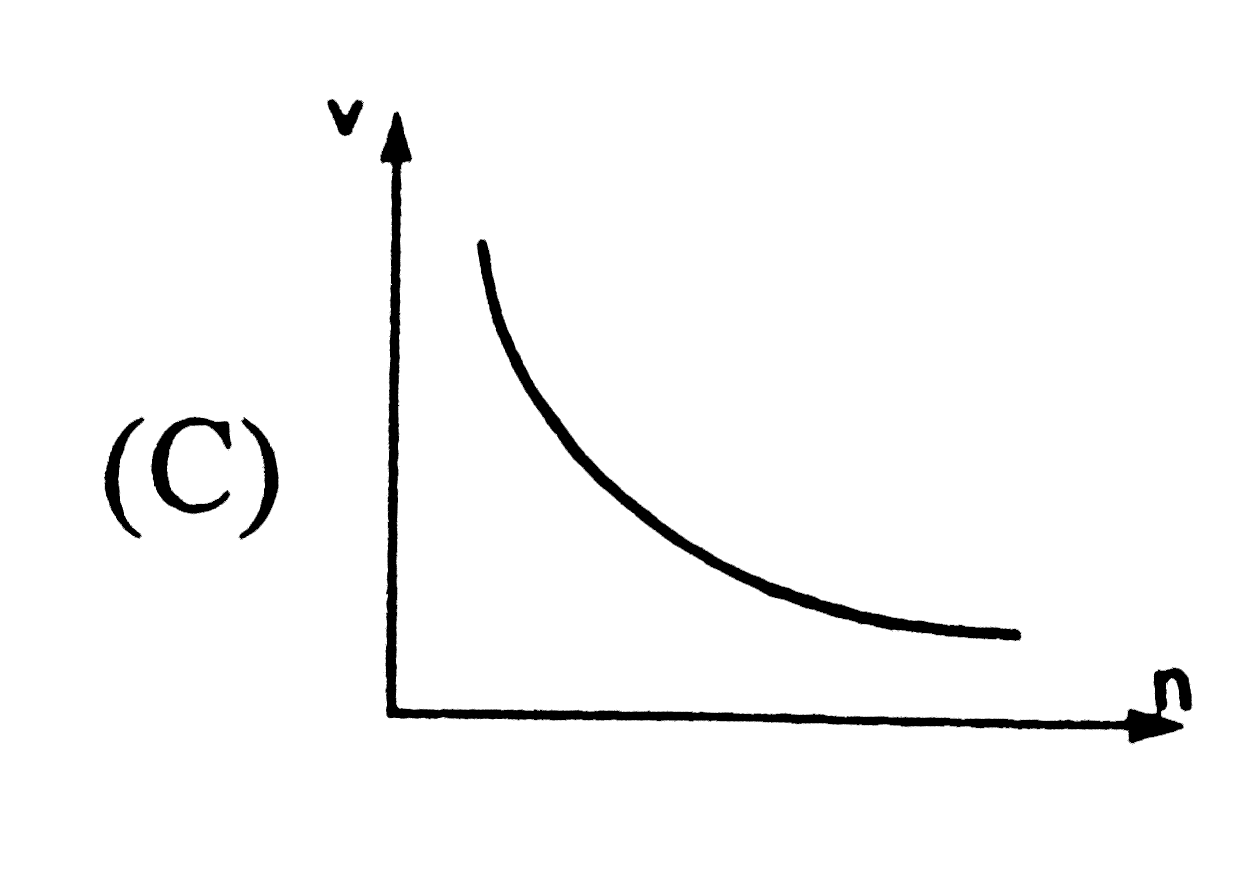 D
D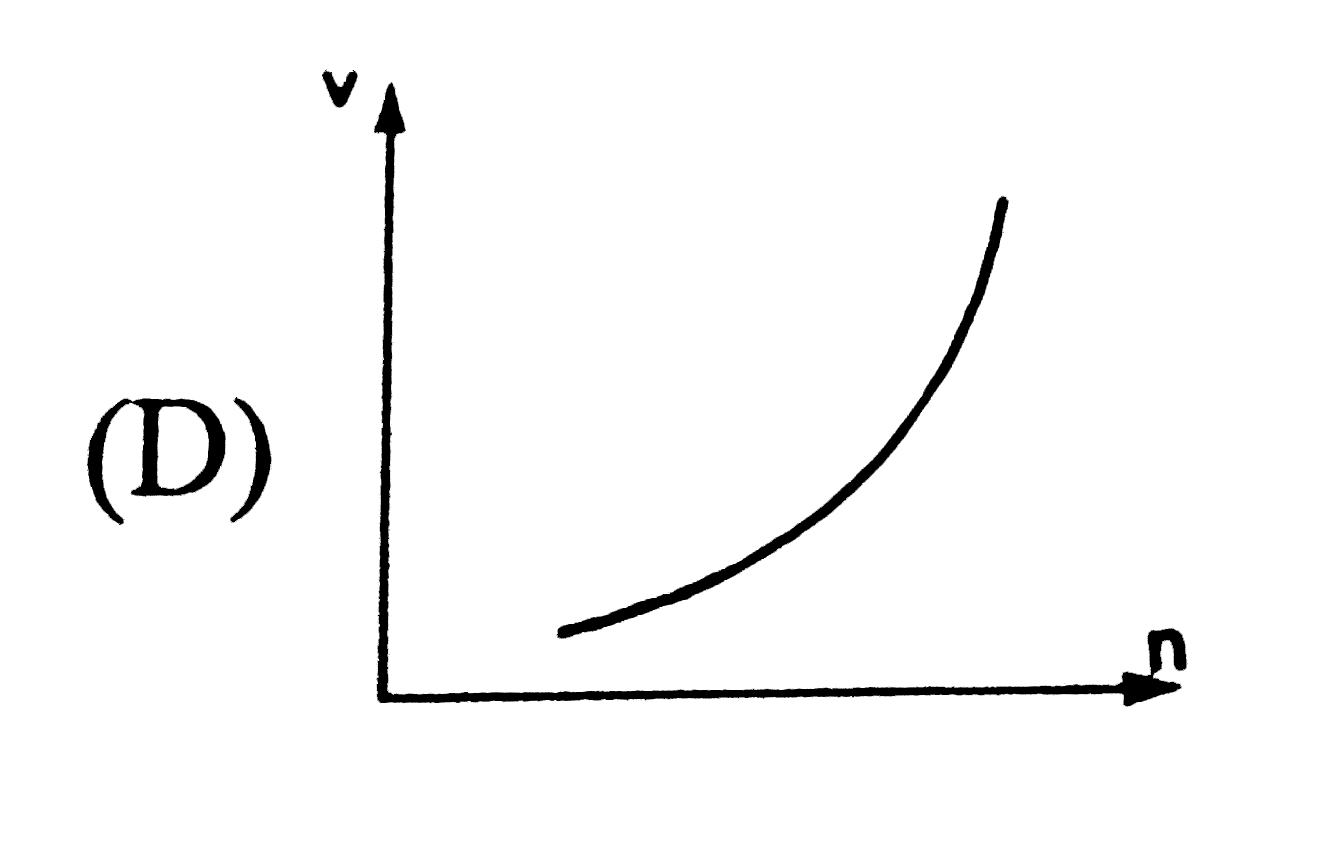
- Question 3 - Select One
A process is shown in the diagram. Which of the following curves may represent the same process?
 A
A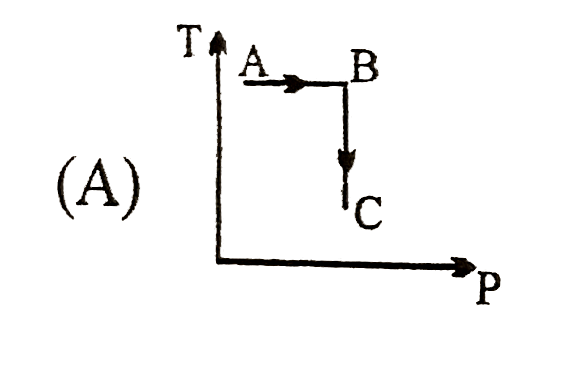 B
B C
C D
D
A process is shown in the diagram. Which of the following curves may represent the same process ? BC is rectangular hyperbola.
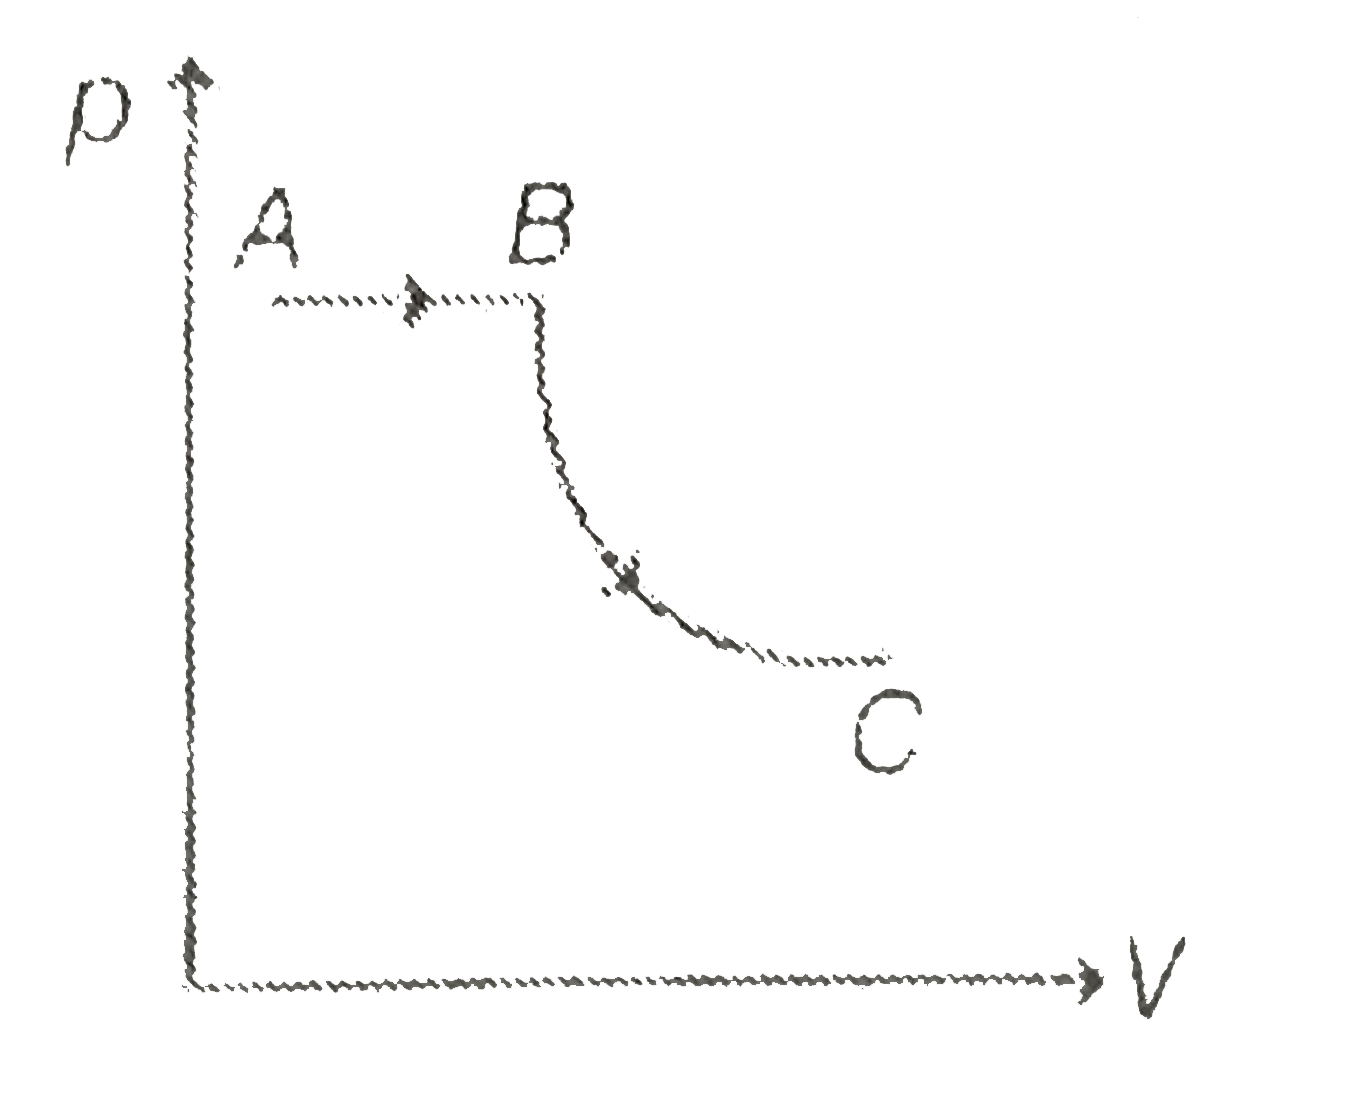 View Solution
Which of the following curves may represent the radius of orbit (rn) in a H-atoms as a function of principal quantum number(n)
View SolutionWhich of the following curves may represent the radius of orbit (rn) in H-atoms as a function of principal quantum number (n)
View SolutionWhich curve in the following graph represents the curve of ideal gas ?
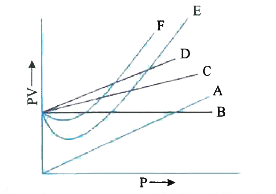 View Solution
A hot liquid is kept in a bog room. Accoding to Newton's law of cooling rate of cooling liquid (represented as y) is plotted against its temperature T. Which of the following curves may represent the plot?
View Solution


