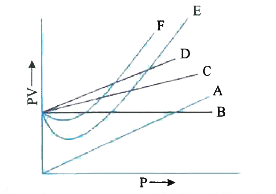
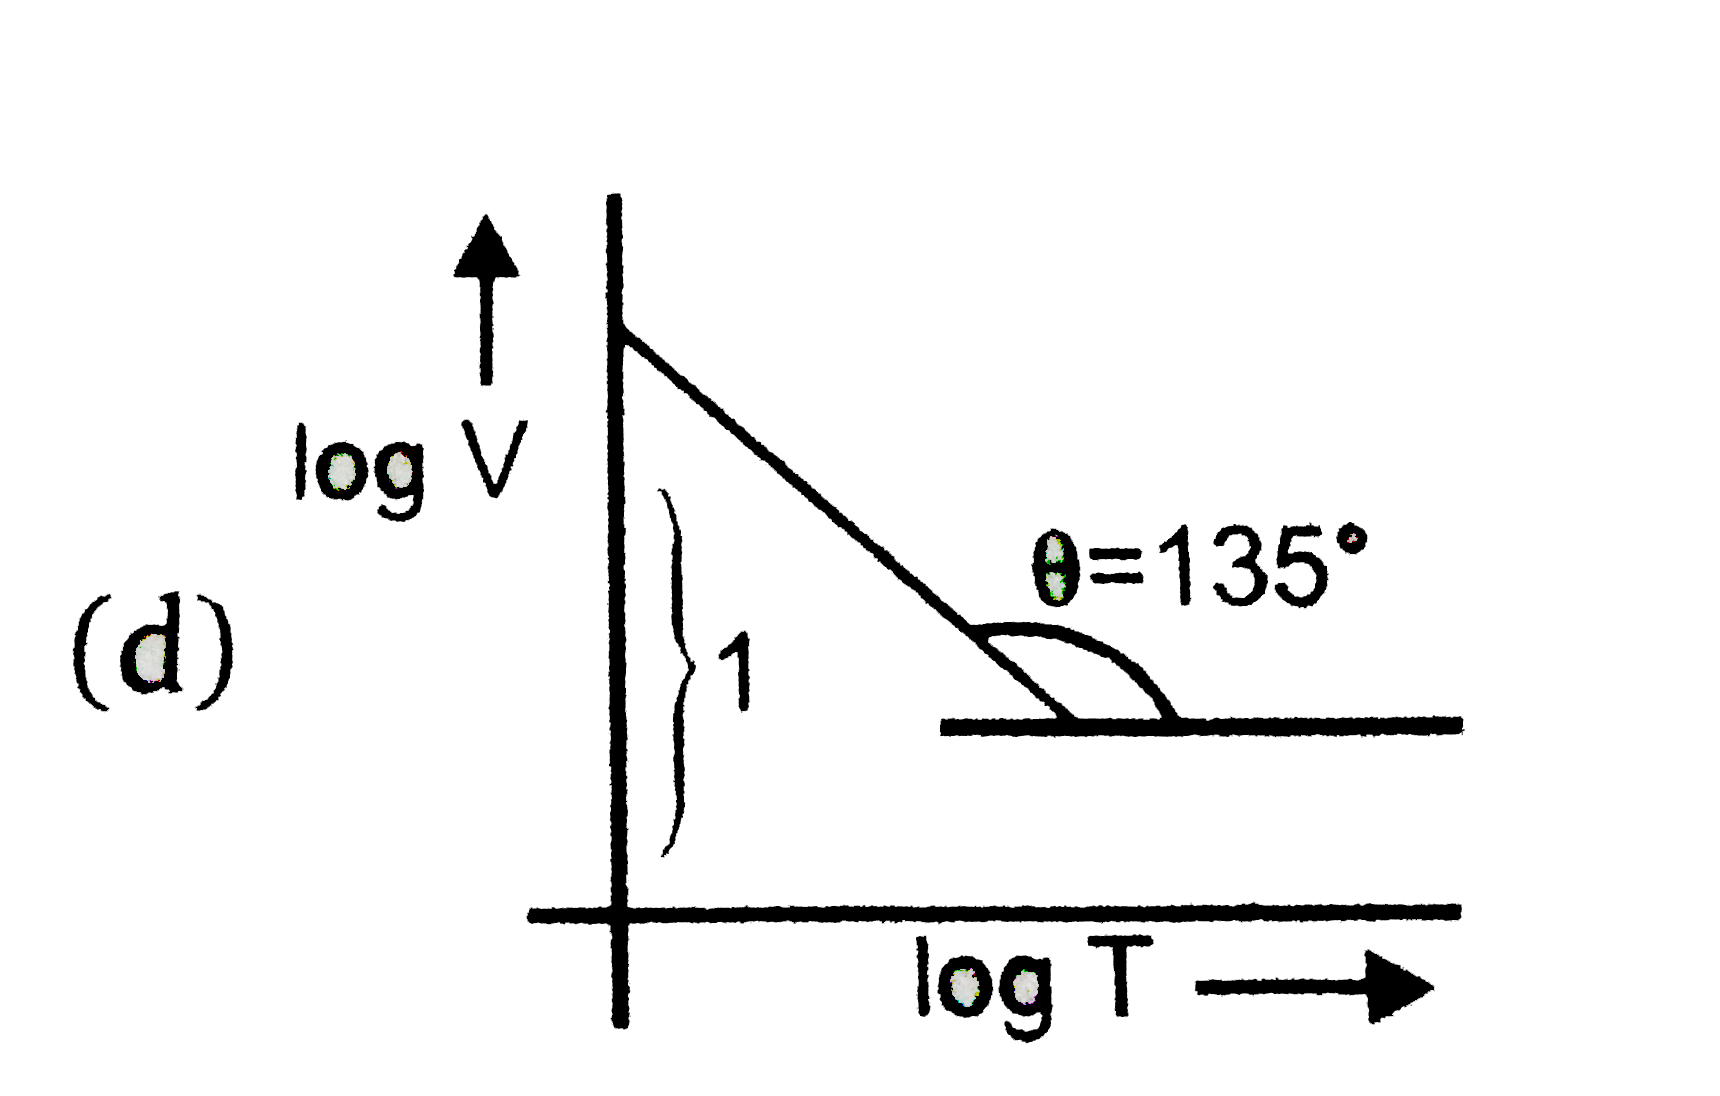
Which is correct curve for Charle's law, when the curve is plotted at 0.821 atm pressure for 10 mole ideal gas?
A
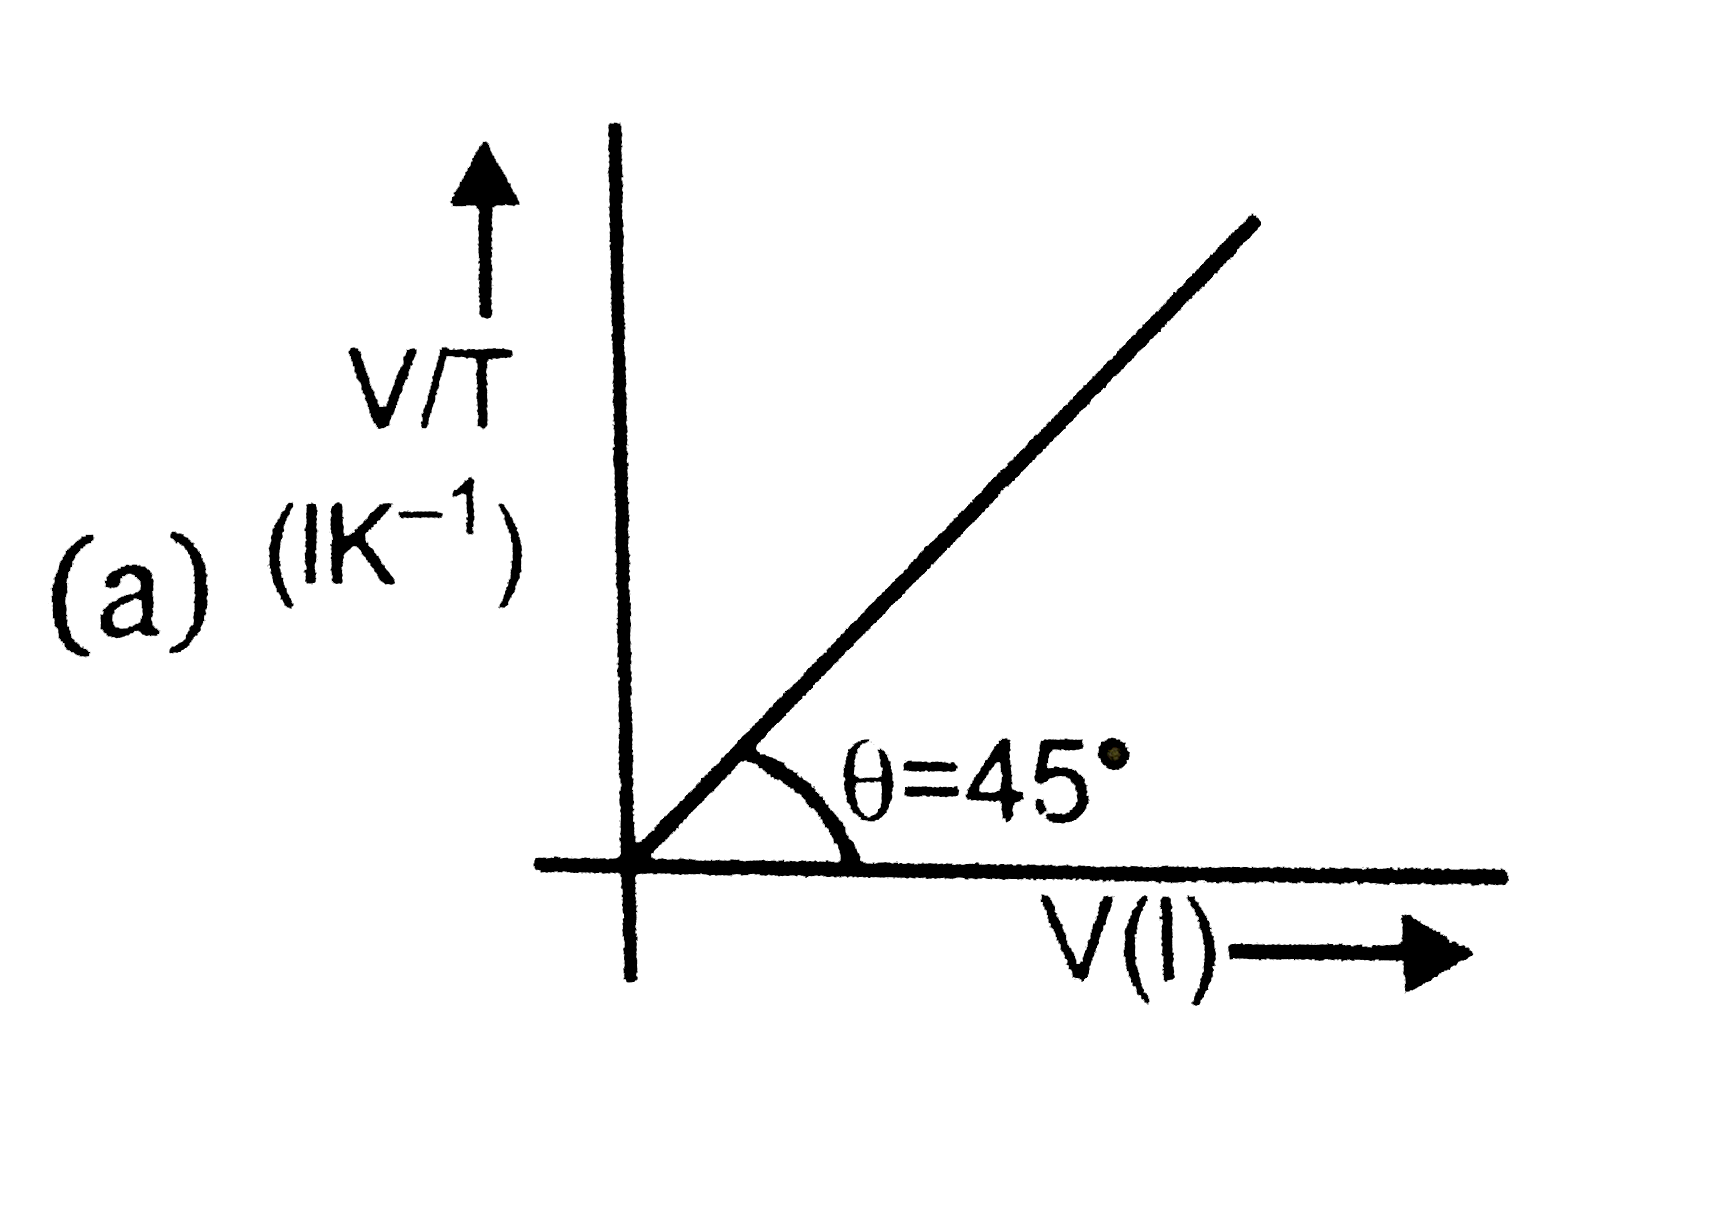
B
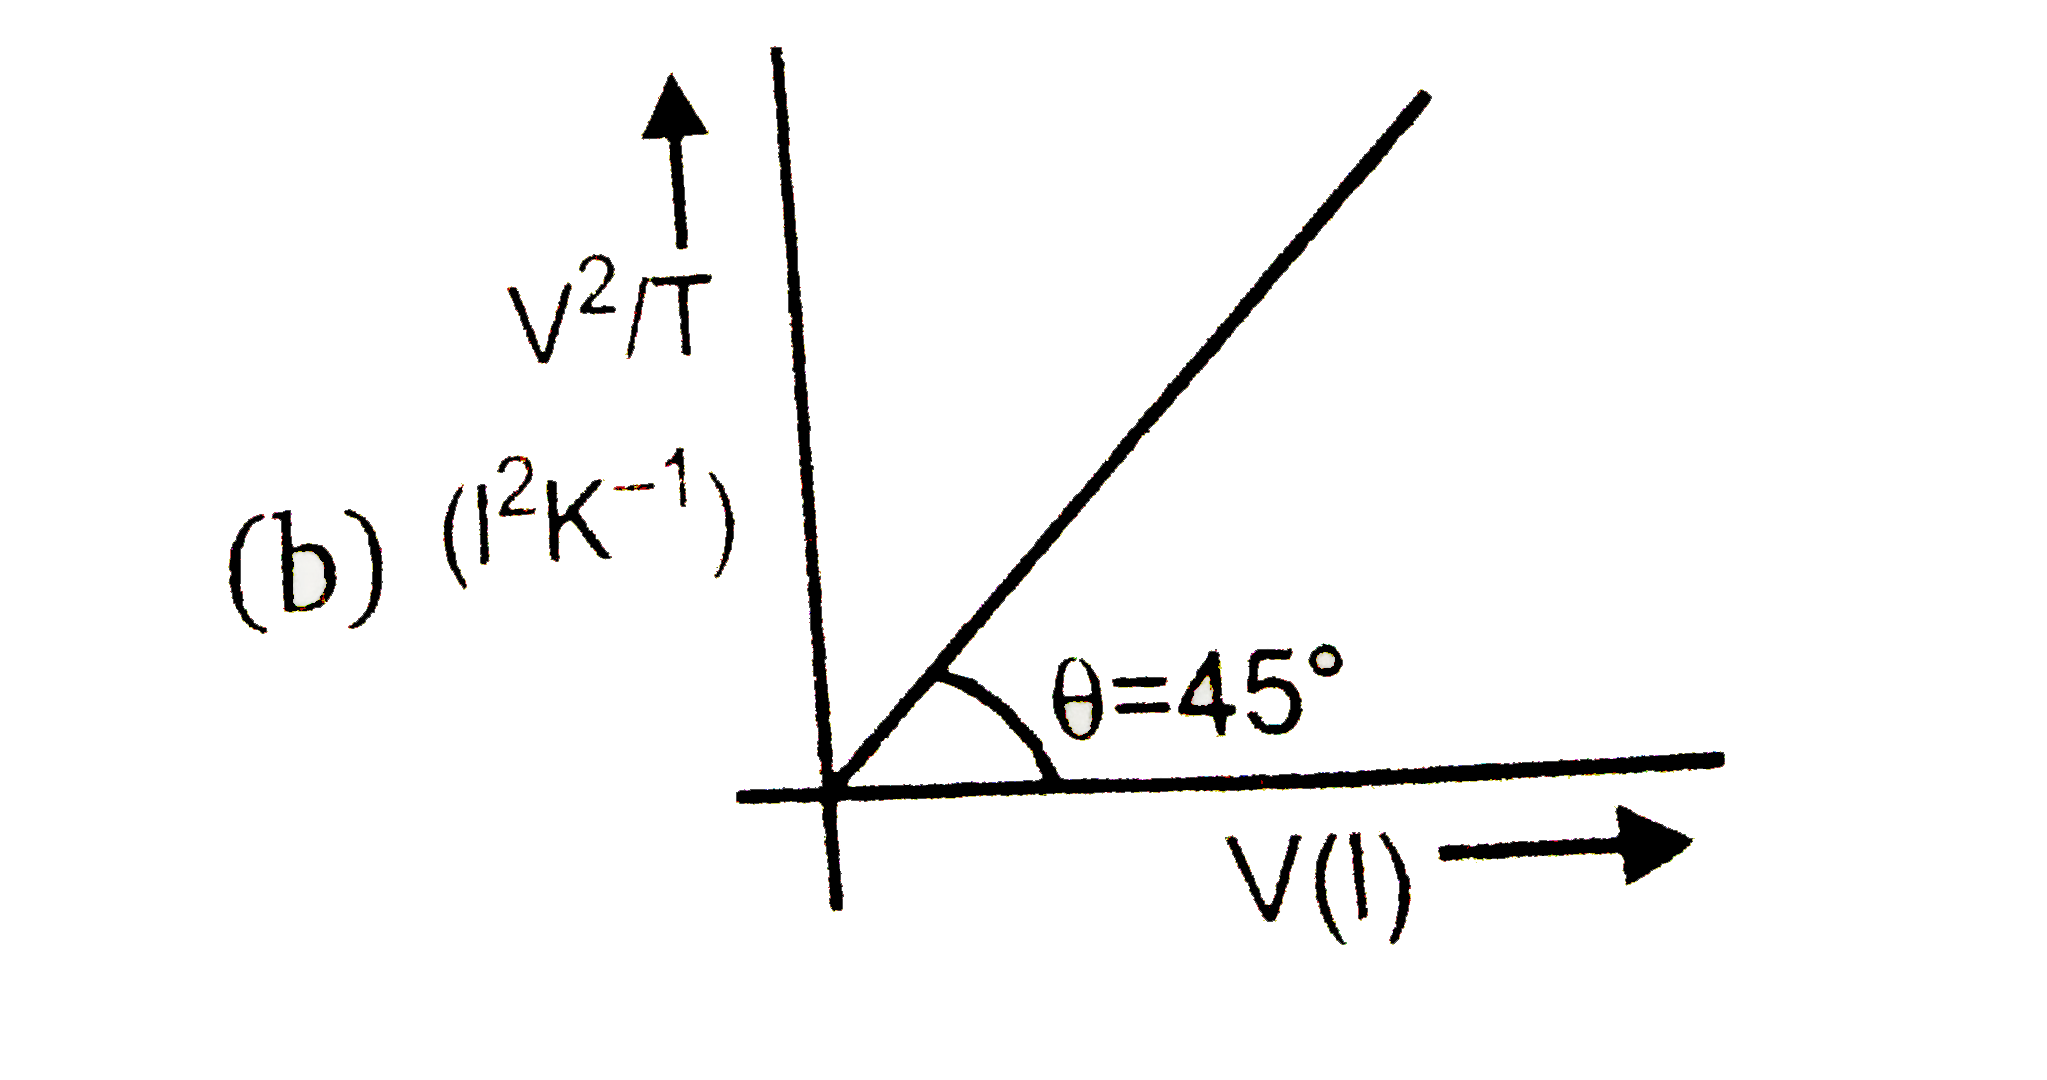
C
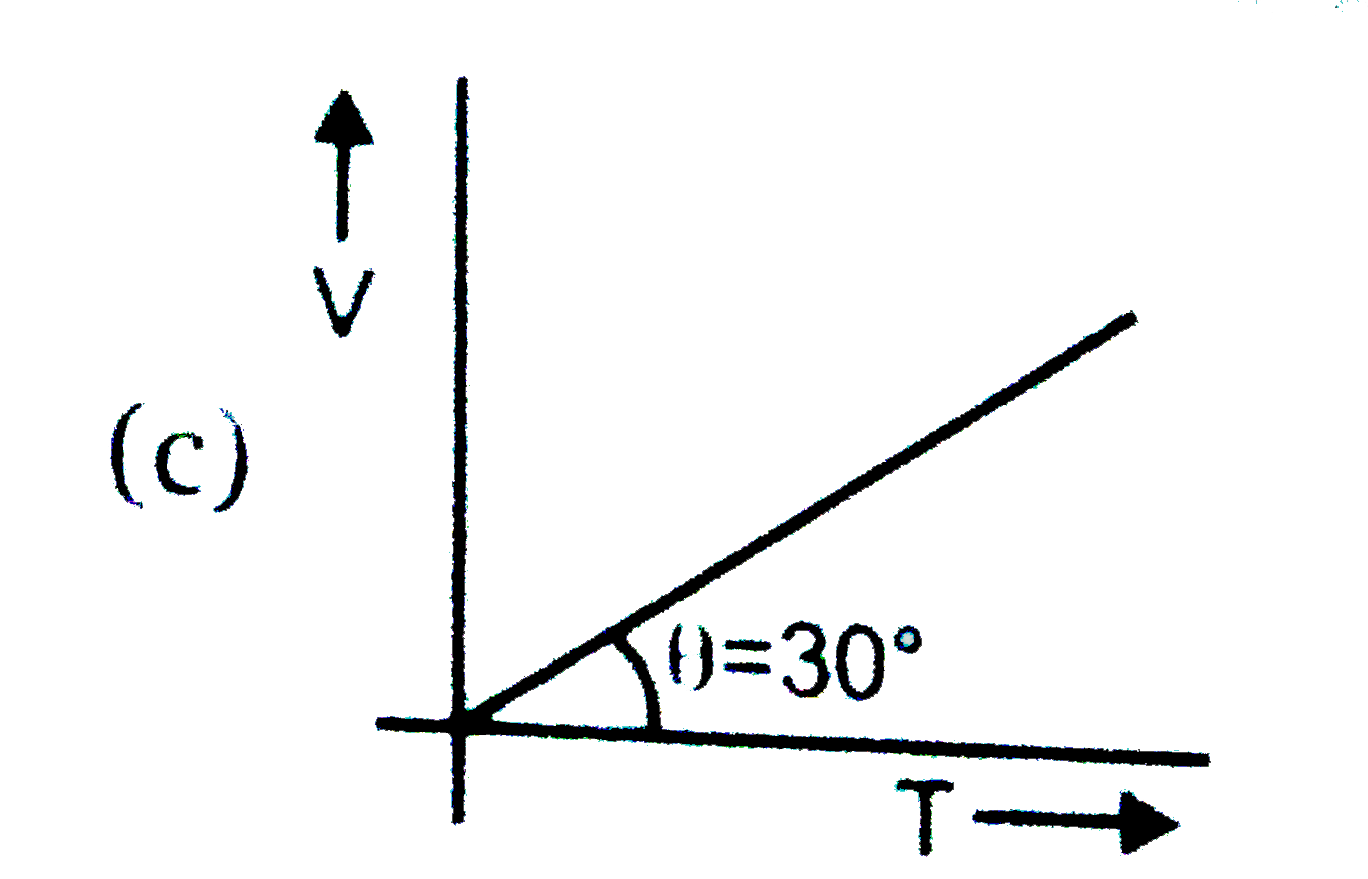
D
Video Solution
Text Solution
The correct Answer is:b
(b) V=KT
(i) VT=K
(ii)VT=KT2
(iii) log V = log K + log T
|
Topper's Solved these Questions
- GASEOUS STATEBOOK - NARENDRA AWASTHICHAPTER - GASEOUS STATEEXERCISE - Level 1 (Q.31 To Q.60)
1 Videos
- GASEOUS STATEBOOK - NARENDRA AWASTHICHAPTER - GASEOUS STATEEXERCISE - Level 1 (Q.121 To Q.150)
1 Videos
- ELECTROCHEMISTRYBOOK - NARENDRA AWASTHICHAPTER - ELECTROCHEMISTRYEXERCISE - Level 3 - Subjective Problems
1 Videos
- IONIC EEQUILIBRIUMBOOK - NARENDRA AWASTHICHAPTER - IONIC EEQUILIBRIUMEXERCISE - Exercise
196 Videos
Similar Questions
Knowledge Check
which in not correct curve for Gay-luacc's law ?
A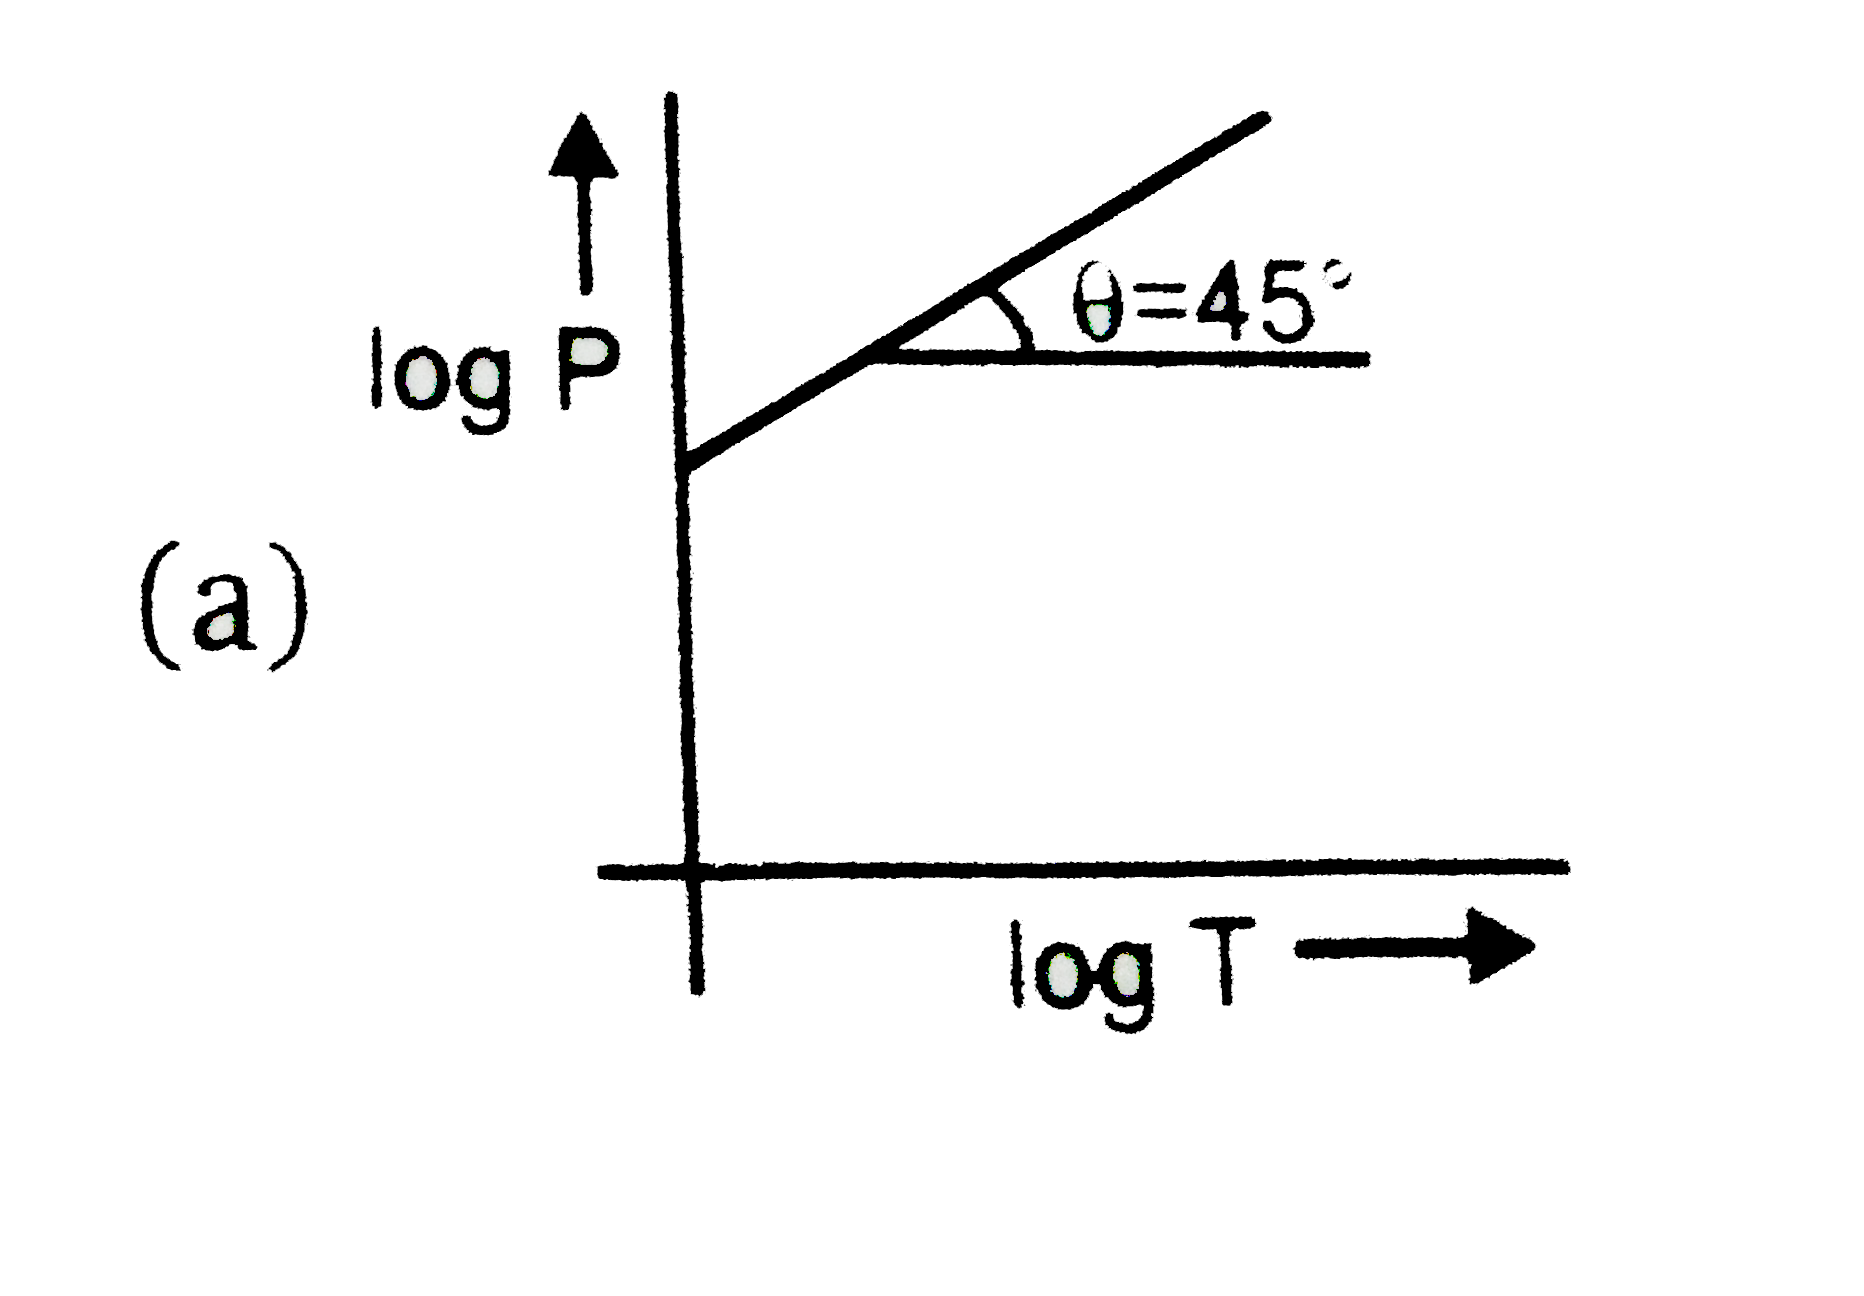 B
B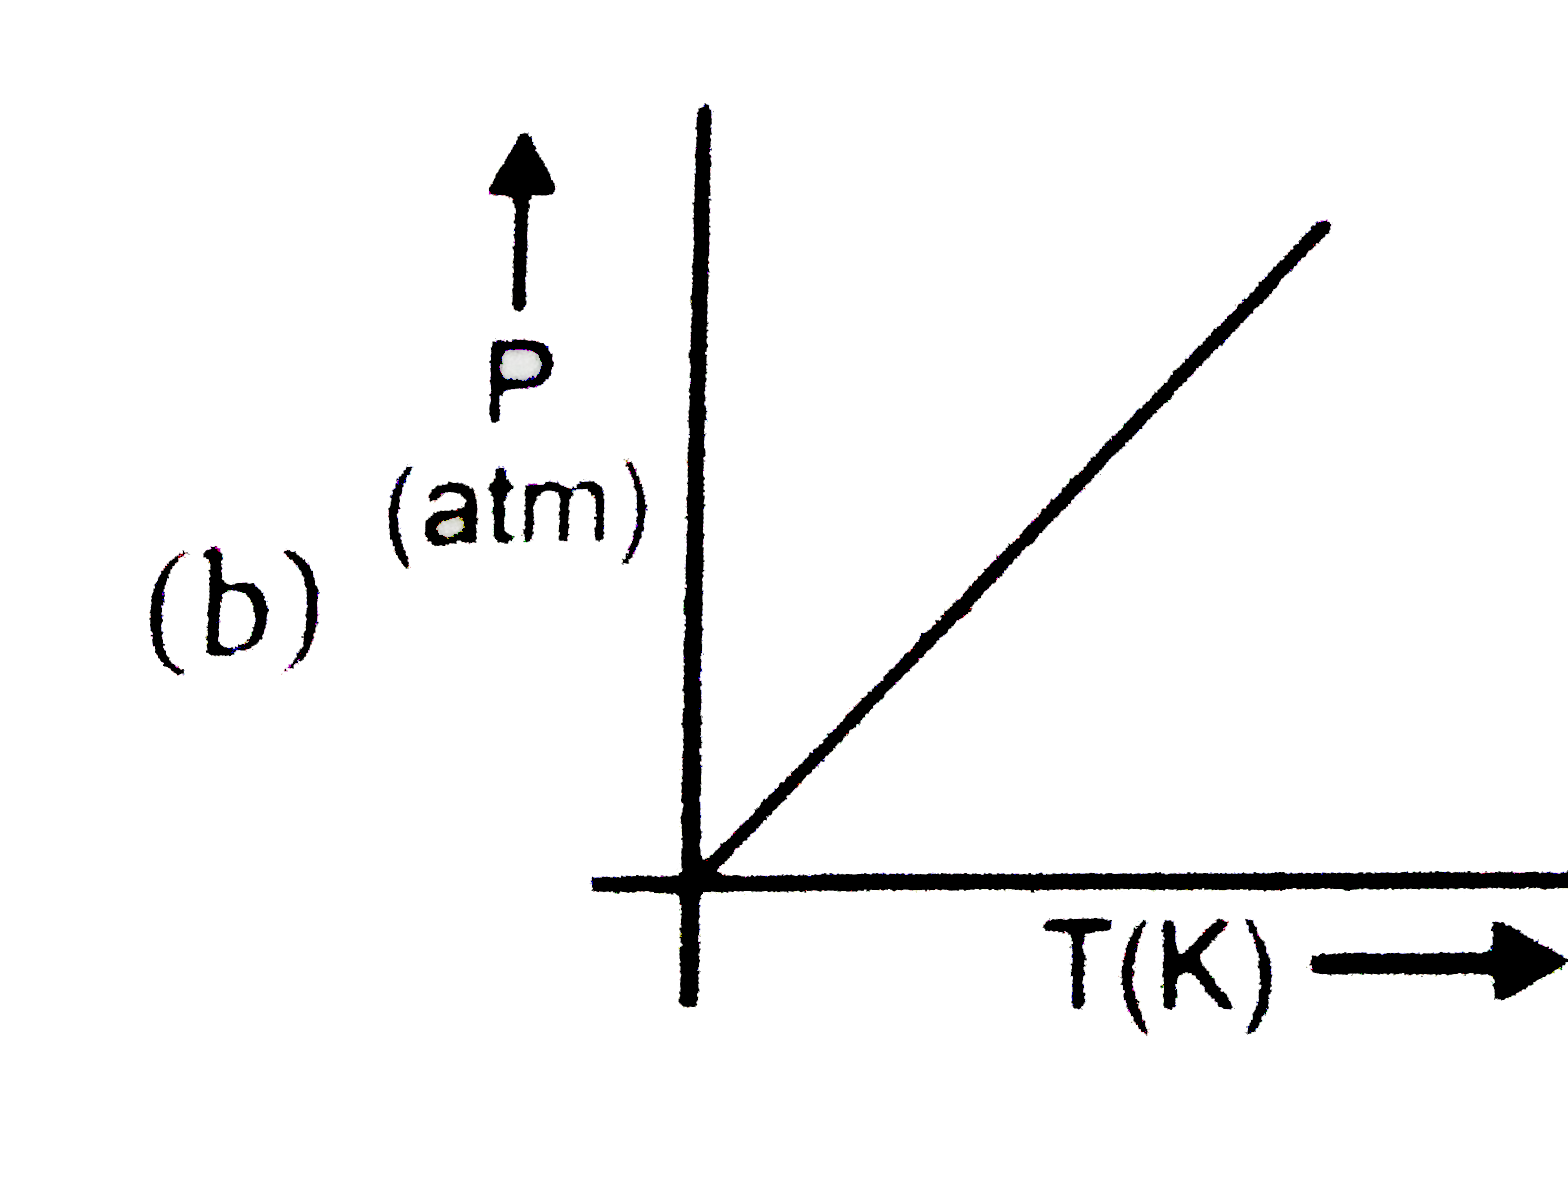 C
C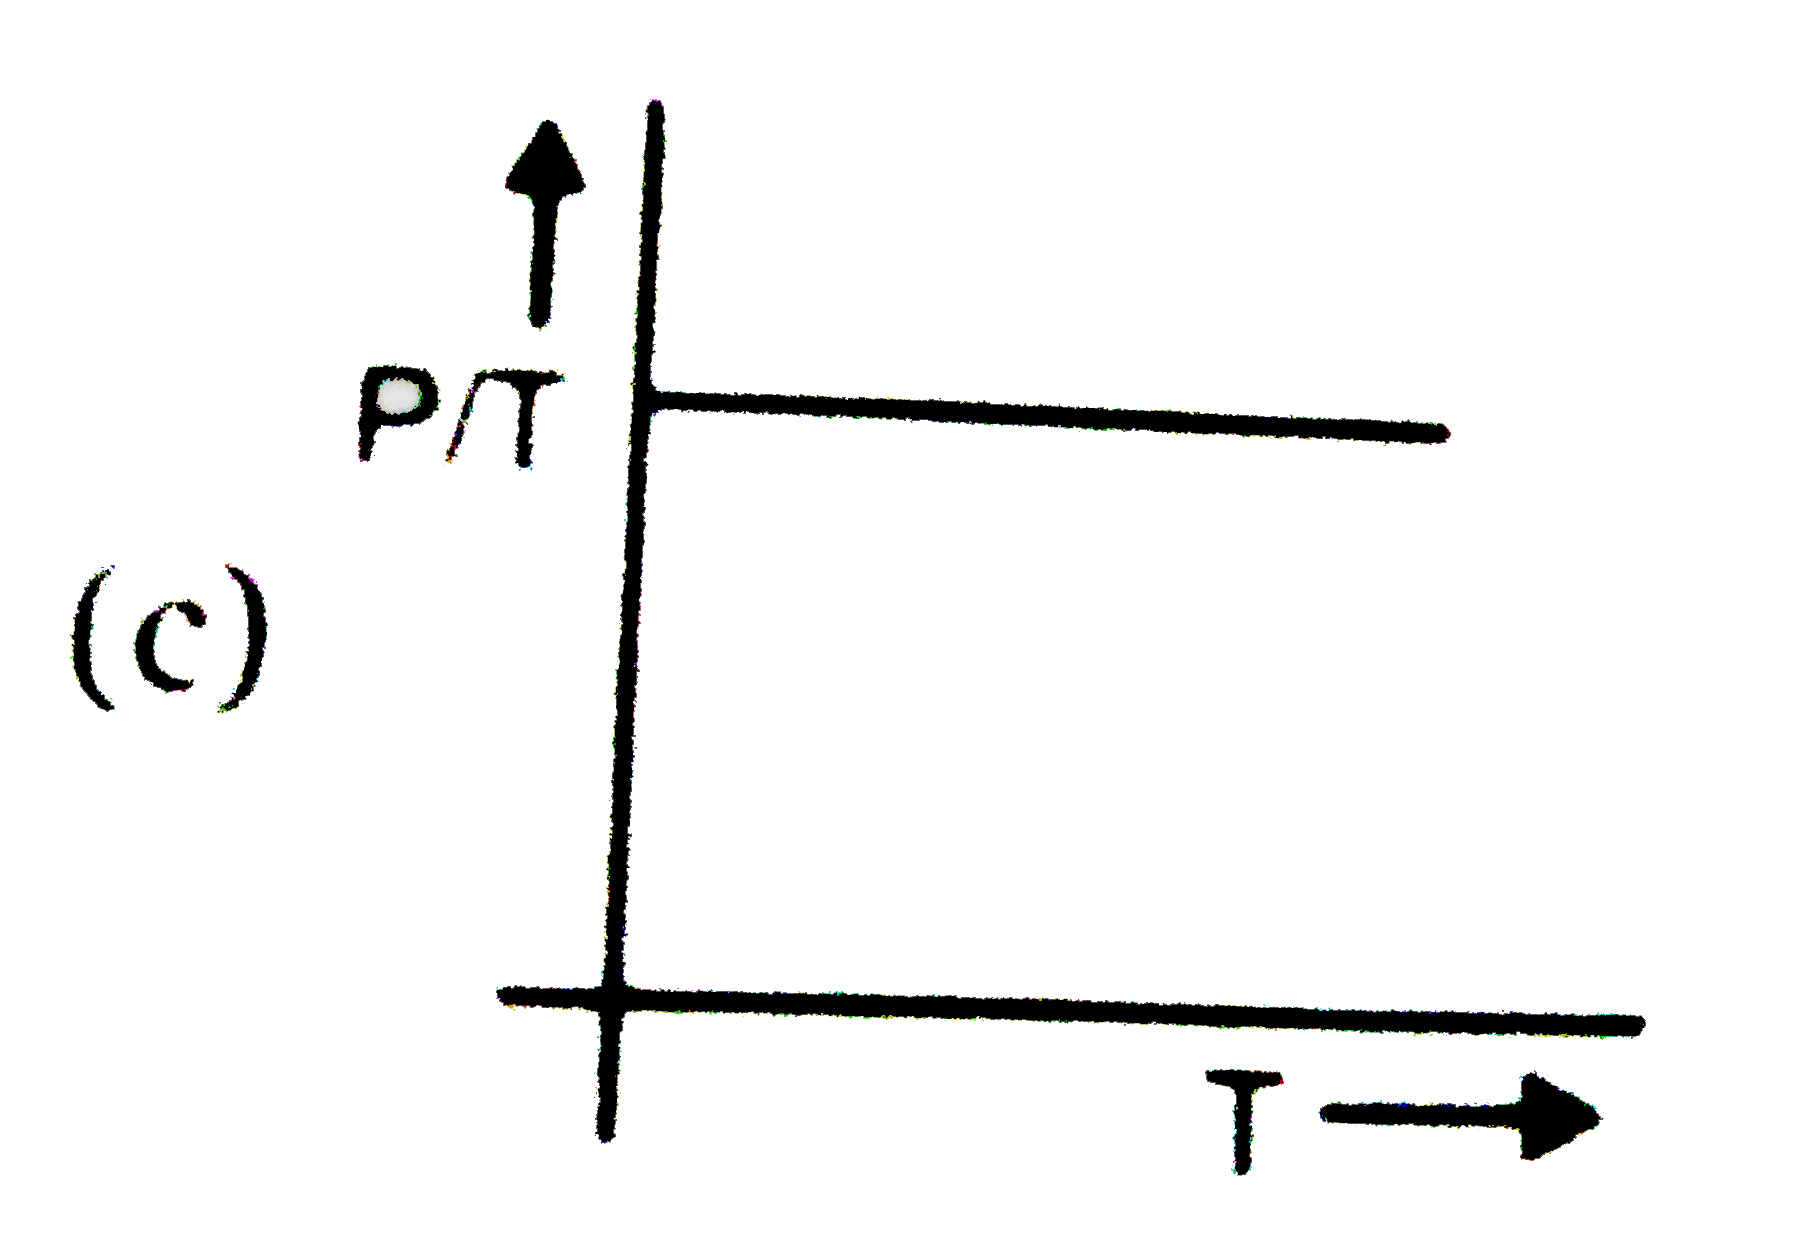 D
D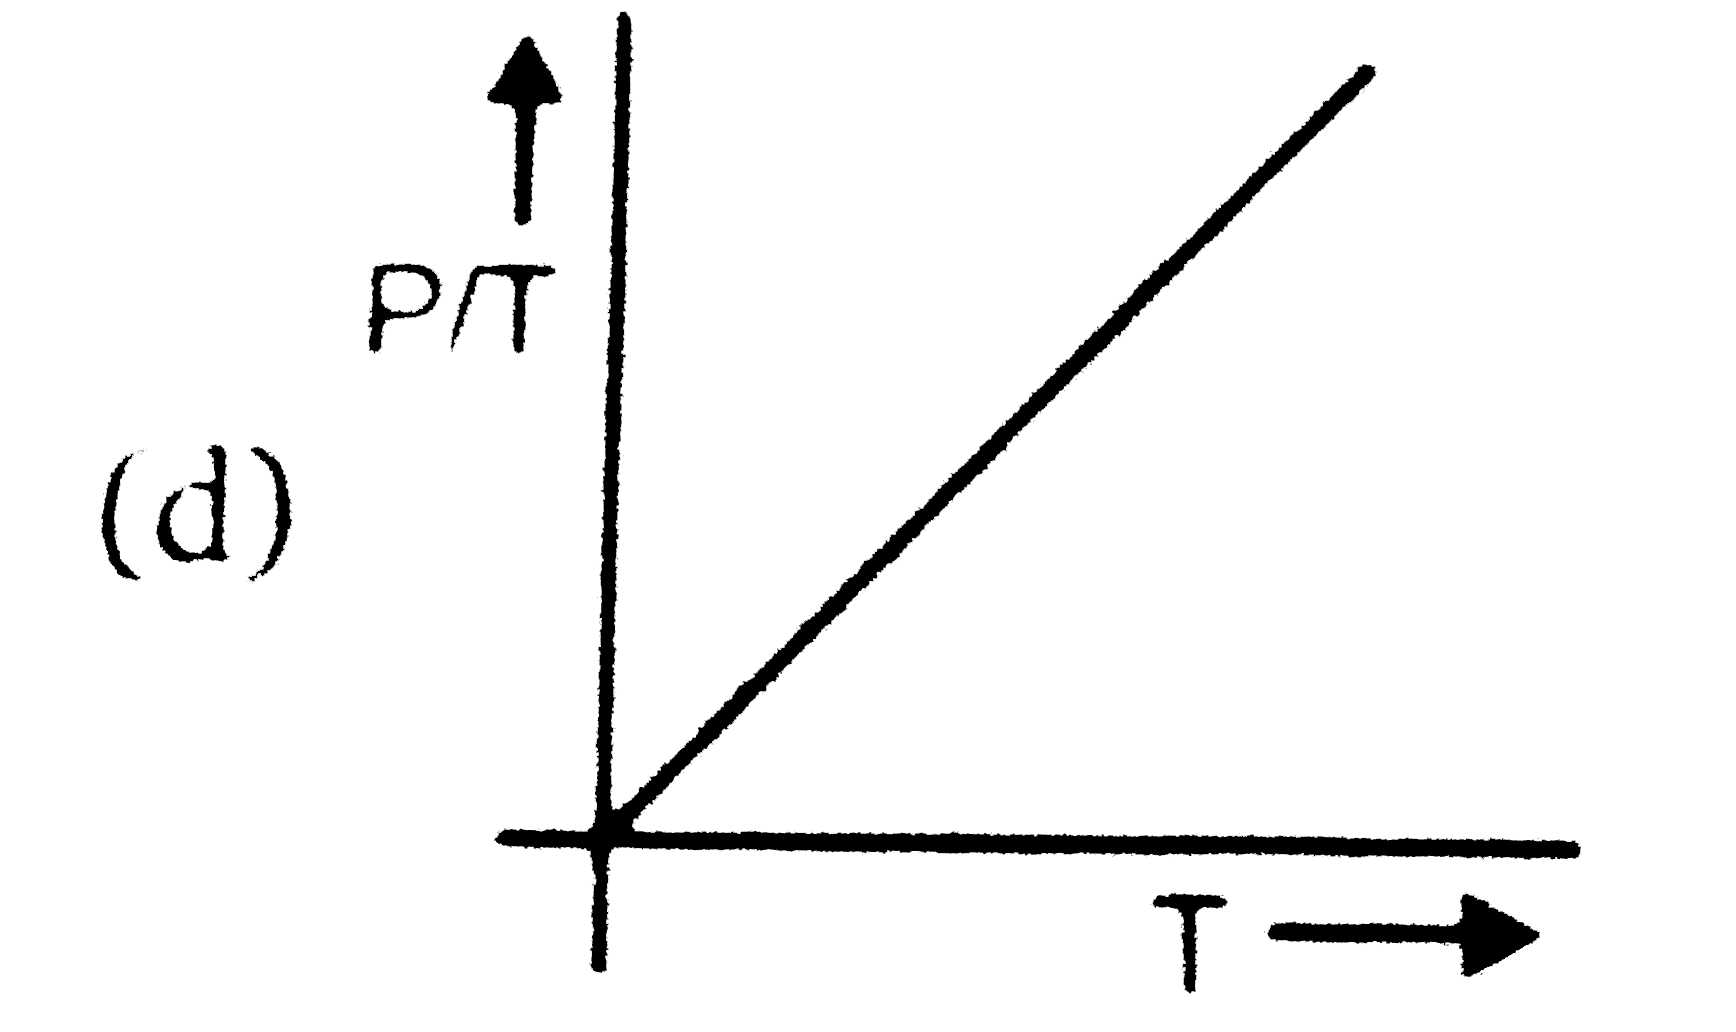
Which curve in figure represents the curve of ideal gas ?
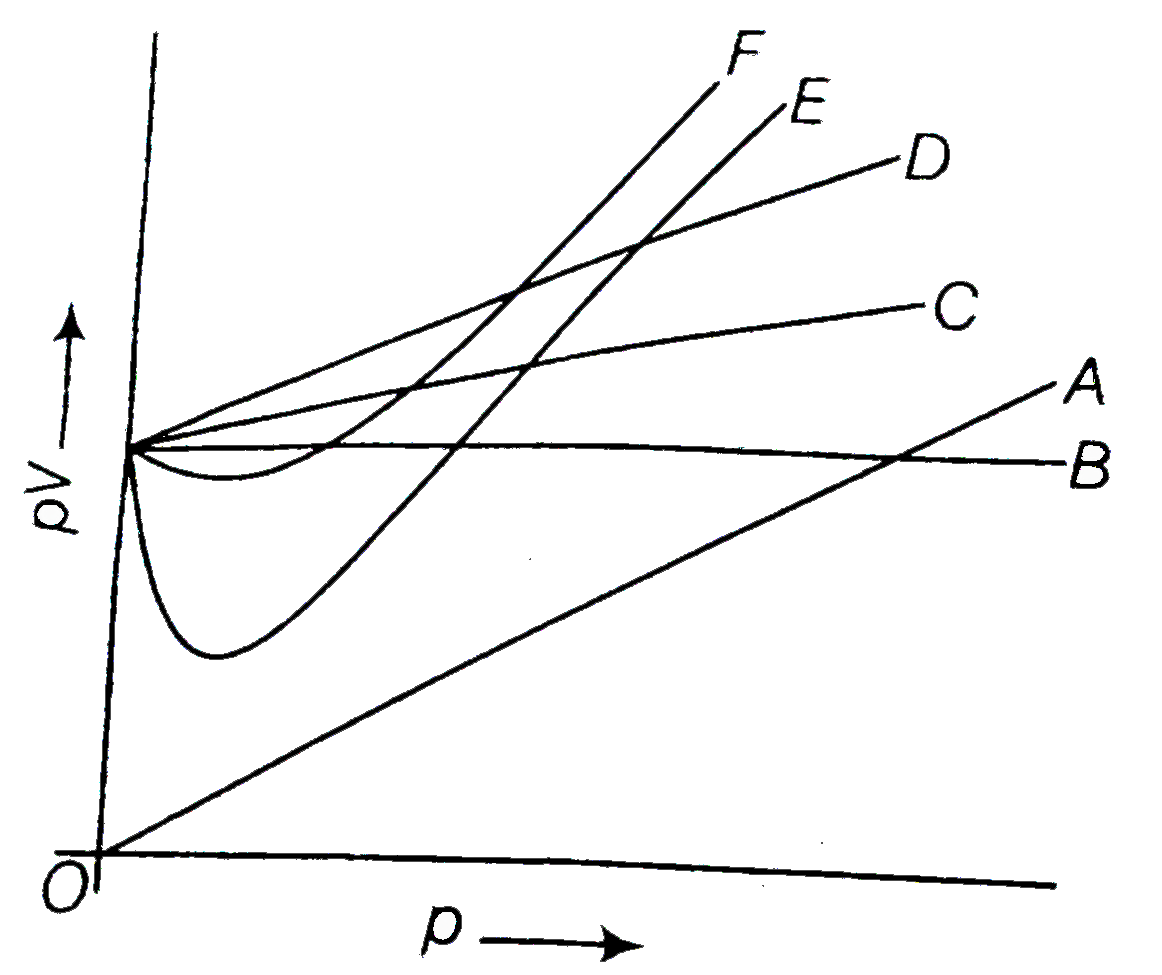 AOnly BBC and DCE and FDA and B
Which curve in figure represents the curve of ideal gas?
 AB onlyBC and D onlyCE and F onlyDA and B only
Log P vs log V curve is plotted for an ideal gas, which is true for the gas ?

View SolutionWhich of these curves represents Henry's law graph between partial pressure on y - axis mole fraction of gas on x - axis
View SolutionThe given curve represents the variation of temperatue as a function of volume for one mole of an ideal gas. Which of the following curves best represents the variation of pressure as a function of volume ?
(##DCP_V03_C20_E01_099_Q01##).
View SolutionWhich of the following plots are correct for an ideal gas ?
View SolutionWhich of the following volume (V) - temperature (T) plots represents the behaviour of one mole of an ideal gas at one atmospheric pressure?
View Solution

