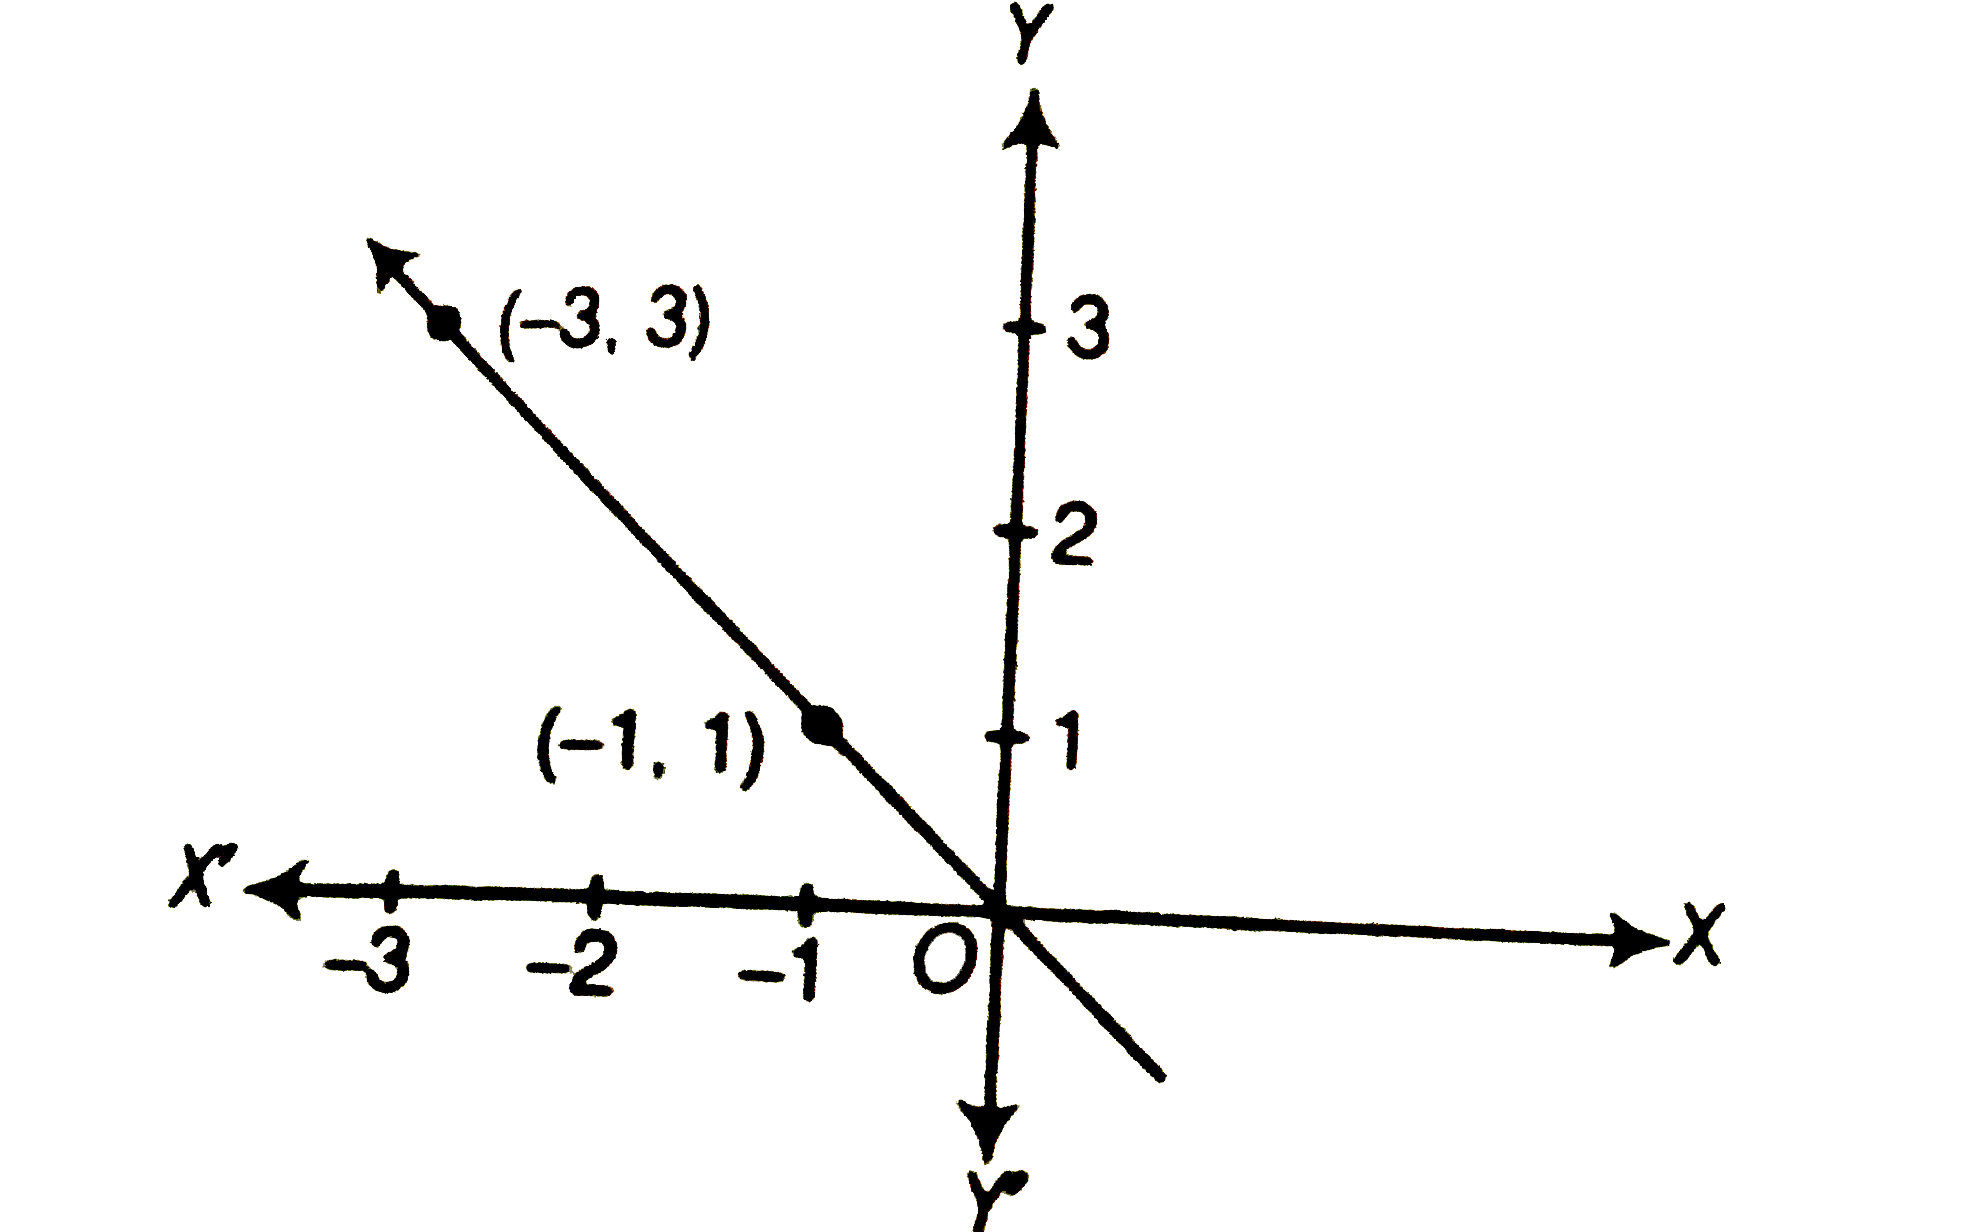
The graph given below represents the linear equation x+y=0.
Video Solution
Text Solution
True
If the given points (−1,1) and (−3,3) lie on the linear equation x+y=0, then both points will satisfy the equation.
So, at point (−1,1) we put x=-1 and y=1 in LHS of the given equation, we get
LHS=x+y=−1+1=0=RHS
Again, at point (−3,3) put x=-3 and y=3 in LHS of the given equation, we get
LHS =x+y=−3+3=0= RHS
Hence, (−1,1) and (−3,3) both satisfy the given linear equation x+y=0.
|
Topper's Solved these Questions
Similar Questions
Knowledge Check
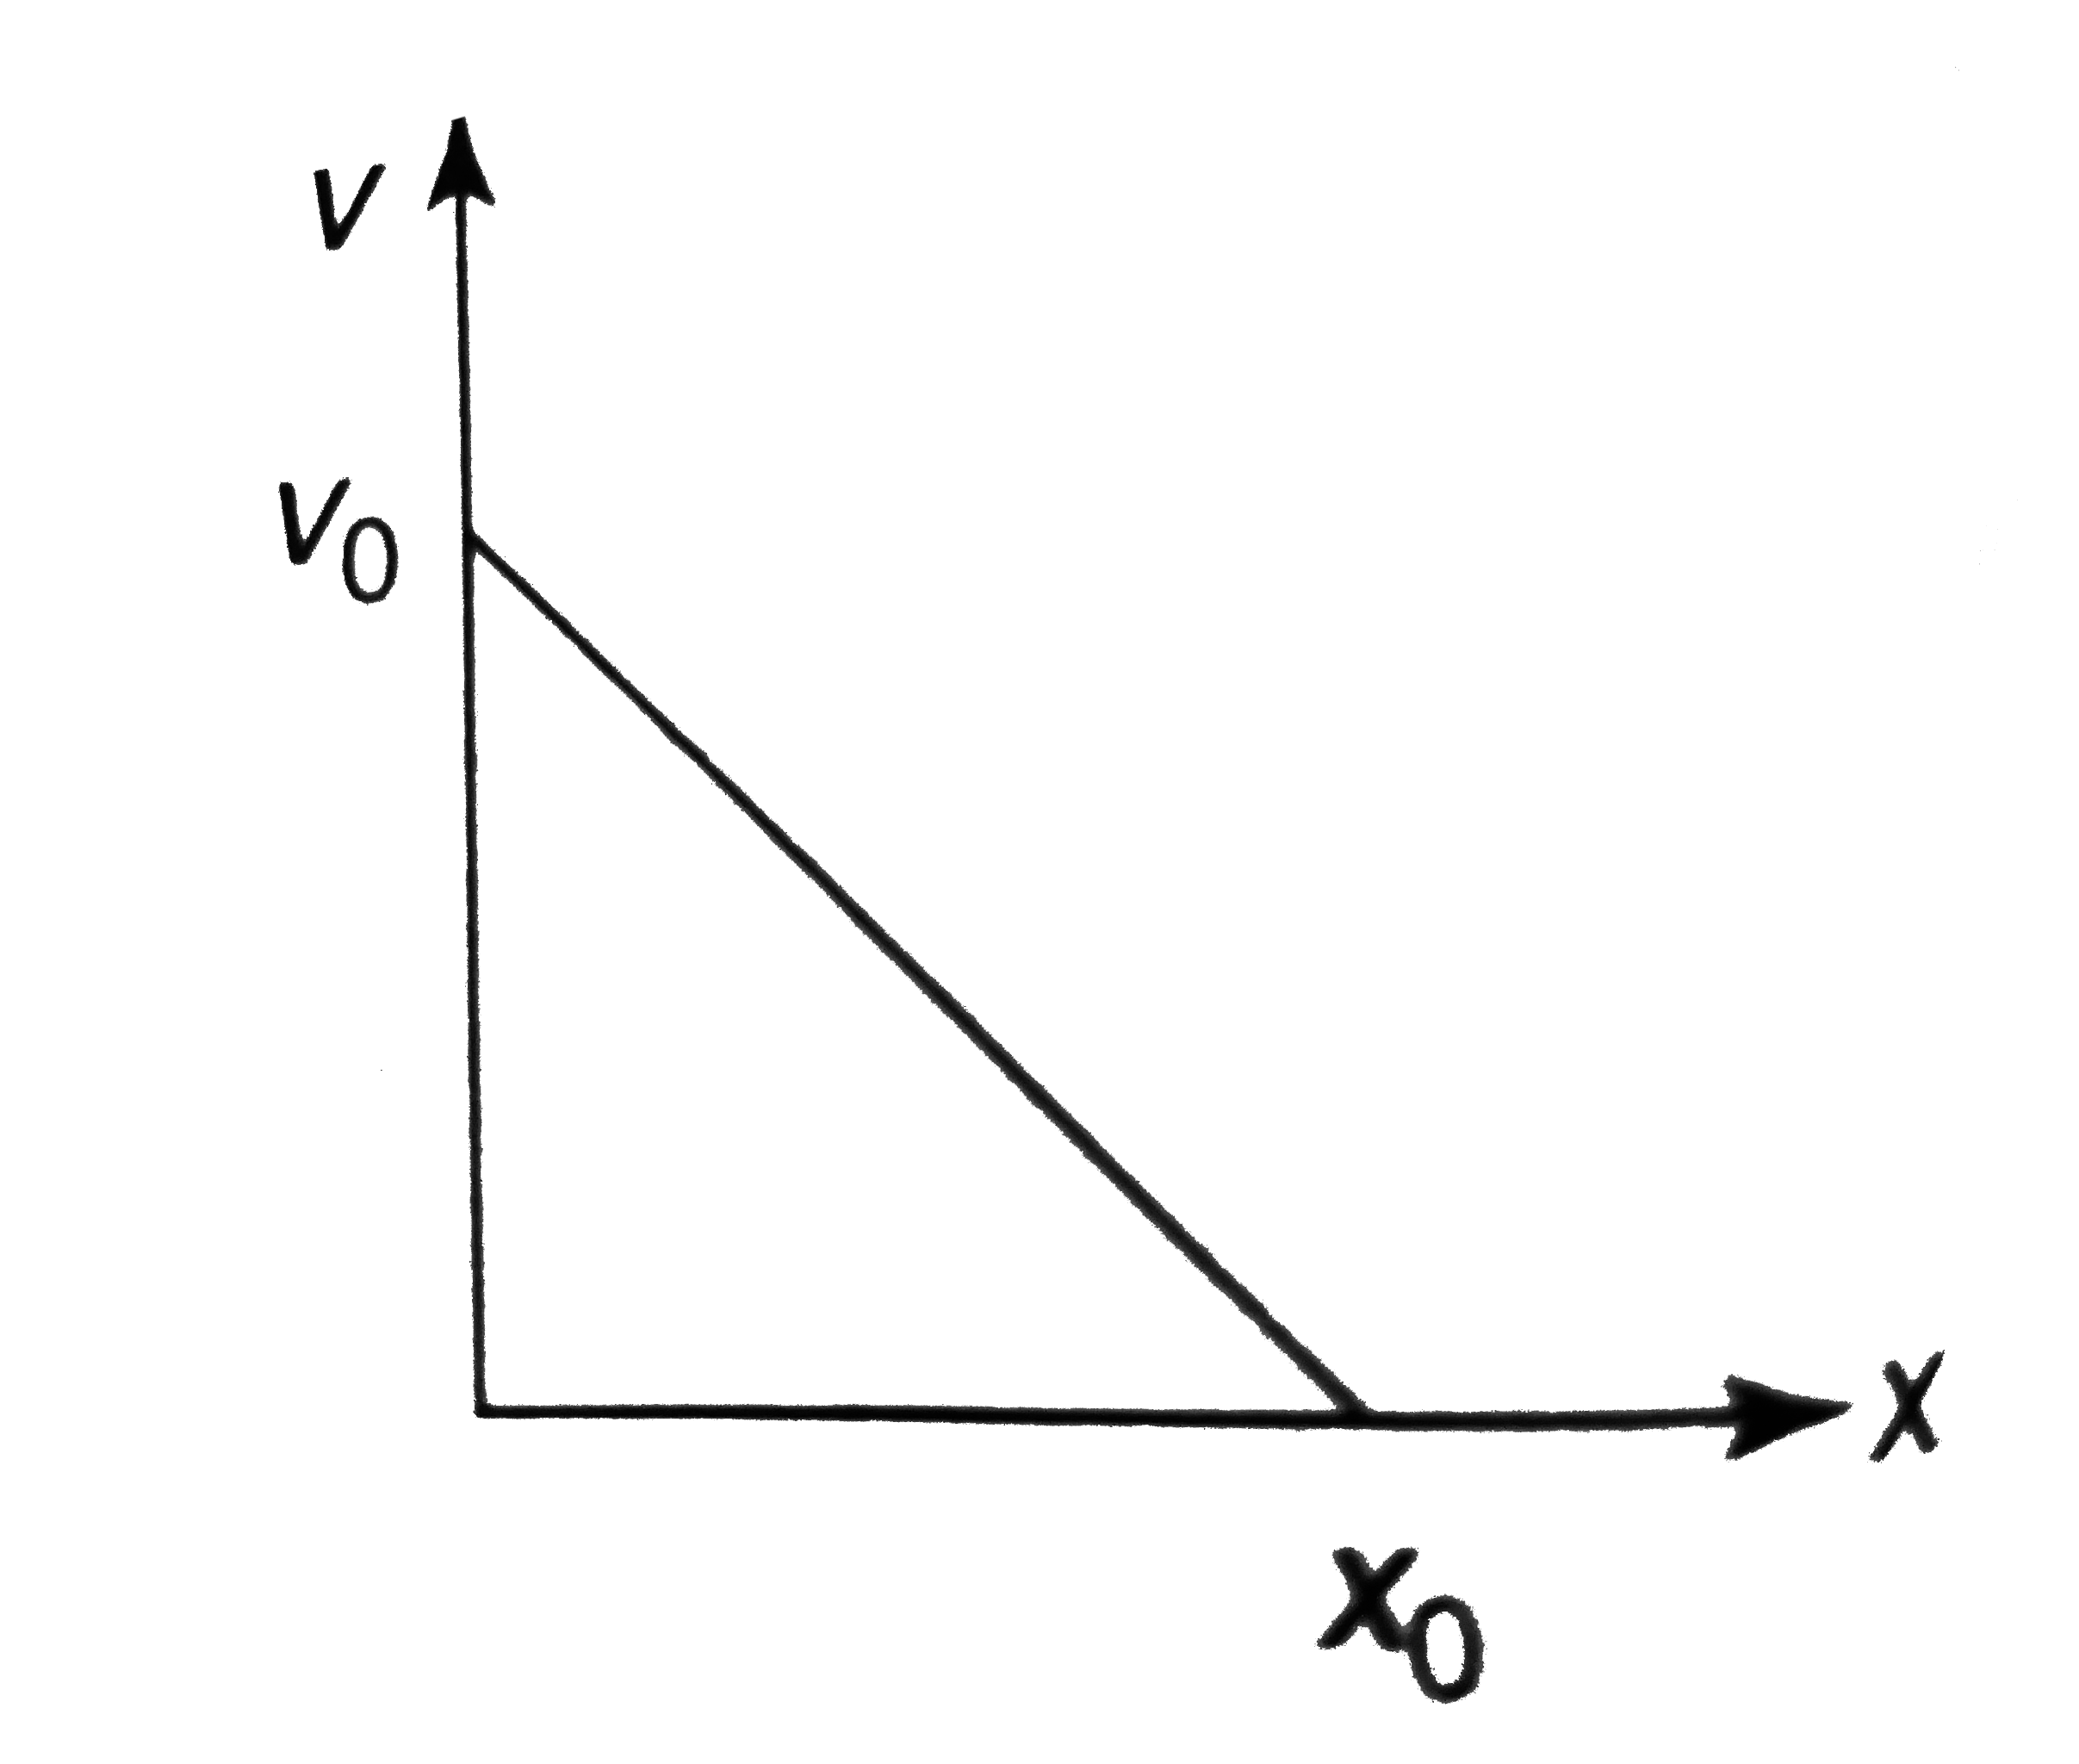
The given graph shows the variation of velocity with displacement. Which one of the graphs given below correctly represents the variation of acceleration with displacement ?
 A
A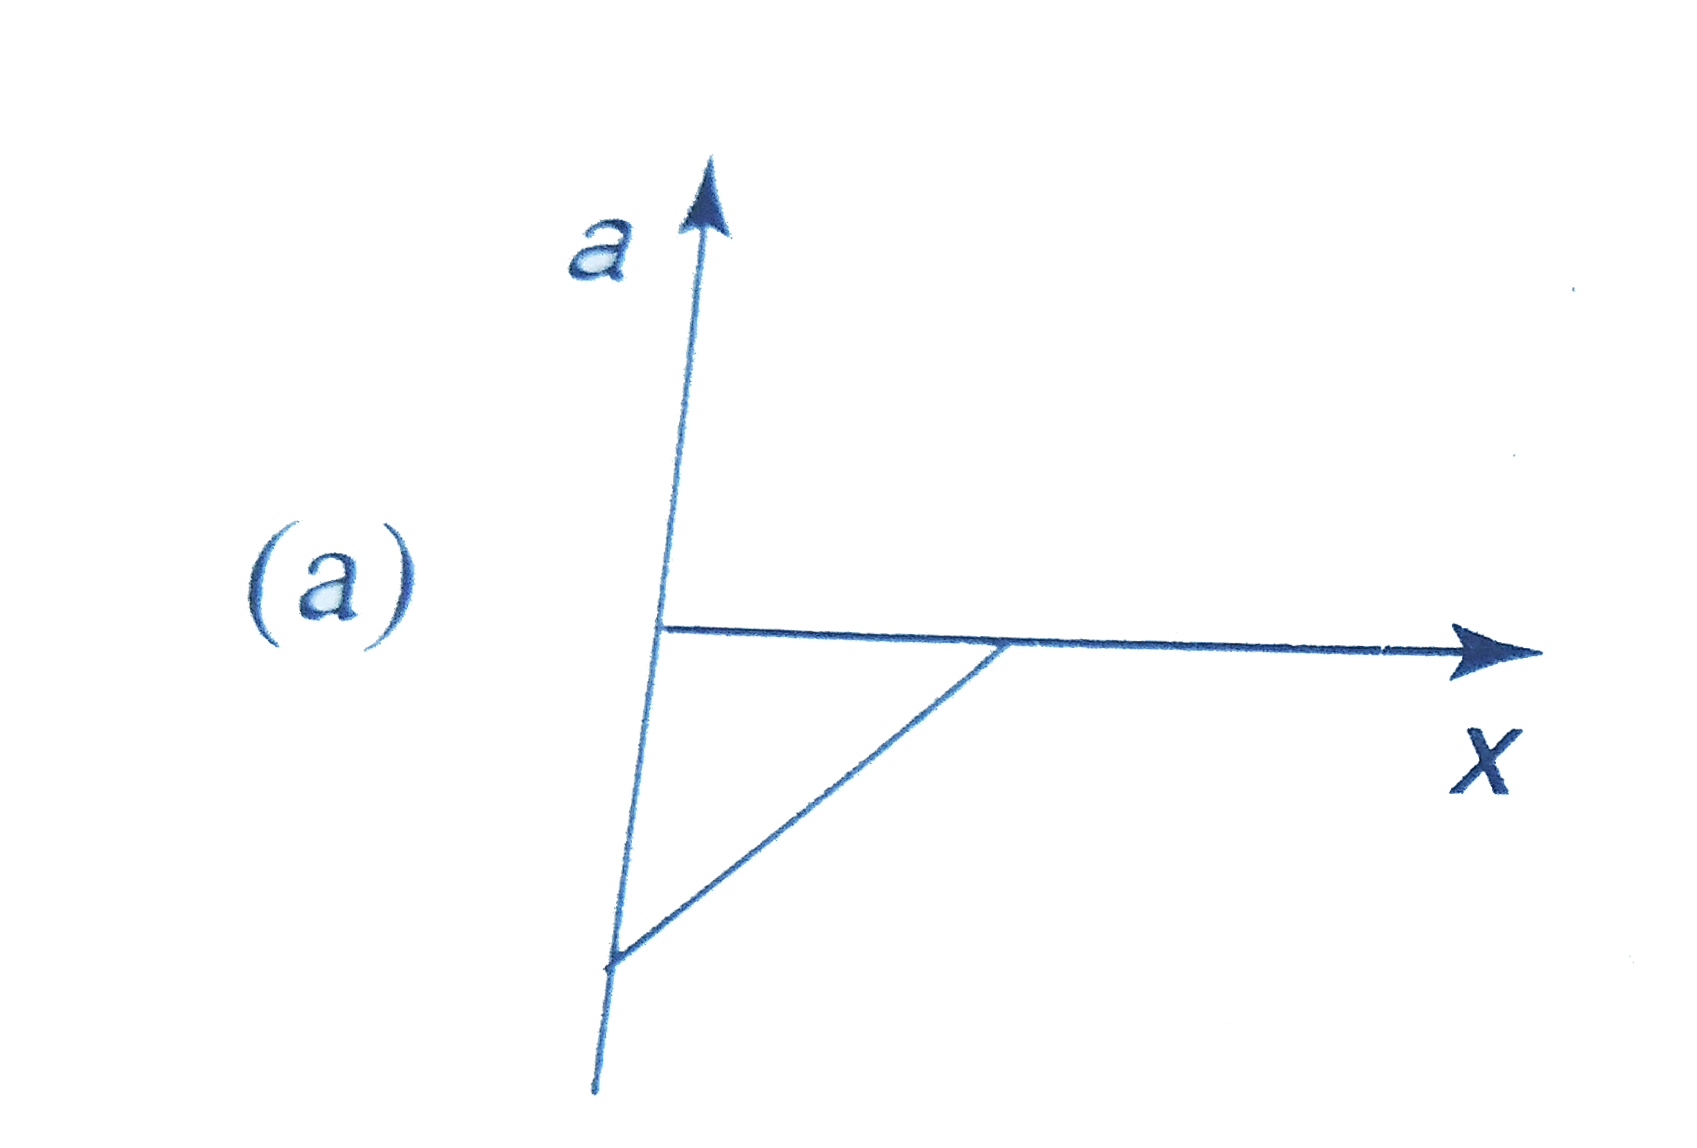 B
B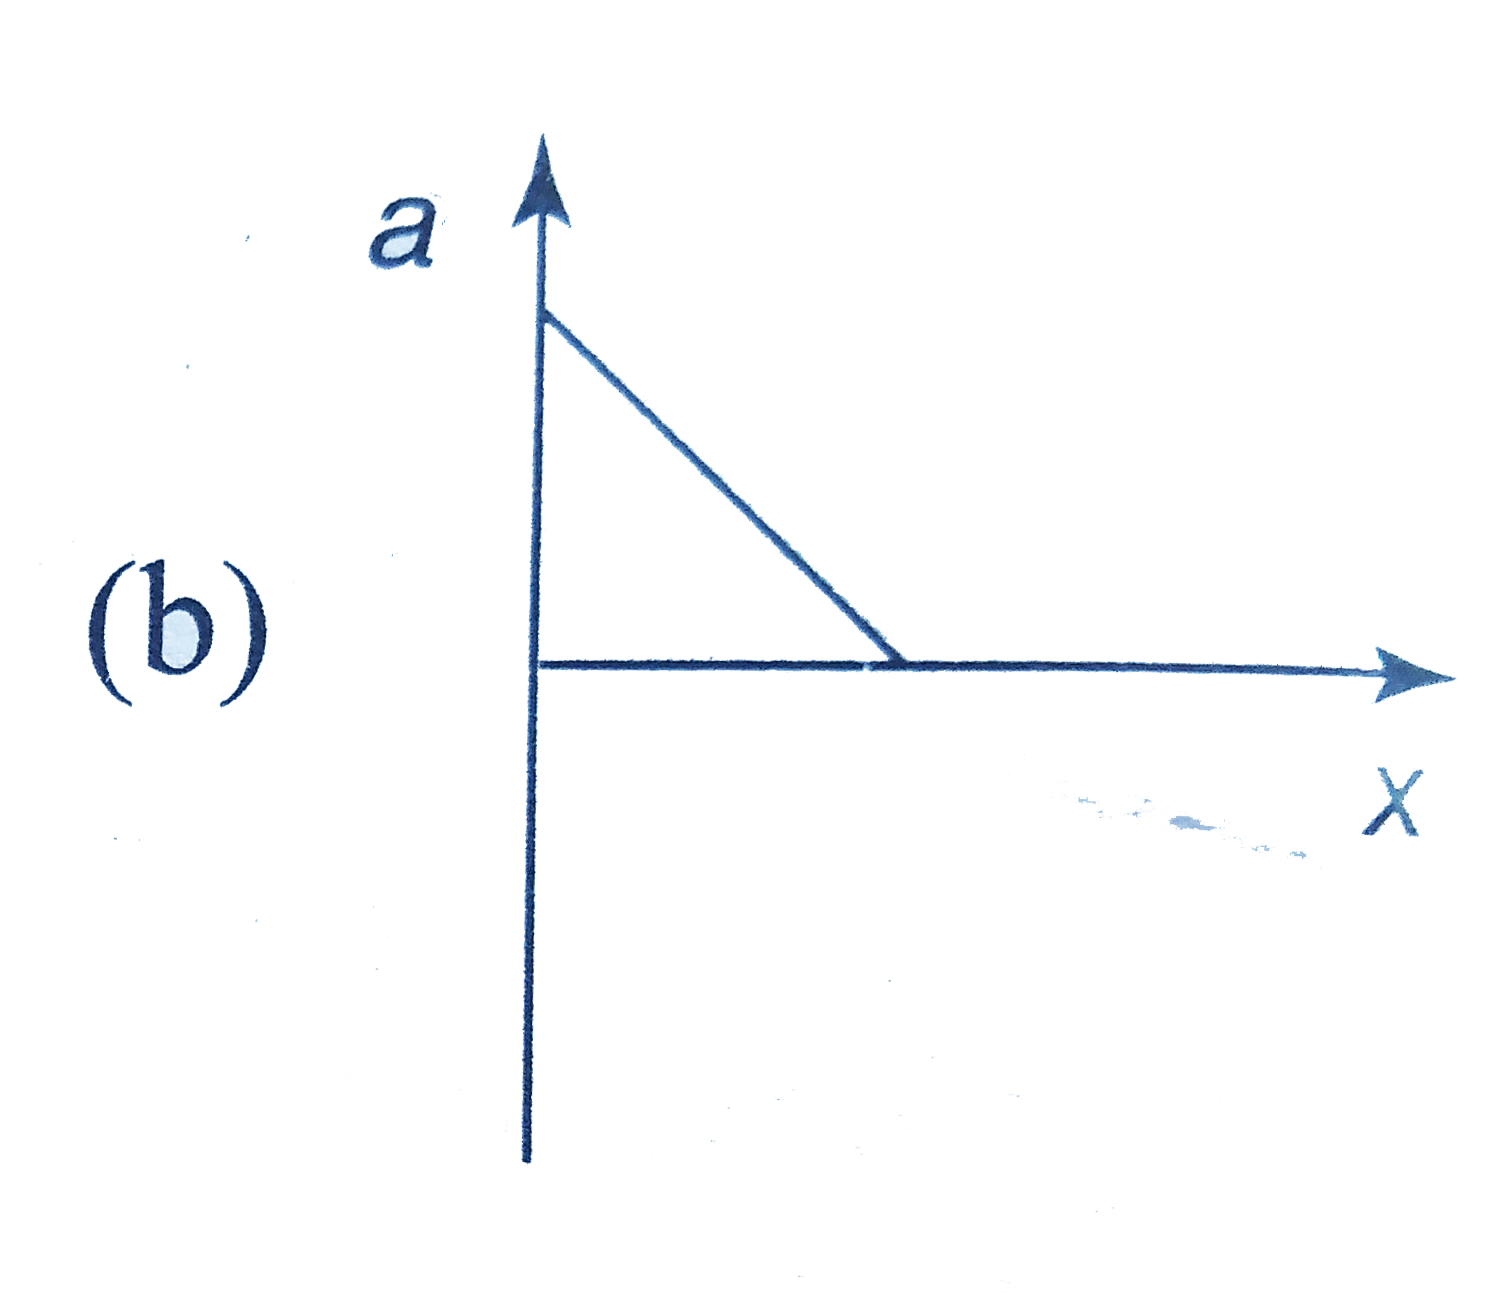 .C
.C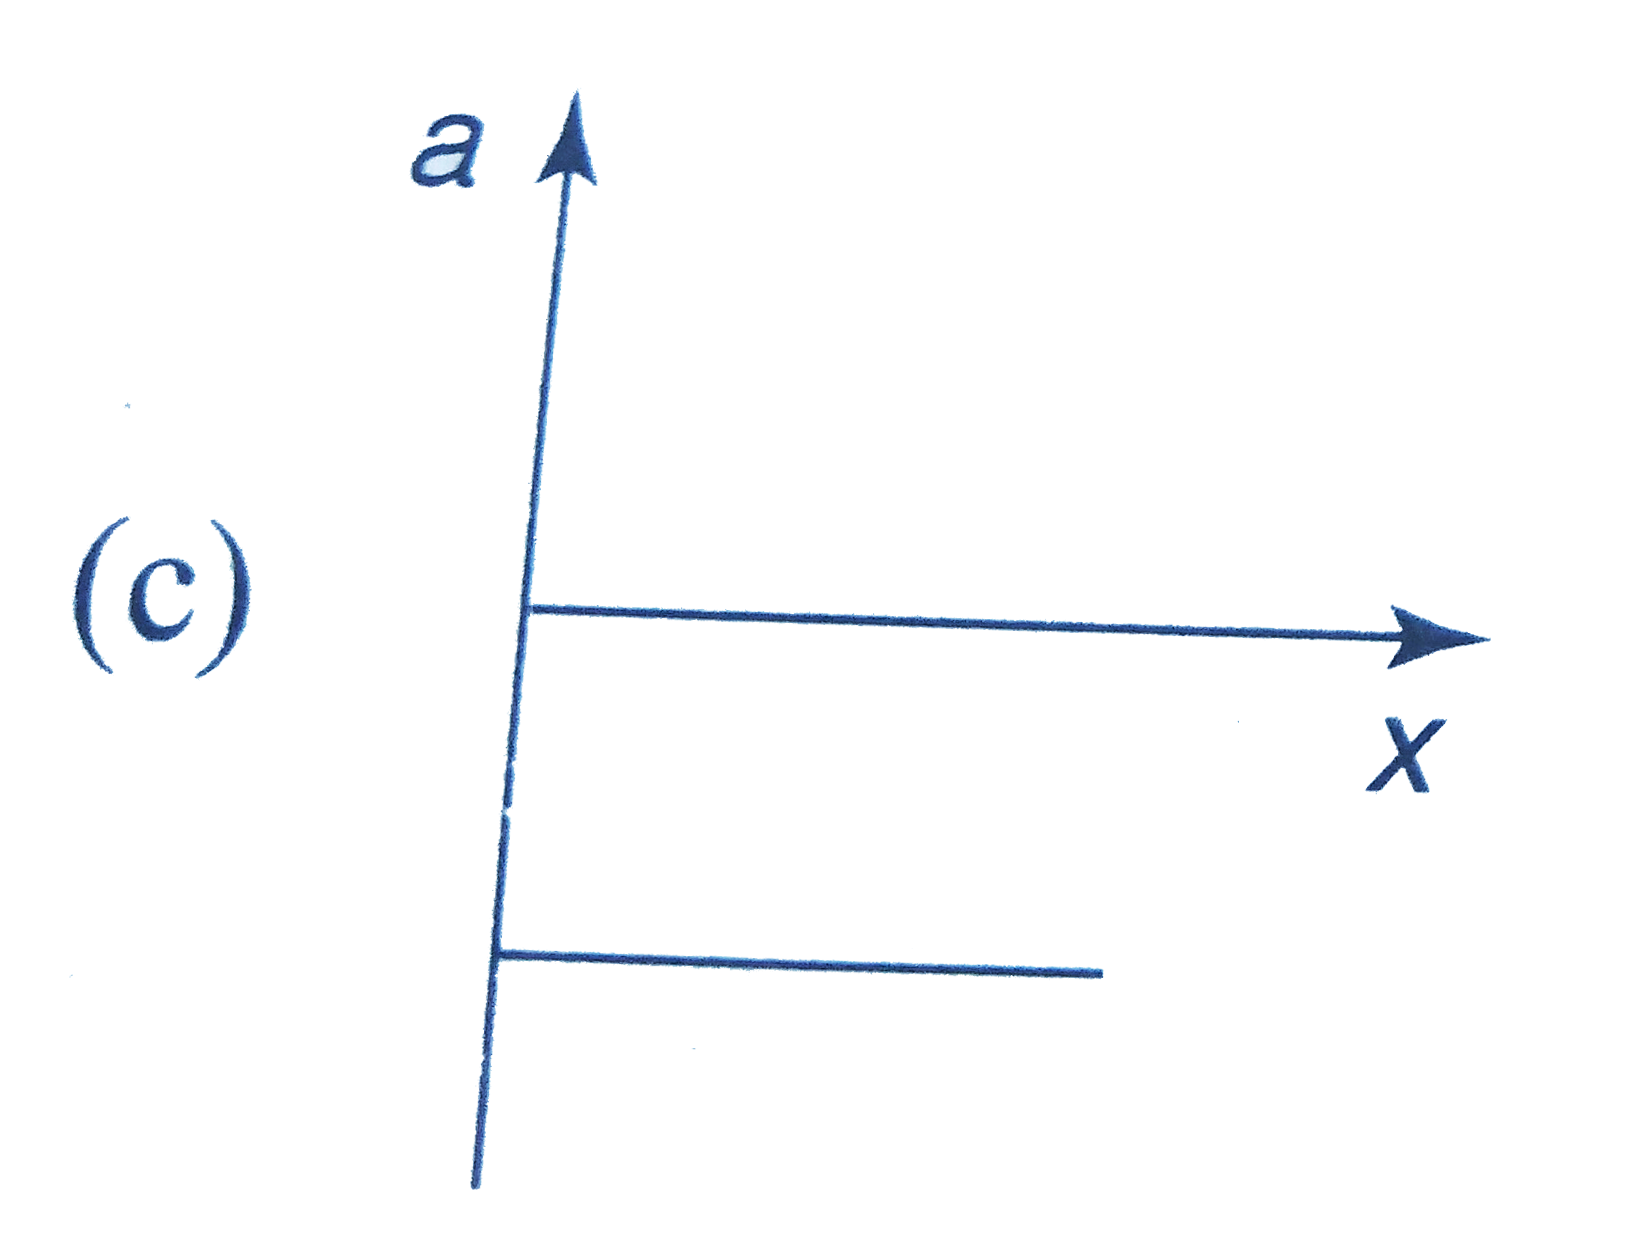 .D
.D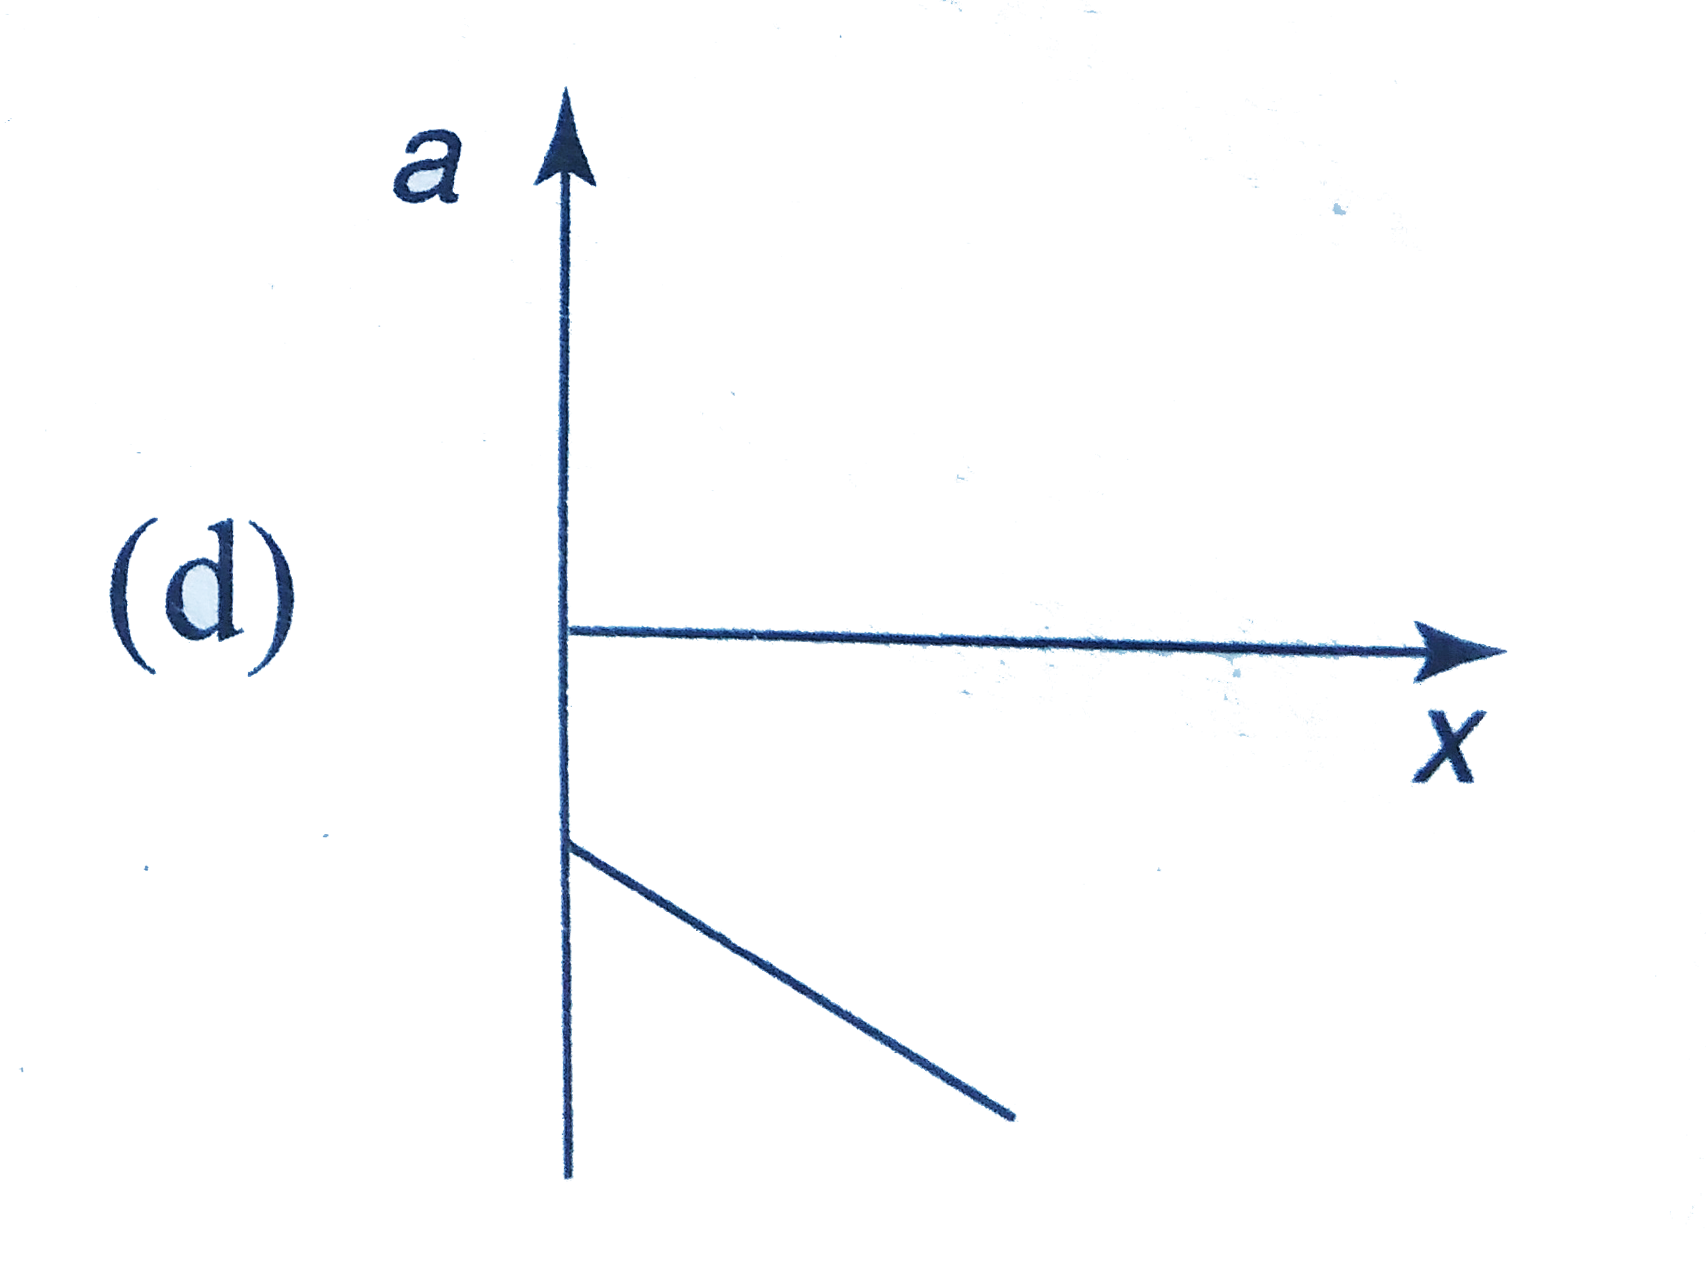 .
.The shaded region given below represents the constraints (other than x≥0,y≥0)
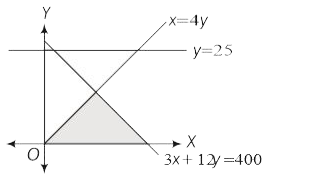 A3x+4y≤400,y≤25,x≤4yB3x+12y≥400,y≤25,x≥4yC3x+12y≤400,y≤25,x≥4yDnone of these
The shaded region given below represents the constraints (other than x≥0,y≥0)
 A3x+4y≤400,y≤25,x≤4yB3x+12y≥400,y≤25,x≥4yC3x+12y≤400,y≤25,x≥4yDNone of the above
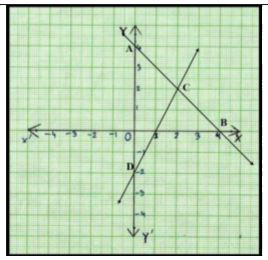
Given below is the graph representing two linear equations by lines AB and CD respectively. What is the area of the triangle formed by these two lines and the line x=0?
View SolutionFor the graphs given below, write down their x−y equations

View SolutionDraw the graph of linear equation x+2y=6
View SolutionDraw the graph of equation, x+y =0
View SolutionThe angle between the graph of the linear equation 239x−239y+5=0 and the x - axis is
View Solution

