Show that pressure of a fixed amount of an ideal gas is a state function V=nRTP
(∂V∂T)p=nRP⇒∂∂P[(∂V∂T)p]T=−nRP2
(∂V∂T)T=−nRTP2=∂∂T[(∂V∂P)T]P=−nRP2
Topper's Solved these Questions
Similar Questions
Knowledge Check
For fixed amount of an ideal gas identify the incorrect graph :
A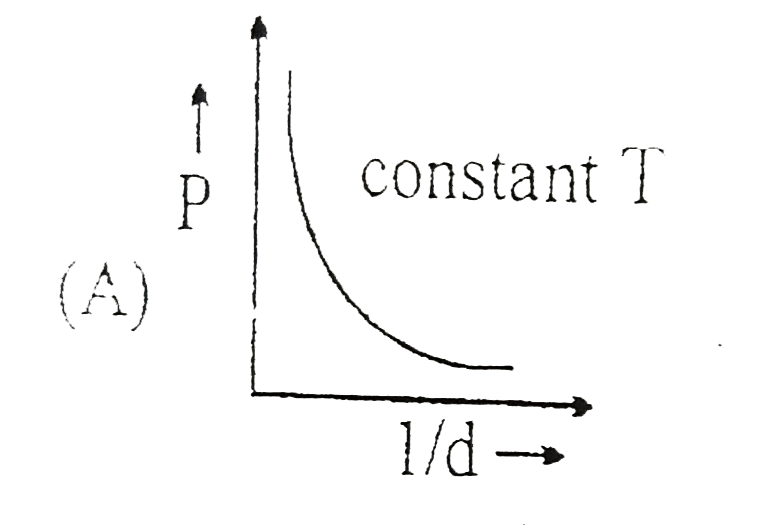 B
B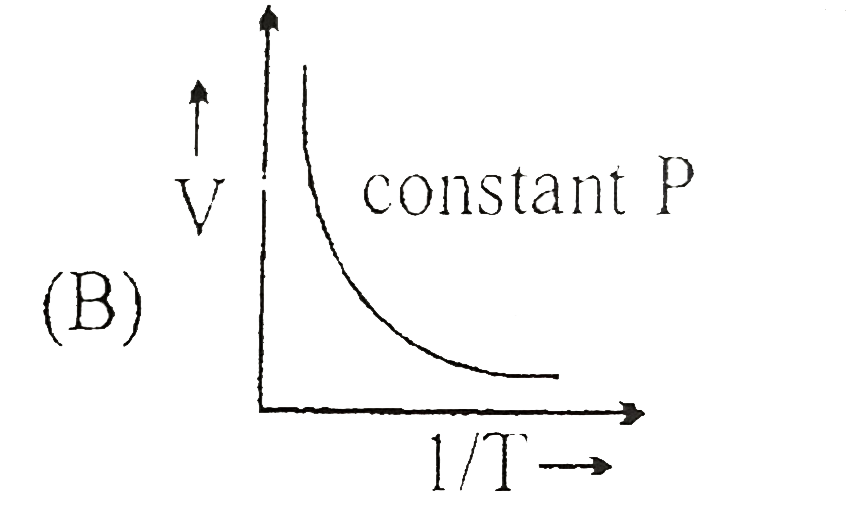 C
C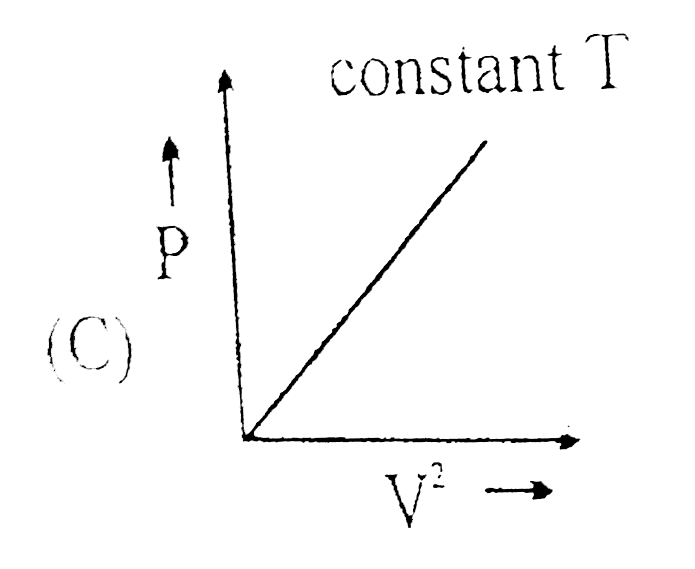 D
D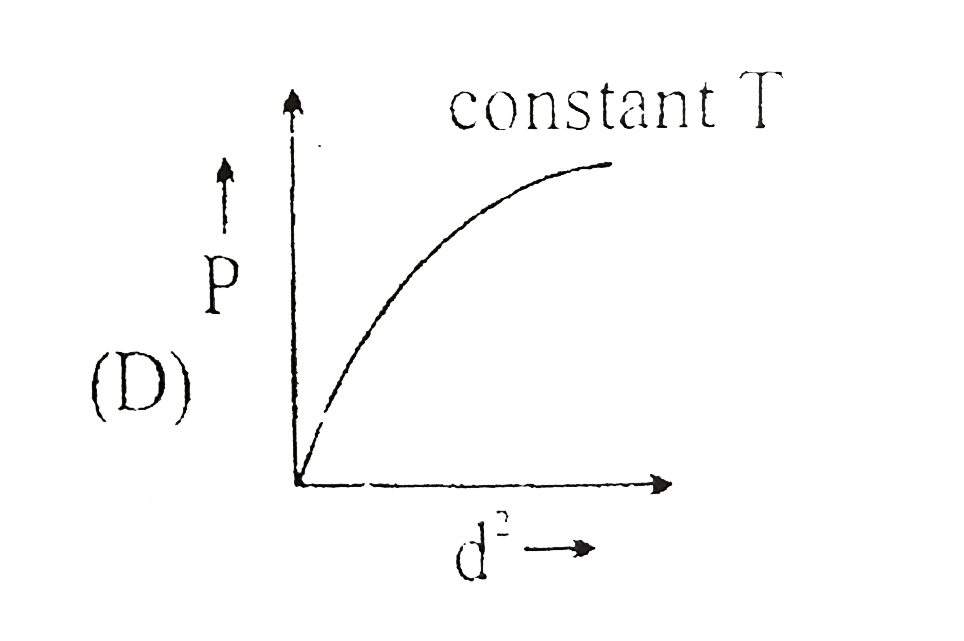
Which of the following is a correct plot of the volume of fixed amount of ideal gas as a function of temperature (at constant pressure)
A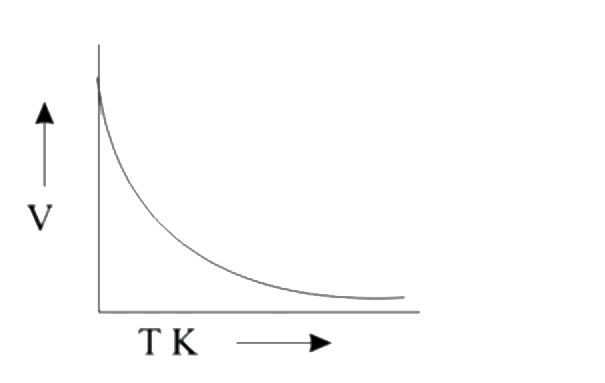 B
B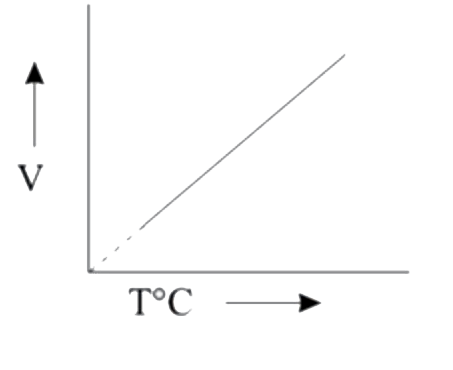 C
C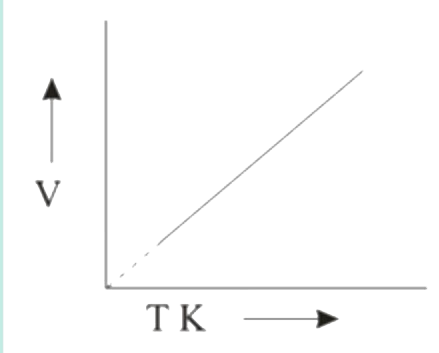 D
D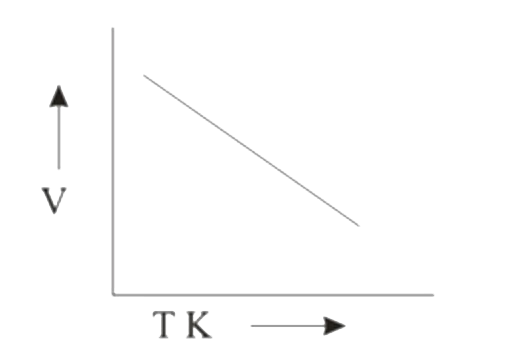
During an adiabatic process , the pressure p of a fixed mass of an ideal gas change by Δpand its volume V change by ΔV . If γ=Cp/Cv then ΔV/V is given by
A−ΔppB−γΔppC−ΔpγpDΔpγ2p
Figure shows a process for a given amount of an ideal gas. If volume in state 1 is V1 & in state 2 is V2, then
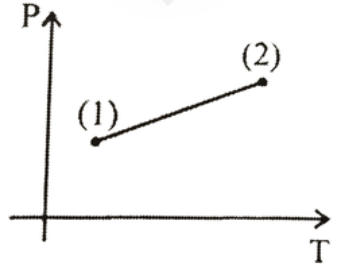
View SolutionWhich of the following is a correct plot of the volume of fixed amount of ideal gas as a function of temperature (at constant pressure)
View SolutionWhen a sample of ideal gas is changed from an initial state to a final state, various curves can be plotted for the process like P-V curve, V-T curve,P-T curve etc.
For example, P-V curve for a fixed amount of an ideal gas at constant temperature is a rectangular hyperbola, V-T curve for a fixed amount of an ideal gas at constant volume is again a straight line. However, the shapes may vary if the constant parameters are also changed.
Now, answer the following questions :
Which of the following graphs is not possible for a fixed amount of ideal gas upon moving from initial state A to final state B :
View SolutionWhen a sample of ideal gas is changed from an initial state to a final state, various curves can be plotted for the process like P-V curve, V-T curve,P-T curve etc.
For example, P-V curve for a fixed amount of an ideal gas at constant temperature is a rectangular hyperbola, V-T curve for a fixed amount of an ideal gas at constant volume is again a straight line. However, the shapes may vary if the constant parameters are also changed.
Now, answer the following questions :
The figure shows the effect of pressure on the compressibility factor, Z of a gas :
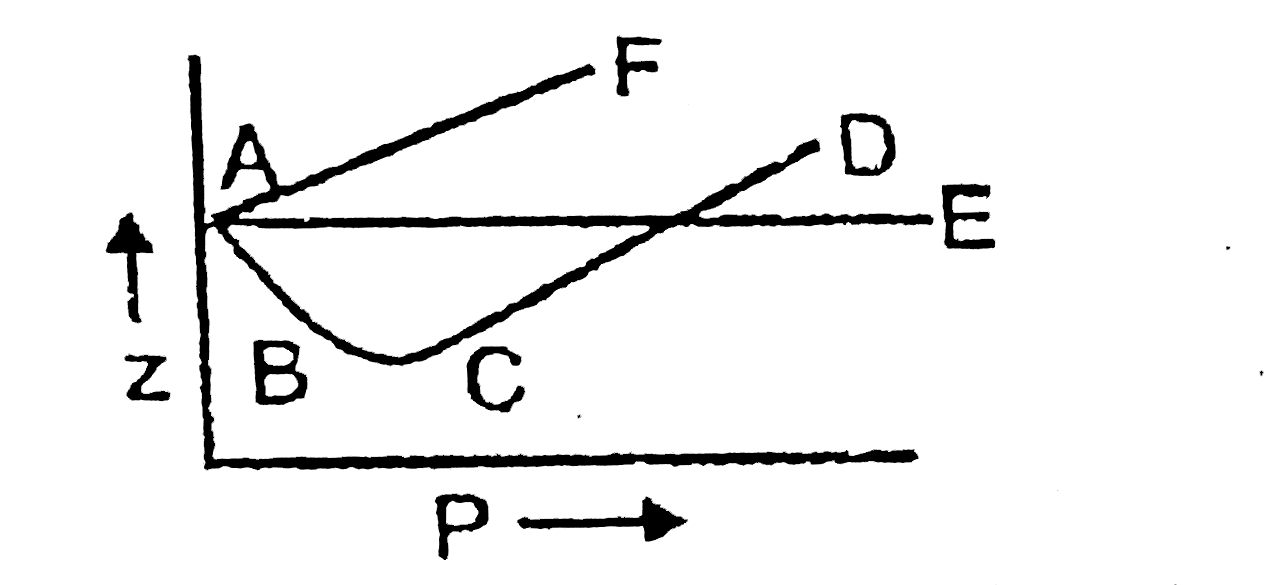
View Solution
