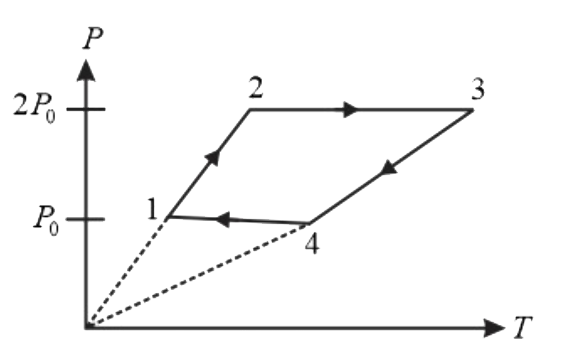
Figure shows a process for a given amount of an ideal gas. If volume in state 1 is V1 & in state 2 is V2, then
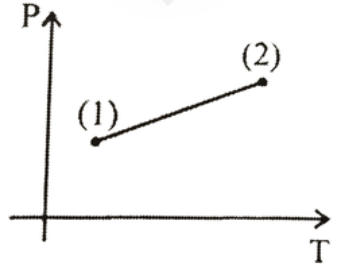
V1>V2
V1<V2
V1=V2
None
The correct Answer is:B
Step by step video & image solution for Figure shows a process for a given amount of an ideal gas. If volume in state 1 is V_(1) & in state 2 is V_(2), then by Physics experts to help you in doubts & scoring excellent marks in Class 12 exams.
Updated on:21/07/2023Topper's Solved these Questions
- RACEBook:ALLENChapter:RACEExercise:Basic Maths (Thermal Physics) (Thermodynamic process)
Explore 20 Videos
- RACEBook:ALLENChapter:RACEExercise:Basic Maths (Dscillations) (Kinematics of SHM)
Explore 20 Videos
- RACEBook:ALLENChapter:RACEExercise:Basic Maths (Thermal Physics) (Mode of Heat Transfer)
Explore 14 Videos
- NEWTONS LAWS OF MOTIONBook:ALLENChapter:NEWTONS LAWS OF MOTIONExercise:EXERCISE-III
Explore 28 Videos
- SIMPLE HARMONIC MOTIONBook:ALLENChapter:SIMPLE HARMONIC MOTIONExercise:Example
Explore 1 Video
Similar Questions
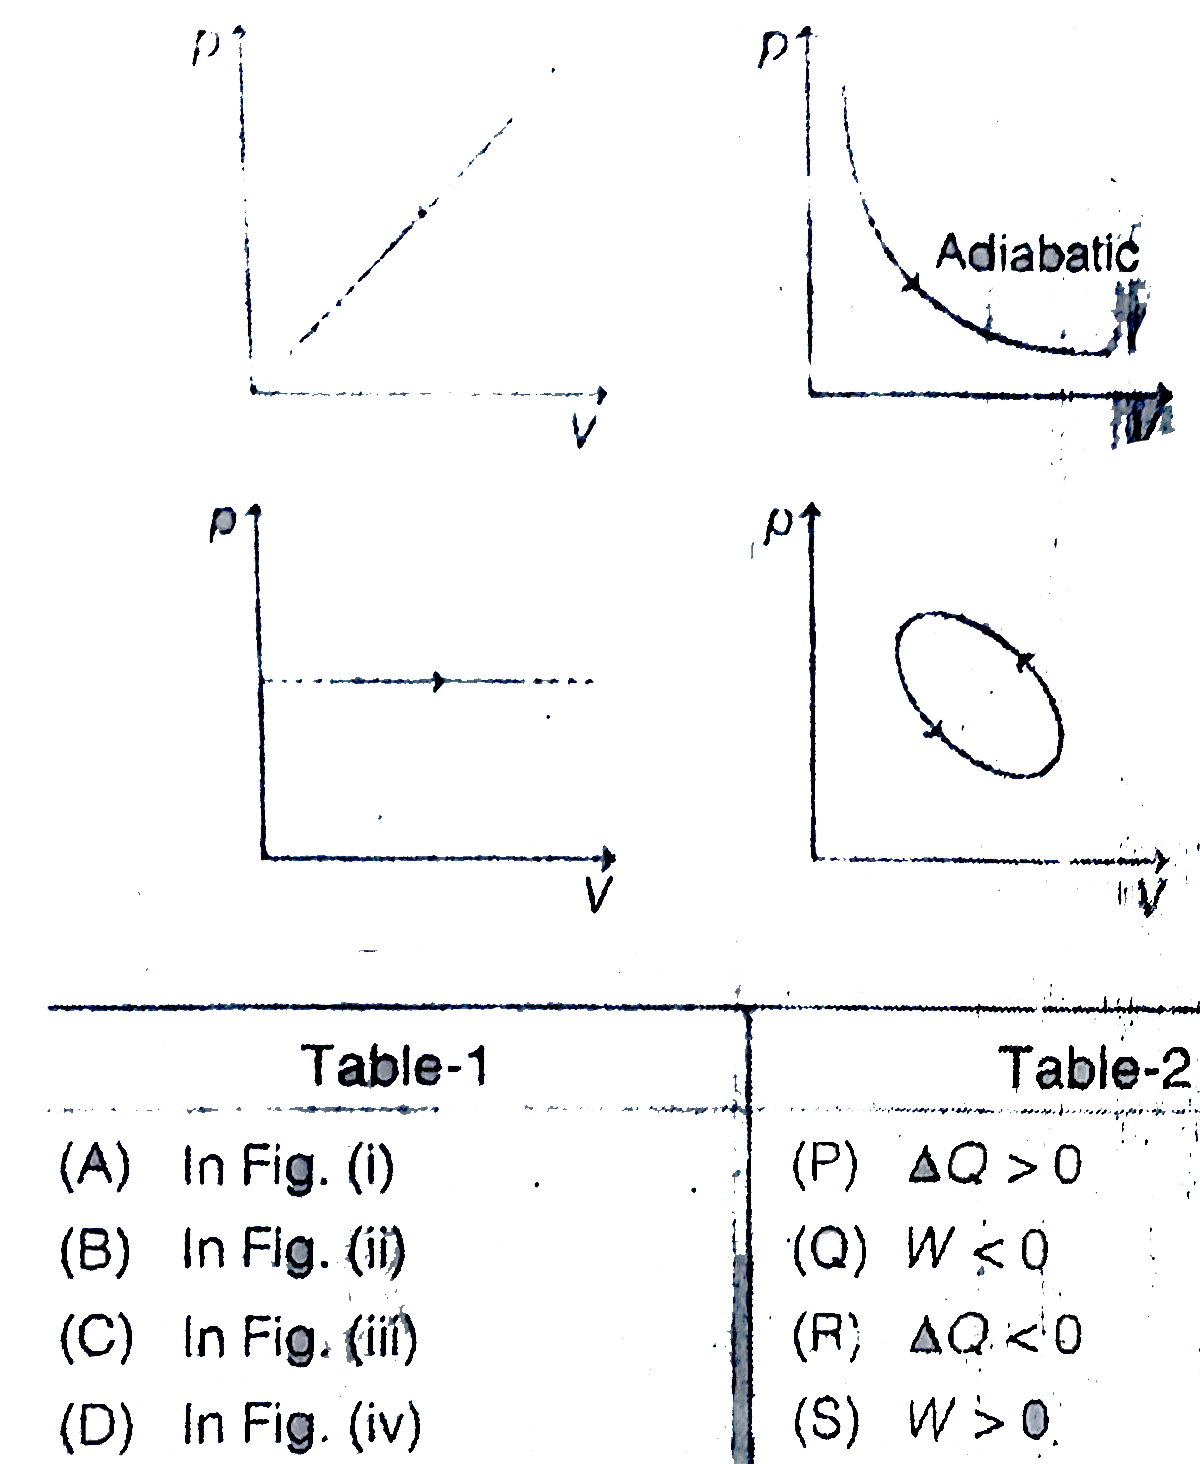
The figures given below show different processes (relating pressure P and volume V) for a given amount of an ideal gas. W is work done by the gas and ΔQ is heat absorbed by the gas.
View SolutionWhen a sample of ideal gas is changed from an initial state to a final state, various curves can be plotted for the process like P-V curve, V-T curve,P-T curve etc.
For example, P-V curve for a fixed amount of an ideal gas at constant temperature is a rectangular hyperbola, V-T curve for a fixed amount of an ideal gas at constant volume is again a straight line. However, the shapes may vary if the constant parameters are also changed.
Now, answer the following questions :
Which of the following graphs is not possible for a fixed amount of ideal gas upon moving from initial state A to final state B :
View SolutionWhen a sample of ideal gas is changed from an initial state to a final state, various curves can be plotted for the process like P-V curve, V-T curve,P-T curve etc.
For example, P-V curve for a fixed amount of an ideal gas at constant temperature is a rectangular hyperbola, V-T curve for a fixed amount of an ideal gas at constant volume is again a straight line. However, the shapes may vary if the constant parameters are also changed.
Now, answer the following questions :
Two moles of an ideal gas is changed from its initial state (16 atm, 6L) to final state (4 atm, 15L) in such a way that this change can be represented by a straight line in P-V curve.The maximum temperature attained by the gas during the above change is :(Take : R=112LatmK−1mol−1)
View SolutionWhen a sample of ideal gas is changed from an initial state to a final state, various curves can be plotted for the process like P-V curve, V-T curve,P-T curve etc.
For example, P-V curve for a fixed amount of an ideal gas at constant temperature is a rectangular hyperbola, V-T curve for a fixed amount of an ideal gas at constant volume is again a straight line. However, the shapes may vary if the constant parameters are also changed.
Now, answer the following questions :
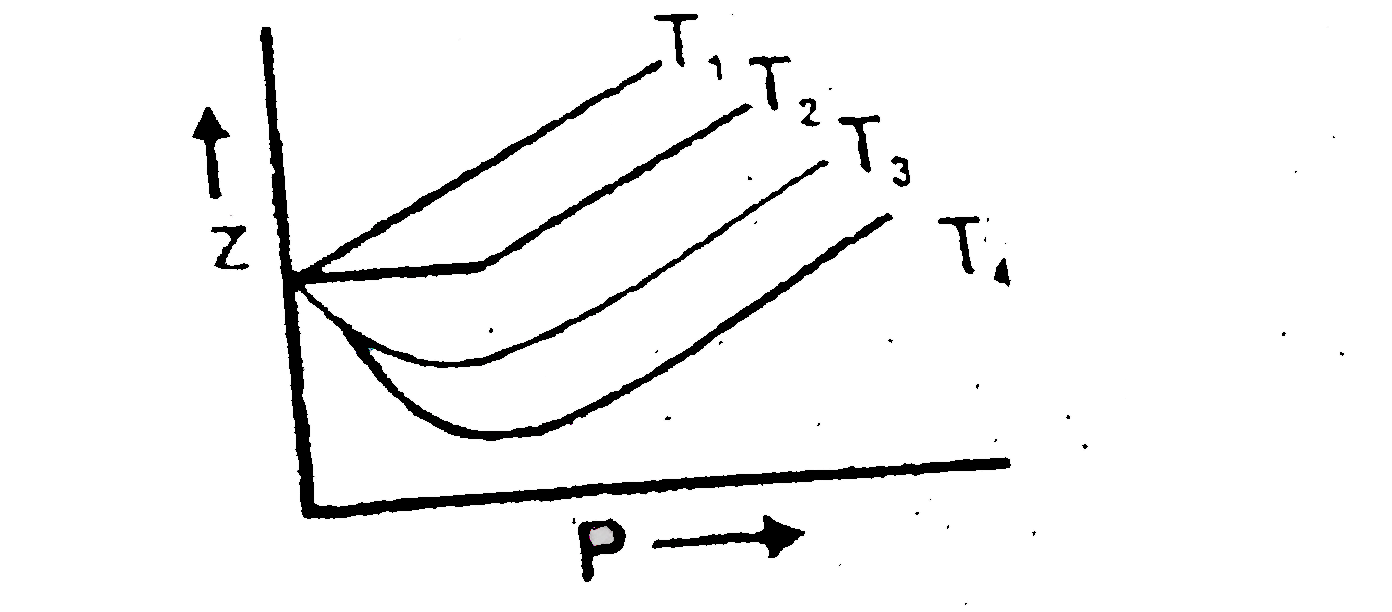
From the given plot between Z and P for a real gas the correct is :
View SolutionThe pressure p and volume V of an ideal gas both increase in a process.
View SolutionThe pressure P and volume V of an ideal gas both decreases in a process.
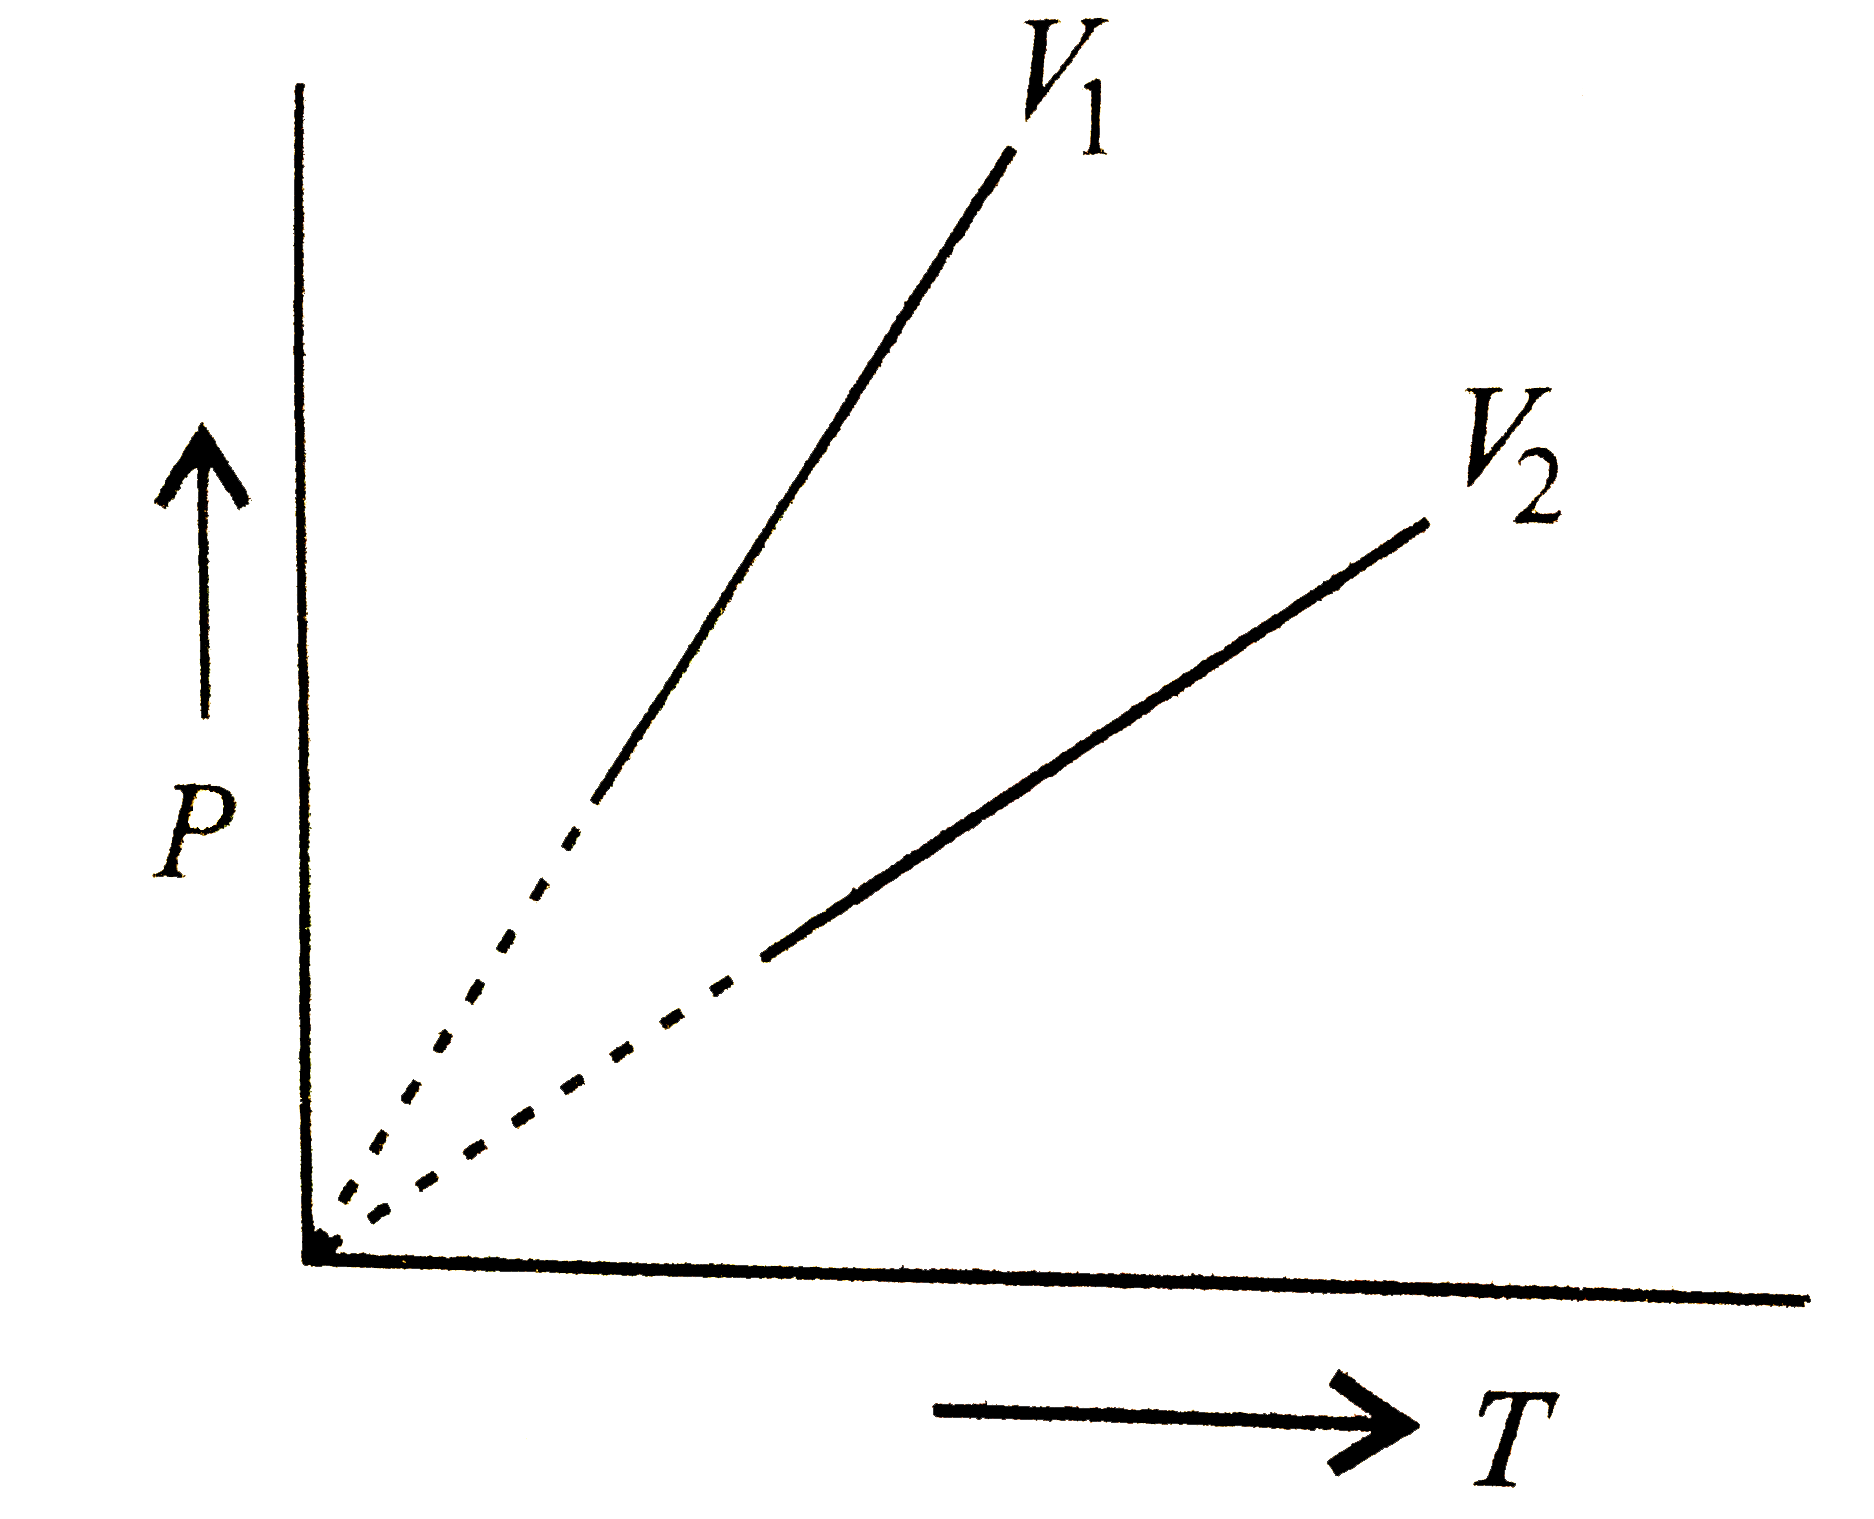
View SolutionA plot of P vs T for a given mass of gas at constant volume is a straight line . P vs T at constant volumes V1 and V2 for an ideal gas are shown below :
Which of the following is correct ?
View SolutionFigure shows volume - temperature (V-T) graph for same mass of an ideal gas at two different pressures P1and P2. Hence
View SolutionOne mole of an ideal monoatomic gas undergoes a cyclic process, as shown in the figure. If the temperature of the gas at state 1 is 300 K and at state 4 is 500 K, then heat exchanged during process 2→3, is
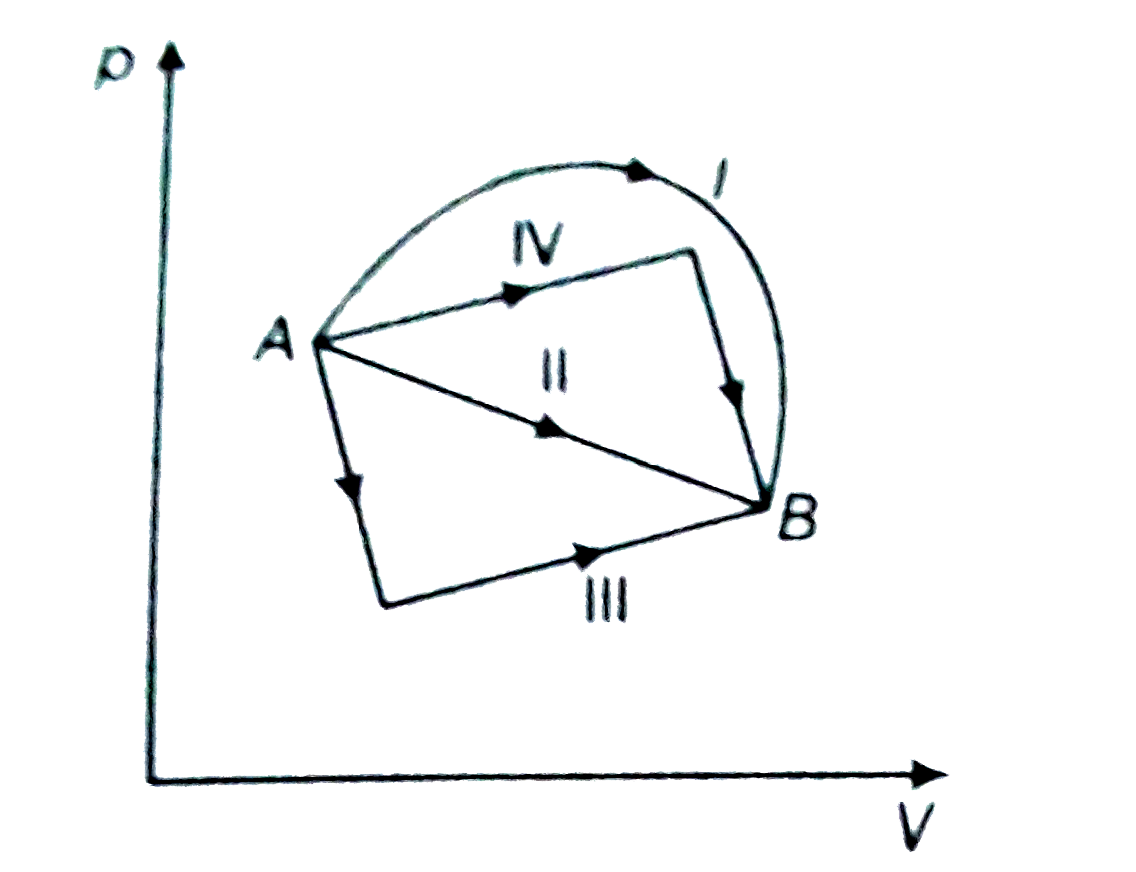
View SolutionFigure shows the p−V diagram of an ideal gas undergoing a change of state from A to B. Four different parts I, II, III and IV as shown in the figure may lead to the same change of state. ltBrgt
View Solution
