The data given below shows a number of hours spent by a school boy on different activities on a working day.

Represent the above data by a pie chart.
Step by step video & image solution for The data given below shows a number of hours spent by a school boy on different activities on a working day. Represent the above data by a pie chart. by Maths experts to help you in doubts & scoring excellent marks in Class 8 exams.
Updated on:21/07/2023Topper's Solved these Questions
- PIE CHARTS BOOK - RS AGGARWALCHAPTER - PIE CHARTS EXERCISE - Exercise 24B
4 Videos
- PIE CHARTS BOOK - RS AGGARWALCHAPTER - PIE CHARTS EXERCISE - Exercise 24B
4 Videos
- PERCENTAGEBOOK - RS AGGARWALCHAPTER - PERCENTAGEEXERCISE - TEST PAPER -9 ( TRUE AND FALSE )
4 Videos
- PLAYING WITH NUMBERSBOOK - RS AGGARWALCHAPTER - PLAYING WITH NUMBERSEXERCISE - Test Paper-5
11 Videos
Similar Questions
The number of hours spent by a school boy in different activities in a day is given below :

Represent the above information using a pie diagram.
View SolutionThe number of hours spent by a school boy in different activities in a day is given below:

Represent the above information using pie diagram.
View Solution
Knowledge Check
A pie diagram represents the number of hours spent by a school boy in different activites in a day. If 7 hours are spent in school, then what is the measure of the central angle?
A210∘B105∘C52.5∘D90∘
The following table shows the percentage of buyers of four different brands of bathing soaps.

Represent the above data by a pie chart.
View SolutionThe number of hours, spent by a school boy on different activities in a working day, is given below: Activities, Sleep, School, Home, Play, others, Total No. Of hours, 8, 7, 4, 2, 3, 24 Present the information in the form of a pie-chart.
View SolutionThe pie-chart given below shows the number of students enrolled in a school in different activities. Total number of students in the school is 1200. Study the chart and answer the questions.
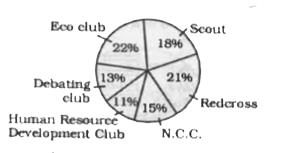
How many students are enrolled in N.C.C. activities ?
View SolutionThe pie-chart given below shows the number of students enrolled in a school in different activities. Total number of students in the school is 1200. Study the chart and answer the questions.
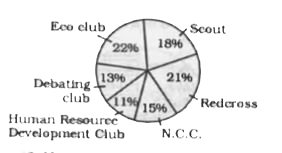
Which two clubs have the enrolment in the ratio of 2:1 ?
View SolutionThe pie-chart given below shows the number of students enrolled in a school in different activities. Total number of students in the school is 1200. Study the chart and answer the questions.
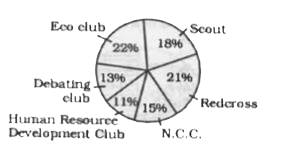
What is the ratio of number of students enrolled in Scout and Redcross activities together to those enrolled in Debating Club activities ?
View SolutionThe pie-chart given below shows the number of students enrolled in a school in different activities. Total number of students in the school is 1200. Study the chart and answer the questions.
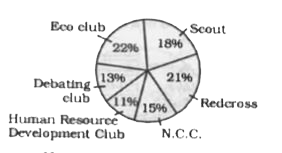
The number of students enrolled in Eco-club is what per cent of those enrolled in Redcross activities ?
View SolutionThe pie-chart given below shows the number of students enrolled in a school in different activities. Total number of students in the school is 1200. Study the chart and answer the questions.
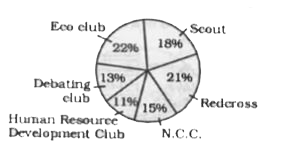
What is the total number of students enrolled in Debating Club and HRD Club ?
View Solution
