The following data shows the agricultural production in India during a certain year.

Represent the above data by a pie chart.
Step by step video & image solution for The following data shows the agricultural production in India during a certain year. Represent the above data by a pie chart. by Maths experts to help you in doubts & scoring excellent marks in Class 8 exams.
Updated on:21/07/2023Topper's Solved these Questions
- PIE CHARTS BOOK - RS AGGARWALCHAPTER - PIE CHARTS EXERCISE - Exercise 24B
4 Videos
- PIE CHARTS BOOK - RS AGGARWALCHAPTER - PIE CHARTS EXERCISE - Exercise 24B
4 Videos
- PERCENTAGEBOOK - RS AGGARWALCHAPTER - PERCENTAGEEXERCISE - TEST PAPER -9 ( TRUE AND FALSE )
4 Videos
- PLAYING WITH NUMBERSBOOK - RS AGGARWALCHAPTER - PLAYING WITH NUMBERSEXERCISE - Test Paper-5
11 Videos
Similar Questions
The following data shows the agriculture production in India during a certain year.| Food grain | Rice, Wheat Pulses Maize Coarse Cereals Production 106, 74, 24, 4, 20| (in millions of tons)Draw a pie chart to represent the above data.
View SolutionThe following data shows the expenditure of a person on different items during a month. Represent the data by a pie-chart. Items of expenditure, Rent, Education, Food, Clothing, Others Amount (in Rs.), 2700, 1800, 2400, 1500, 2400
View Solution
Knowledge Check
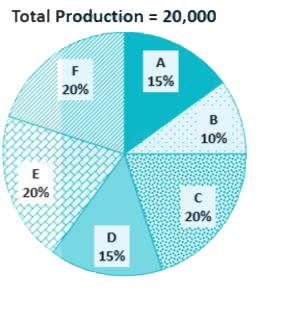
Direction: The following pie chart shows the percentage of production of books by different companies in a year. Read the chart and answers the following questions.

Find the average production of books by company B and C:A6000B3000C4000D5000
The following table shows the percentage of buyers of four different brands of bathing soaps.

Represent the above data by a pie chart.
View SolutionThe following table shows the expenditure of a family whose monthly income is * 22,000.Represent the above data by a pie chart.
View SolutionGiven below is the result of an annual examination of a class, showing the percentage of students in each category .

Represent the above data by a pie chart.
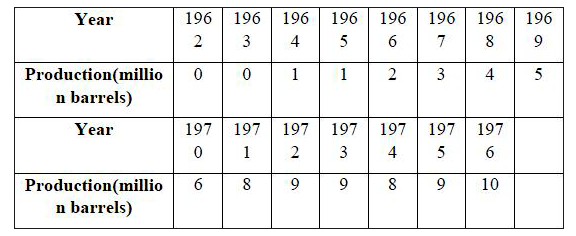
View SolutionThe following table shows the production of gasoline in U.S.A. for the years 1962 to 1976. Obtain trend values for the above data using 5-yearly moving averages.

View SolutionThe following table shows the percentage of people having different blood groups. Draw a pie chart to represent the given data.
Blood groupABCDPercentage of people20452015
View SolutionThe table shows the marks Porpu obtained in an Examination.Subject Math Science English Hindi. Science Computer. Represent the above data by a pie chart.97
View SolutionThe following table shows various sports played by students in a school. Draw a pie chart to represent the given data.
SportsChessCricketCarromsFootballNumber of students35704263
View Solution