The following table gives the number of different fruits kept in a hamper.

Represent the above data by a pie chart.
Step by step video & image solution for The following table gives the number of different fruits kept in a hamper. Represent the above data by a pie chart. by Maths experts to help you in doubts & scoring excellent marks in Class 8 exams.
Updated on:21/07/2023Topper's Solved these Questions
- PIE CHARTS Book:RS AGGARWALChapter:PIE CHARTS Exercise:Exercise 24B
Explore 4 Videos
- PIE CHARTS Book:RS AGGARWALChapter:PIE CHARTS Exercise:Exercise 24B
Explore 4 Videos
- PERCENTAGEBook:RS AGGARWALChapter:PERCENTAGEExercise:TEST PAPER -9 ( TRUE AND FALSE )
Explore 4 Videos
- PLAYING WITH NUMBERSBook:RS AGGARWALChapter:PLAYING WITH NUMBERSExercise:Test Paper-5
Explore 11 Videos
Similar Questions
The following table shows the percentage of buyers of four different brands of bathing soaps.

Represent the above data by a pie chart.
View SolutionThe following table shows the number of fruits in a fruit shop. Represent the above data by a bar graph
View SolutionThe following data shows the expenditure of a person on different items during a month. Represent the data by a pie-chart. Items of expenditure, Rent, Education, Food, Clothing, Others Amount (in Rs.), 2700, 1800, 2400, 1500, 2400
View SolutionThe following table shows the expenditure of a family whose monthly income is * 22,000.Represent the above data by a pie chart.
View SolutionThe following table shows the monthly expenditure of different families on different items :

Represent the data in the form of a sub-divided bar diagram.
View SolutionGiven below is the result of an annual examination of a class, showing the percentage of students in each category .

Represent the above data by a pie chart.
View SolutionThe following table shows the percentage of people having different blood groups. Draw a pie chart to represent the given data.
Blood groupABCDPercentage of people20452015
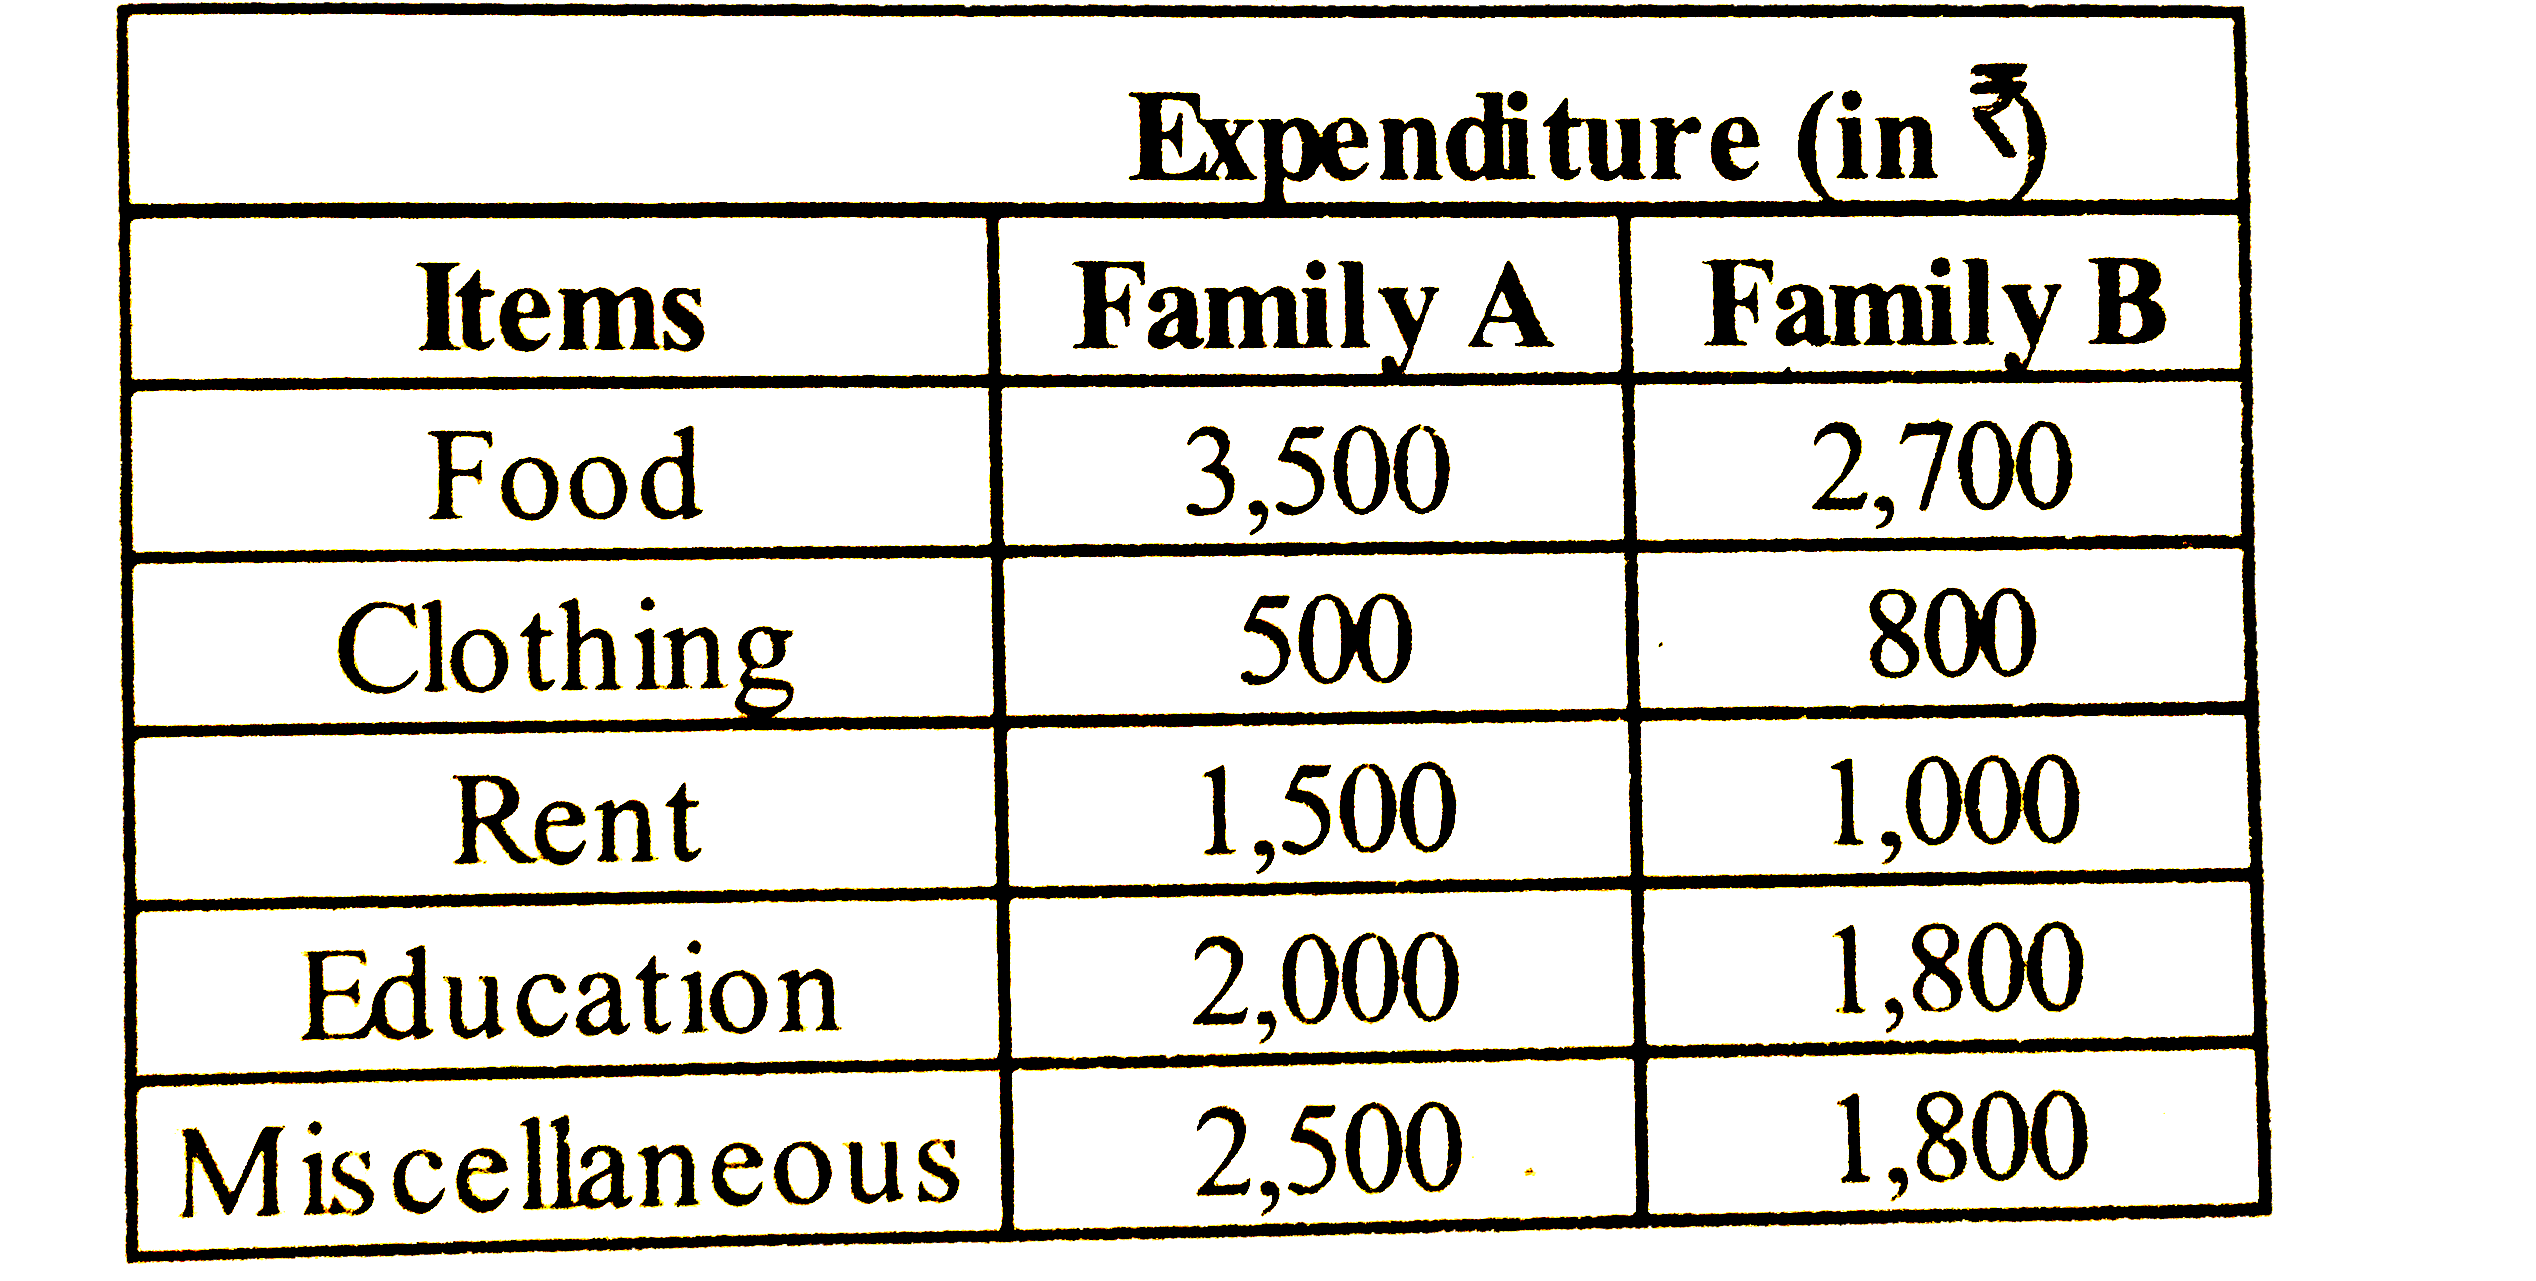
View SolutionThe following table gives the monthly expenditure of two families:

In constructing a pie diagram to the above data, the radii of the circles are to be chosen by which one of the following ratios?
View SolutionThe following table gives the monthly expenditure of two families

In constructing a pie diagram to the above data, the radi of the circles are to be chosen by which one of the following ration?
View SolutionThe following table gives the data on the marks obtained by two students 'A and B' in five subjects :

Represent the data by a multiple bar diagram.
View Solution