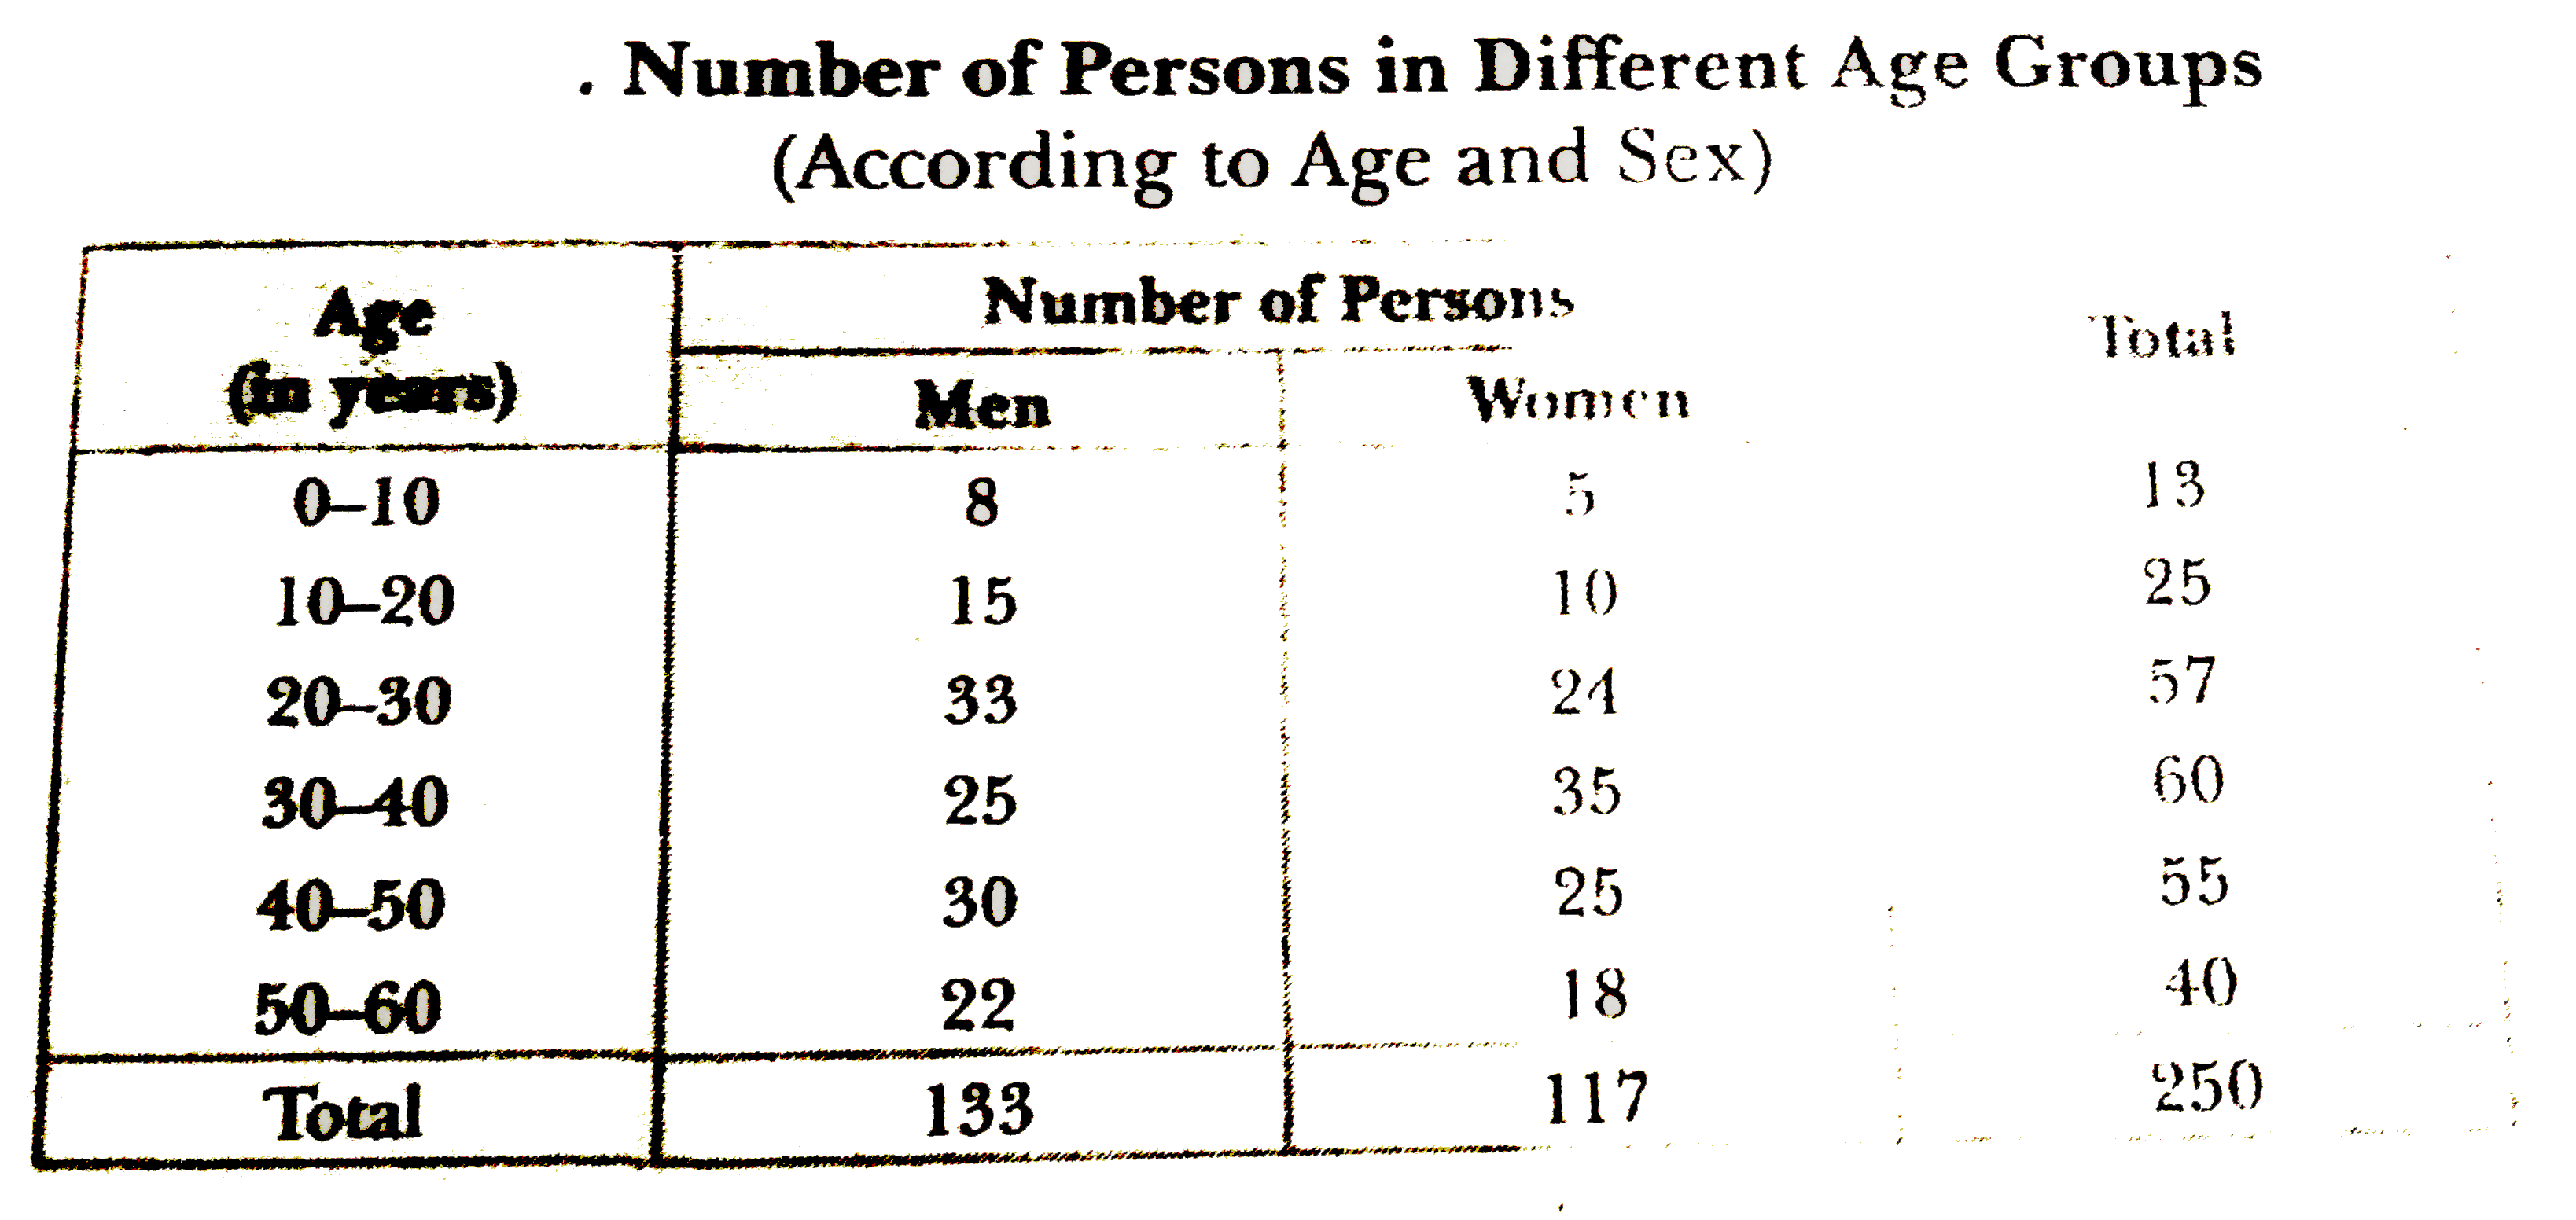
Following are the data about the number of men and women in different age groups in a society. Present the information in the form of a two-way table.

The correct Answer is:N/a
Topper's Solved these Questions
- PRESENTATION OF DATA - TEXTUAL AND TABULAR PRESENTATIONBook:TARUN JAIN & VK OHRIChapter:PRESENTATION OF DATA - TEXTUAL AND TABULAR PRESENTATIONExercise:MULTIPLE CHOICE QUESTIONS
Explore 7 Videos
- PRESENTATION OF DATA - TEXTUAL AND TABULAR PRESENTATIONBook:TARUN JAIN & VK OHRIChapter:PRESENTATION OF DATA - TEXTUAL AND TABULAR PRESENTATIONExercise:FILL IN THE BLANK
Explore 6 Videos
- ORGANISATION OF DATABook:TARUN JAIN & VK OHRIChapter:ORGANISATION OF DATAExercise:EXERCISE NCERT
Explore 13 Videos
Similar Questions
Following information relates to the marks secured by 50 boys and girls in their paper in economics. Present the information in the form of a two-way table.

View SolutionThe table below shows number of students of students of a college corresponding to different range of marks in Statistics. Present the information in the form of a histogram.

View Solution
Knowledge Check
The process of presenting data in the form of a table in called:
AorganisationBclassificationCpresentationDtabulationIf m>n, then the number of ways m men and n women can be seated in a row, so that no two women sit together, is
Am!n!(m+n)!B(m+n)!m!(n+1)!Cm!(n+1)!(m−n+1)!Dm!(m+1)!(m−n+1)!The number of ways in which 6 men and 5 women together is given by
A30B5!×4!C7!×5!D6!×5!
The following table gives data on birth rate in India according to census survey of different years. Present the information the form of a vertical/simple bar diagram.

View SolutionFollowing information relates to the production of wheat and Rice in India in different years. Present it in the form of a table.

View SolutionWrite the number of ways in which 6 men and 5 women can dine at a round table if no tow women sit together.
View SolutionThe following table shows the number of patients of differents age groups admitted to a hospital for treatement on a day. Find the median age of the patients.

View SolutionThe following table shows the number of illitrate persons in the age group (10-58 Years) in a town. Represents the given data by means of a histogram.

View Solution

