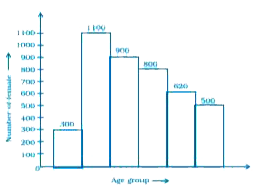
The following table shows the number of illitrate persons in the age group (10-58 Years) in a town. Represents the given data by means of a histogram.

Step by step video & image solution for The following table shows the number of illitrate persons in the age group (10-58 Years) in a town. Represents the given data by means of a histogram. by Maths experts to help you in doubts & scoring excellent marks in Class 8 exams.
Updated on:21/07/2023Topper's Solved these Questions
- DATA HANDLING Book:RS AGGARWALChapter:DATA HANDLING Exercise:Exercise 21B
Explore 6 Videos
- CUBES AND CUBE ROOTSBook:RS AGGARWALChapter:CUBES AND CUBE ROOTSExercise:Test Paper-4 (Fill in the blanks)
Explore 4 Videos
- DIRECT AND INVERSE PROPORTIONSBook:RS AGGARWALChapter:DIRECT AND INVERSE PROPORTIONSExercise:TEST PAPER -12 (Fill in the blanks )
Explore 5 Videos
Similar Questions
Knowledge Check
Study the following histogram and answer the questions.
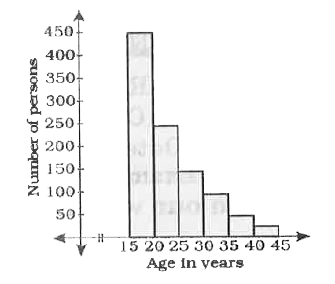
The number of persons in the age group 20 - 30 years is :A475B400C300D700Study the following histogram and answer the questions.
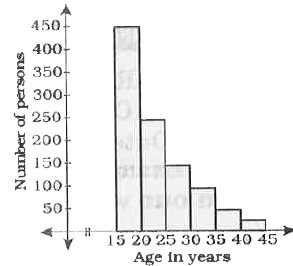
The total number of persons in the age group of 15 years to 45 years is :A450B800C1000D500
The below histogram shows the number of literate females in the age group of 10 to 40 years in a town.
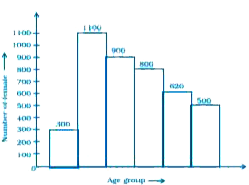
In which age group is the number of literate females the highest?
View SolutionThe below histogram shows the number of literate females in the age group of 10 to 40 years in a town.
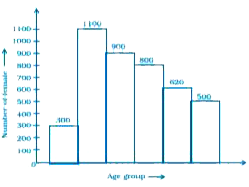
In which age group are literate females the least?
View SolutionThe following table shows the number of fruits in a fruit shop. Represent the above data by a bar graph
View SolutionThe following table shows the number of students in different classes of a high school. Draw a histogram to represent the given data.
ClassesVIVIIVIIIIXXNumber of students3742355048
View SolutionThe marks obtained by 60 students of a class in a methematics test are given

Represent the above data by means of a histogram.
View SolutionFind the mean age of 100 resisdents of a town from the following data.

View Solution


