Following data relate to the marks secured by students in their Statistics paper. Graph these data in the form of less than ogive and more than ogive.

First we construct a cumulative frequency table of 'less than' and 'more than' type and then draw the graphs as under :
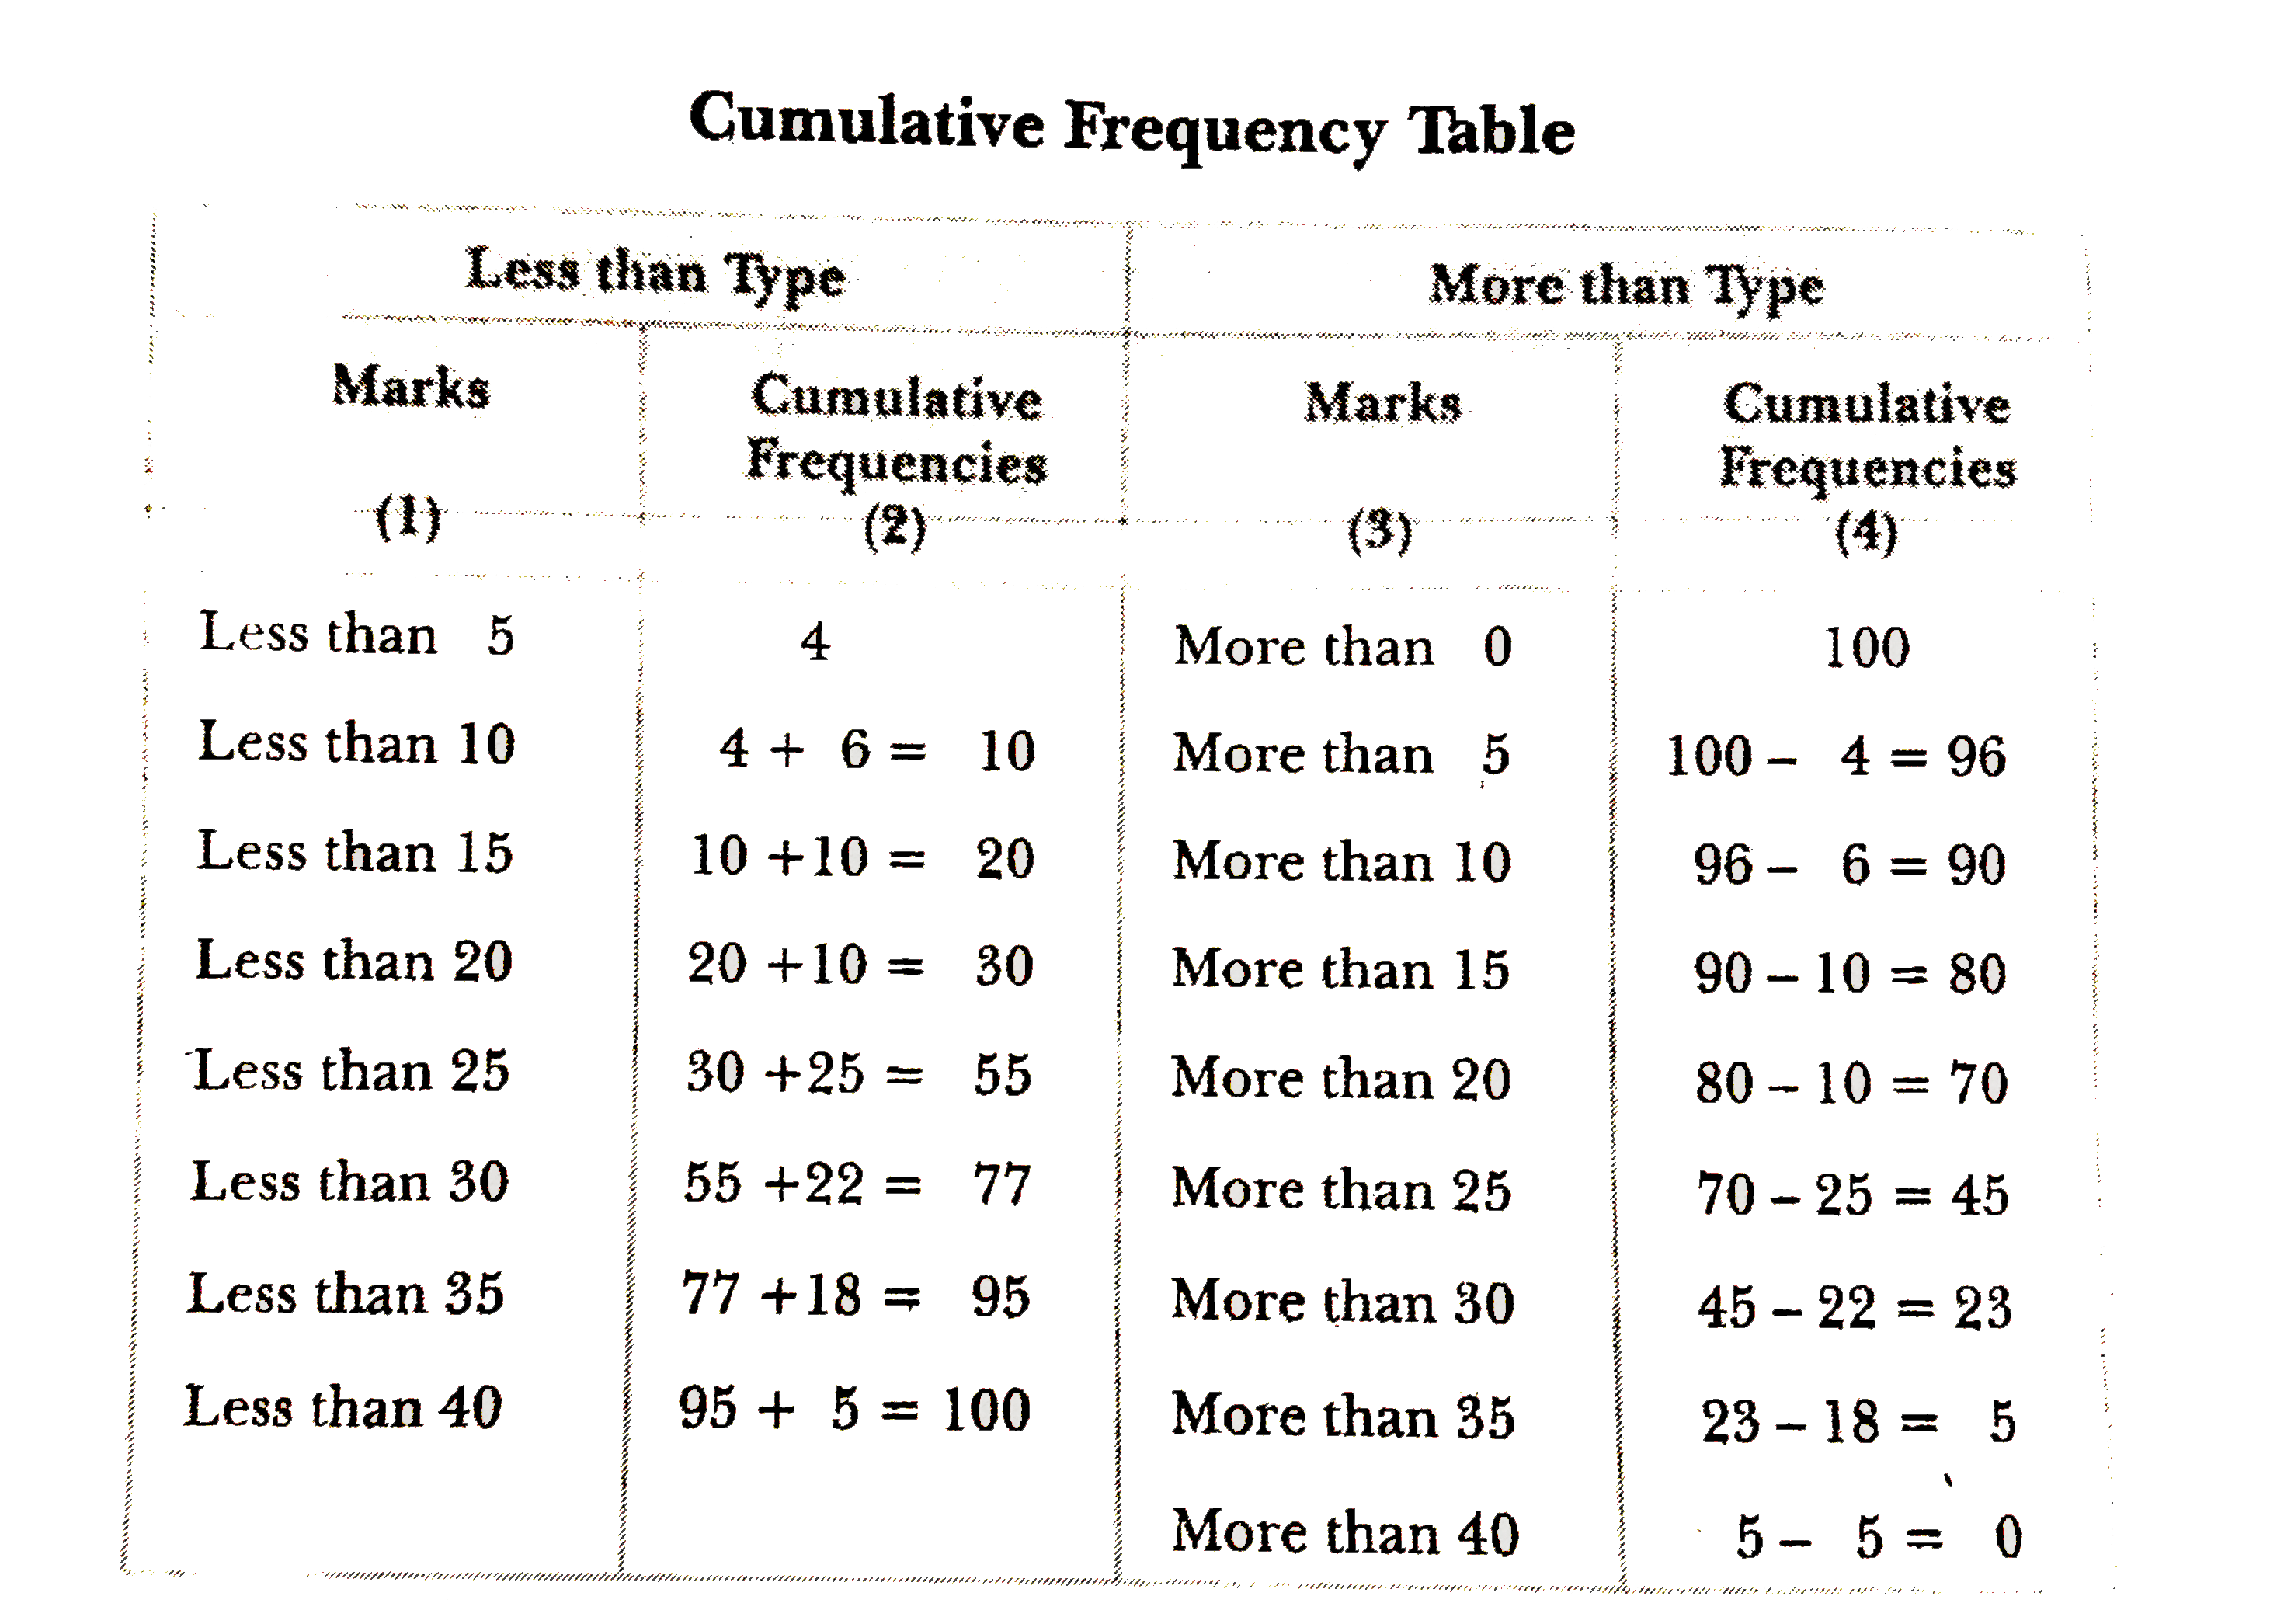
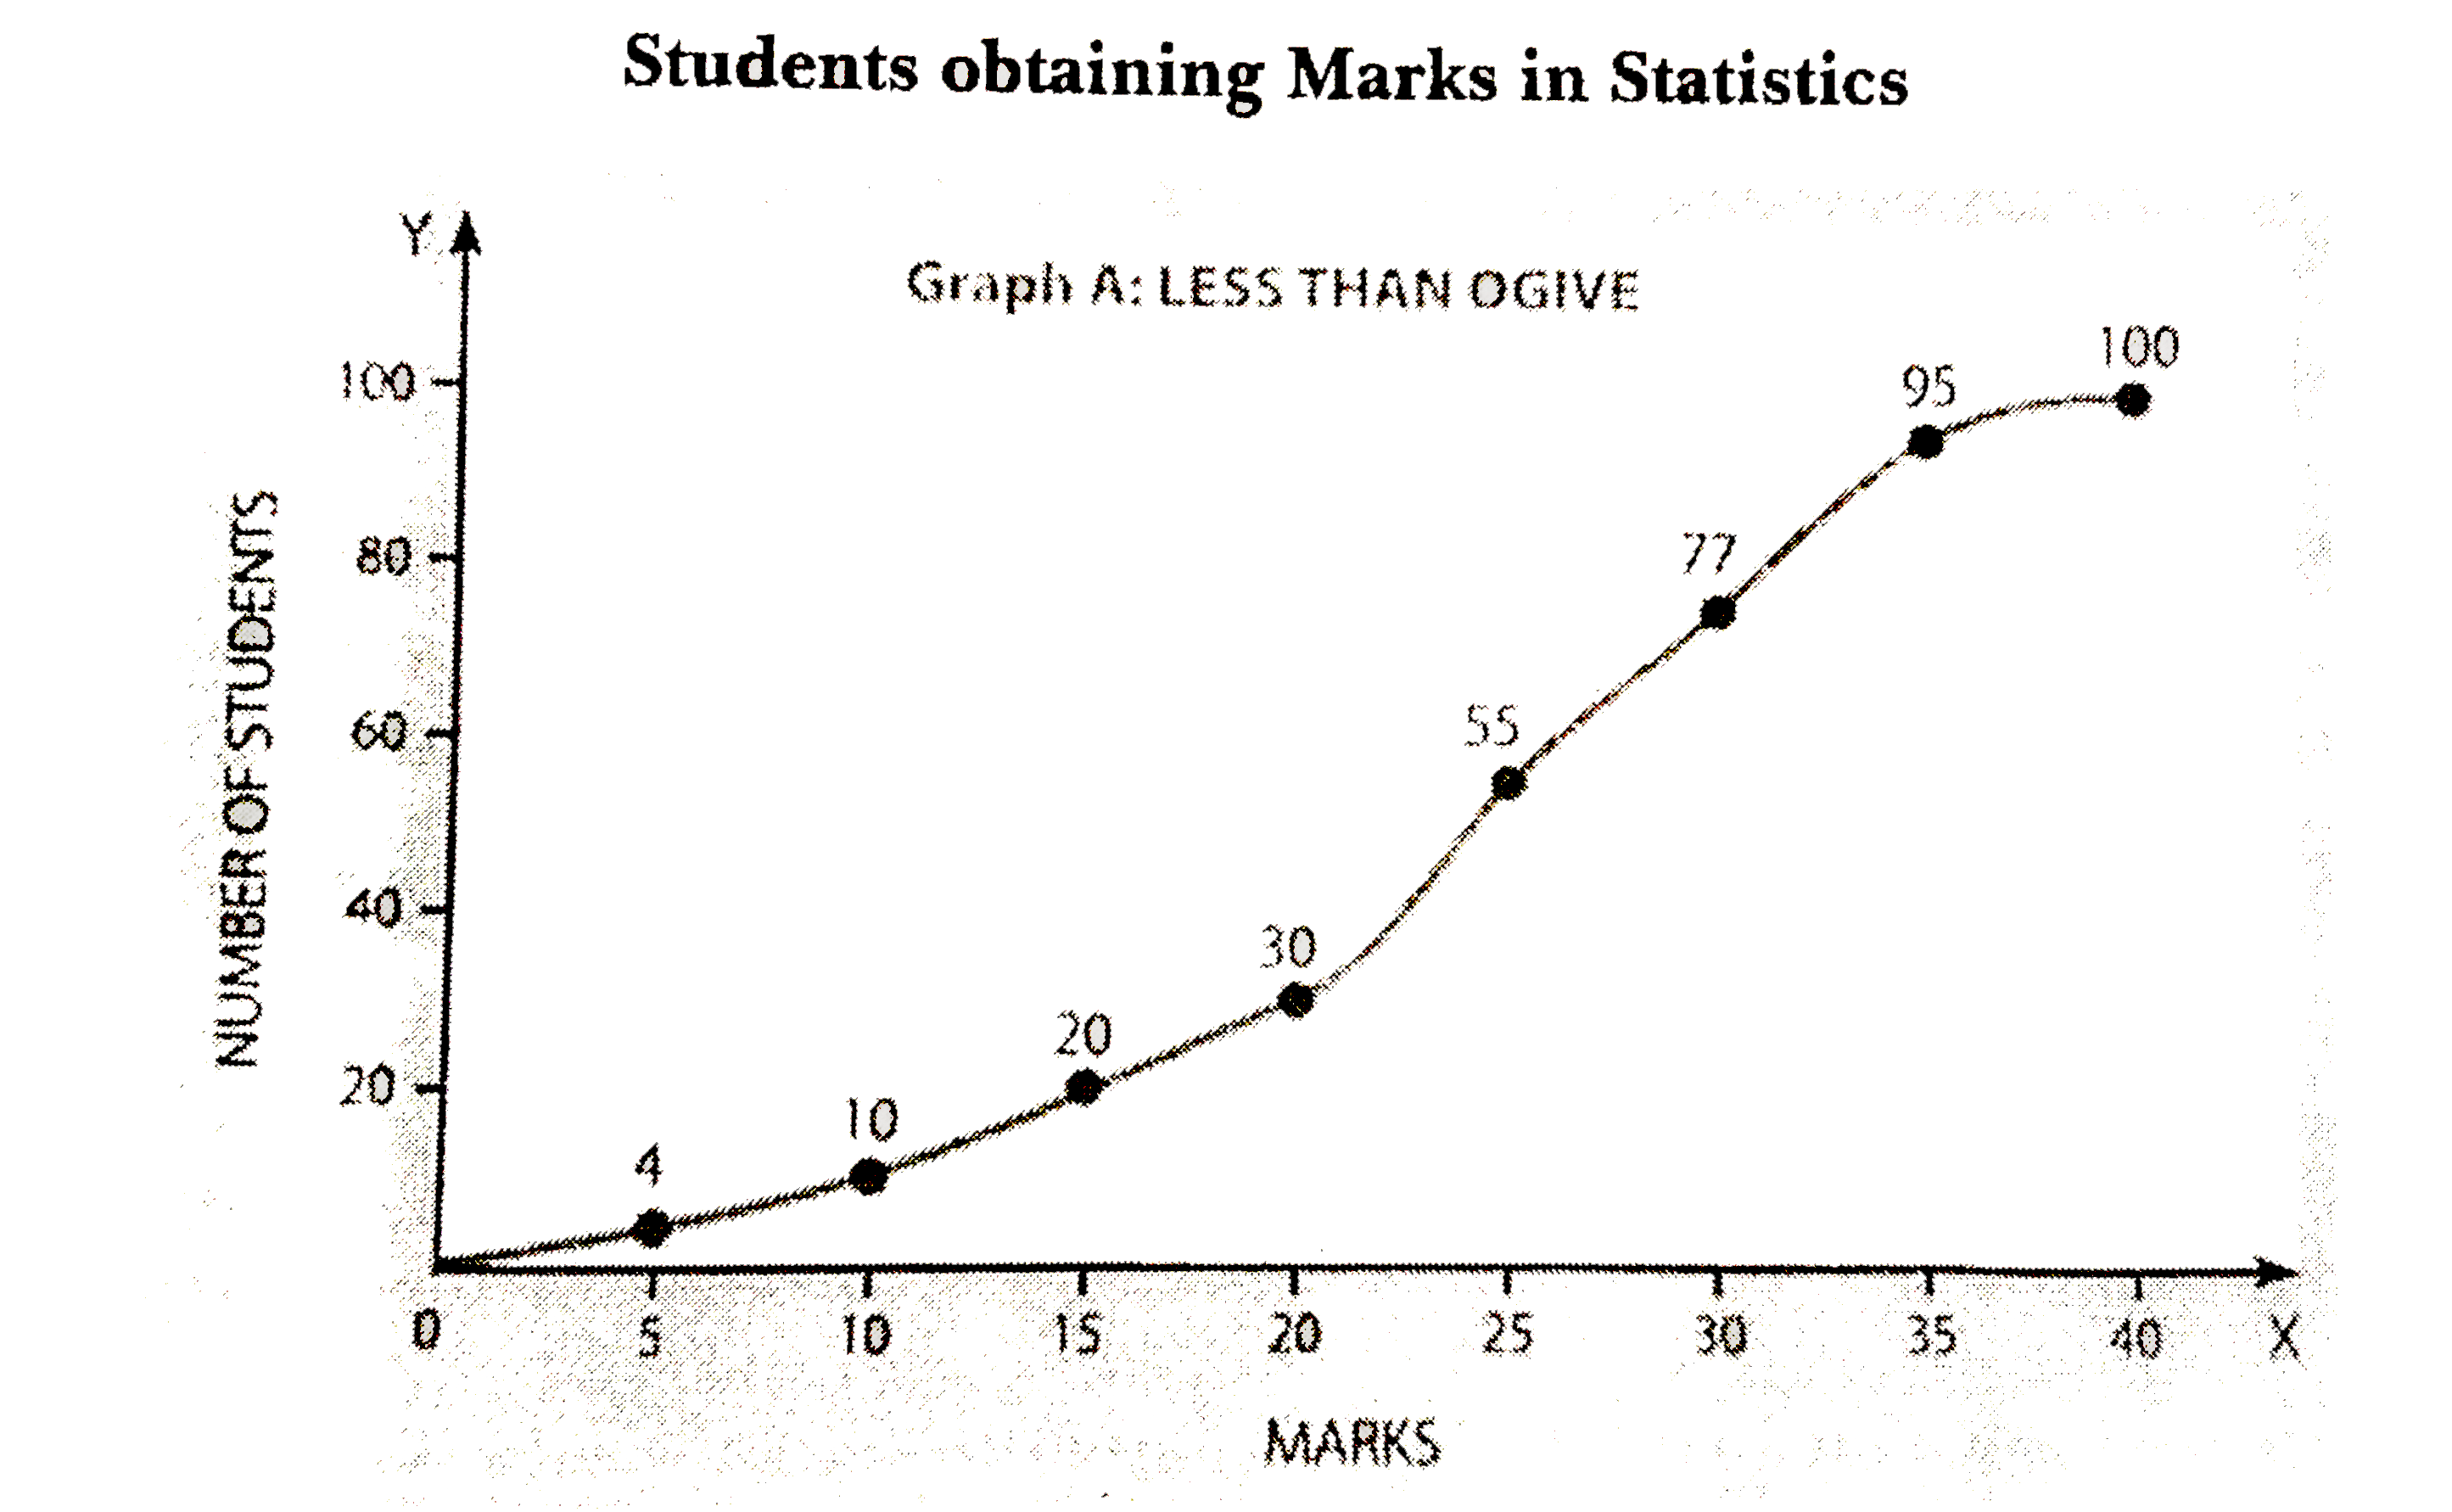
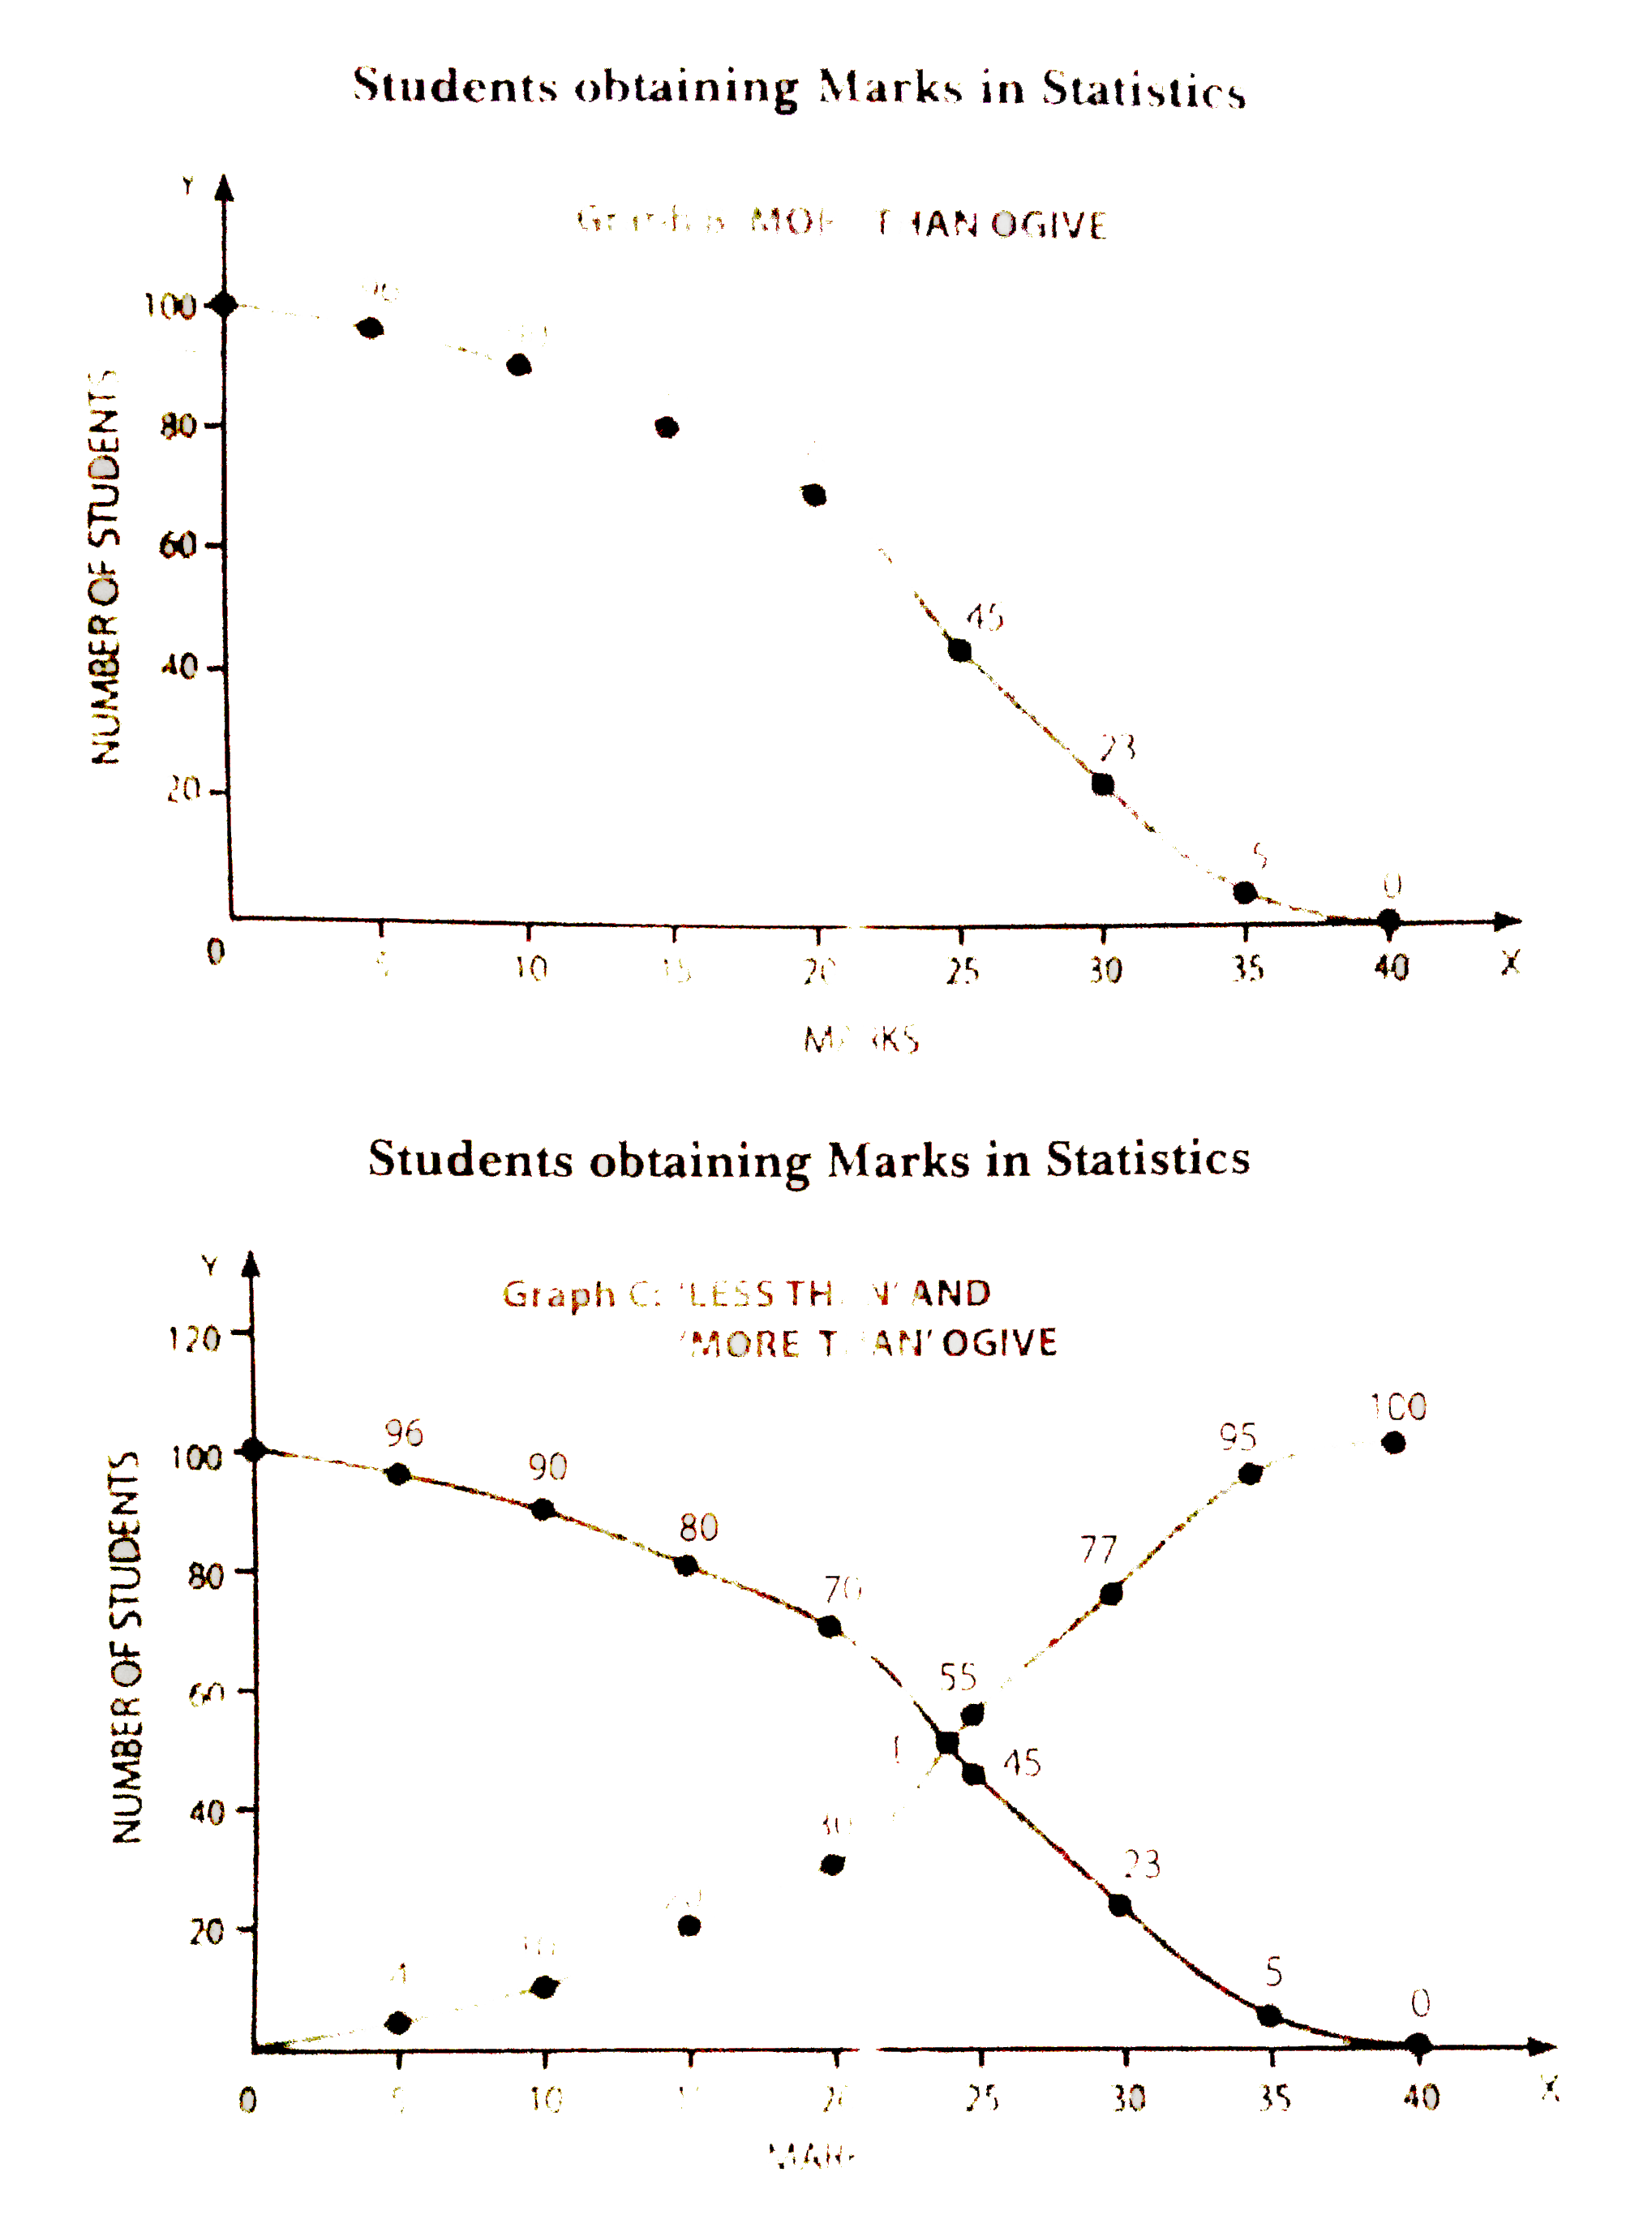
Graph A shows 'less than' cumulative frequency, Graph B shows ‘more than' cumulative frequencies, and Graph shows both the 'less than' as well as more than' frequencies simultaneously.
Topper's Solved these Questions
- BOOK - TARUN JAIN & VK OHRICHAPTER - FREQUENCY DIAGRAMS - HISTOGRAM, POLYGON AND OGIVEEXERCISE - Miscellaneous Illustration8videos
FREQUENCY DIAGRAMS - HISTOGRAM, POLYGON AND OGIVE
- BOOK - TARUN JAIN & VK OHRICHAPTER - FREQUENCY DIAGRAMS - HISTOGRAM, POLYGON AND OGIVEEXERCISE - EXERCISE M.C.Q6videos
FREQUENCY DIAGRAMS - HISTOGRAM, POLYGON AND OGIVE
- BOOK - TARUN JAIN & VK OHRICHAPTER - DIAGRAMMATIC PRESENTATION OF DATA BAR DIAGRAMS AND PIE DIAGRAMSEXERCISE - NCERT Question (With Hints to Answers)3videos
DIAGRAMMATIC PRESENTATION OF DATA BAR DIAGRAMS AND PIE DIAGRAMS
- BOOK - TARUN JAIN & VK OHRICHAPTER - INDEX NUMBERSEXERCISE - NCERT Questions (With Hints to Answers)12videos
INDEX NUMBERS
Similar Questions
What is the value of the median of the data using the graph in the following figure of less than ogive and more than ogive? (FIGURE)
View SolutionFollowing information relates to the marks secured by 50 boys and girls in their paper in economics. Present the information in the form of a two-way table.
 View Solution
Knowledge Check
- Question 1 - Select One
What is the shape of 'less than ogive'?
ARising upwardBFalling downwardCParallel to X-axisDParallel to Y-axis - Question 2 - Select One
Draw 'less than' and 'more than' ogive curves from the following data :
 AMediumBModeCArithmetic meanDnone of these
 - Question 3 - Select One
The 'less than' ogive curve and the 'more than' ogive curve intersect at
AmedianBmodeCarithmetic meanDNone of the above
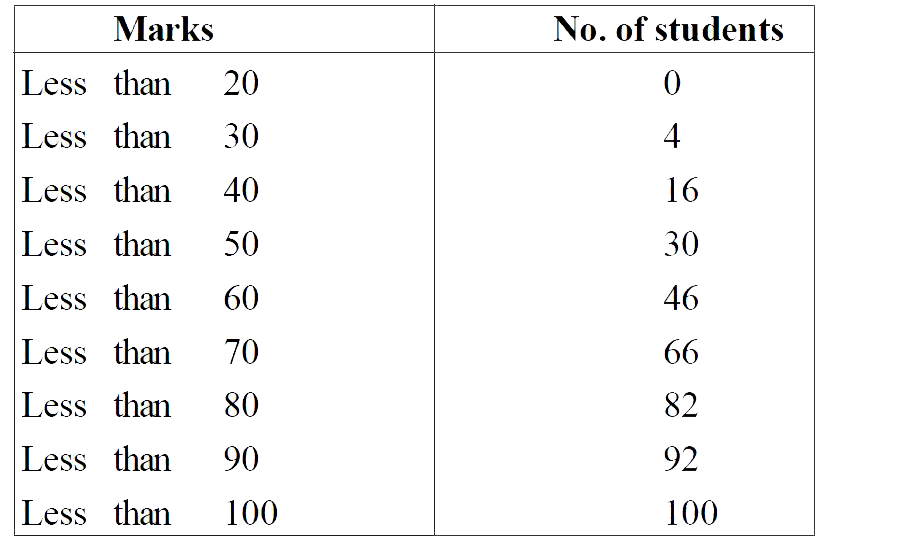
Draw a 'less than' ogive of the following data
 View Solution
Construct a less than ogive and a more than ogive from the following data :
 View Solution
In a study of the cases of diabetes the following data was obtained.

Draw a less than ogive for above data .View SolutionWhich measure of central tendency is given by the x -coordinate of the point of intersection of the more than ogive and less than ogive?
View SolutionThe given graph shows the marks obtained by students in an examination.
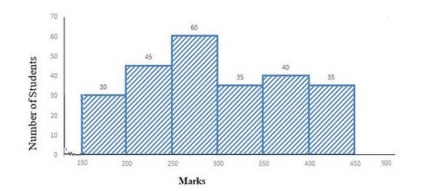 The number of students who obtained less than 300 marks is what percent more than the number of students who obtained 350 or more marks?View Solution
