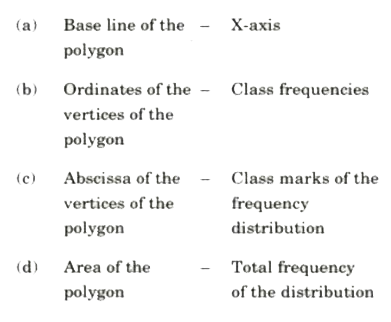
Define frequency polygon.
The correct Answer is:All mid-points indicating frequencies of the different classes joined to make a graph are called frequency polygon.
All mid-points indicating frequencies of the different classes joined to make a graph are called frequency polygon.
Topper's Solved these Questions
- FREQUENCY DIAGRAMS - HISTOGRAM, POLYGON AND OGIVEBOOK - TARUN JAIN & VK OHRICHAPTER - FREQUENCY DIAGRAMS - HISTOGRAM, POLYGON AND OGIVEEXERCISE - EXERCISE ESSENTIAL PRACTICALS
10 Videos
- FREQUENCY DIAGRAMS - HISTOGRAM, POLYGON AND OGIVEBOOK - TARUN JAIN & VK OHRICHAPTER - FREQUENCY DIAGRAMS - HISTOGRAM, POLYGON AND OGIVEEXERCISE - EXERCISE NCERT
7 Videos
- FREQUENCY DIAGRAMS - HISTOGRAM, POLYGON AND OGIVEBOOK - TARUN JAIN & VK OHRICHAPTER - FREQUENCY DIAGRAMS - HISTOGRAM, POLYGON AND OGIVEEXERCISE - EXERCISE TRUE AND FALSE
3 Videos
- DIAGRAMMATIC PRESENTATION OF DATA BAR DIAGRAMS AND PIE DIAGRAMSBOOK - TARUN JAIN & VK OHRICHAPTER - DIAGRAMMATIC PRESENTATION OF DATA BAR DIAGRAMS AND PIE DIAGRAMSEXERCISE - NCERT Question (With Hints to Answers)
3 Videos
- INDEX NUMBERSBOOK - TARUN JAIN & VK OHRICHAPTER - INDEX NUMBERSEXERCISE - NCERT Questions (With Hints to Answers)
12 Videos
Similar Questions
Knowledge Check
For drawing a frequency polygon of a continuous frequency distribution, we plot the points whose ordinates are the frequencies of the respecitve classes and abscissae are, respectively
Aupper limits of the classesBlower limites of the classesCclass marks of the classesDupper limits of preceeding classes
Construction of frequency polygon by using Histogram
View SolutionConstruction of frequency polygon without using Histogram.
View Solution(i)Construct a histogram and frequency polygon of the following distribution :

(ii)Show that the area under frequency polygon is equal to the area under histogram.
View SolutionFor drawing a frequency polygon of a continuous frequency distribution, we plot the points whose ordinates are the frequencies of the respecitve classes and abscissae are, respectively
View SolutionConsider the following statements related to cumulative frequency polygon of a frequency distribution, the frequencies being cumulated from the lower end of the range :
1. The cumulative frequency polygon gives an equivalent representation of frequency distribution table.
2. The cumulative frequency polygon is a closed polygon with one horizontal and one vertical side. The other sides have non-negative slope.
Which of the above statements is/are correct?
View SolutionThe following table shows the distribution of weights of seeds. Draw a frequency polygon.

View SolutionThe following pairs relate to frequency distribution of a discrete variable and its frequency polygon. Which one of the following pairs is not correctly matched ?

View Solution
