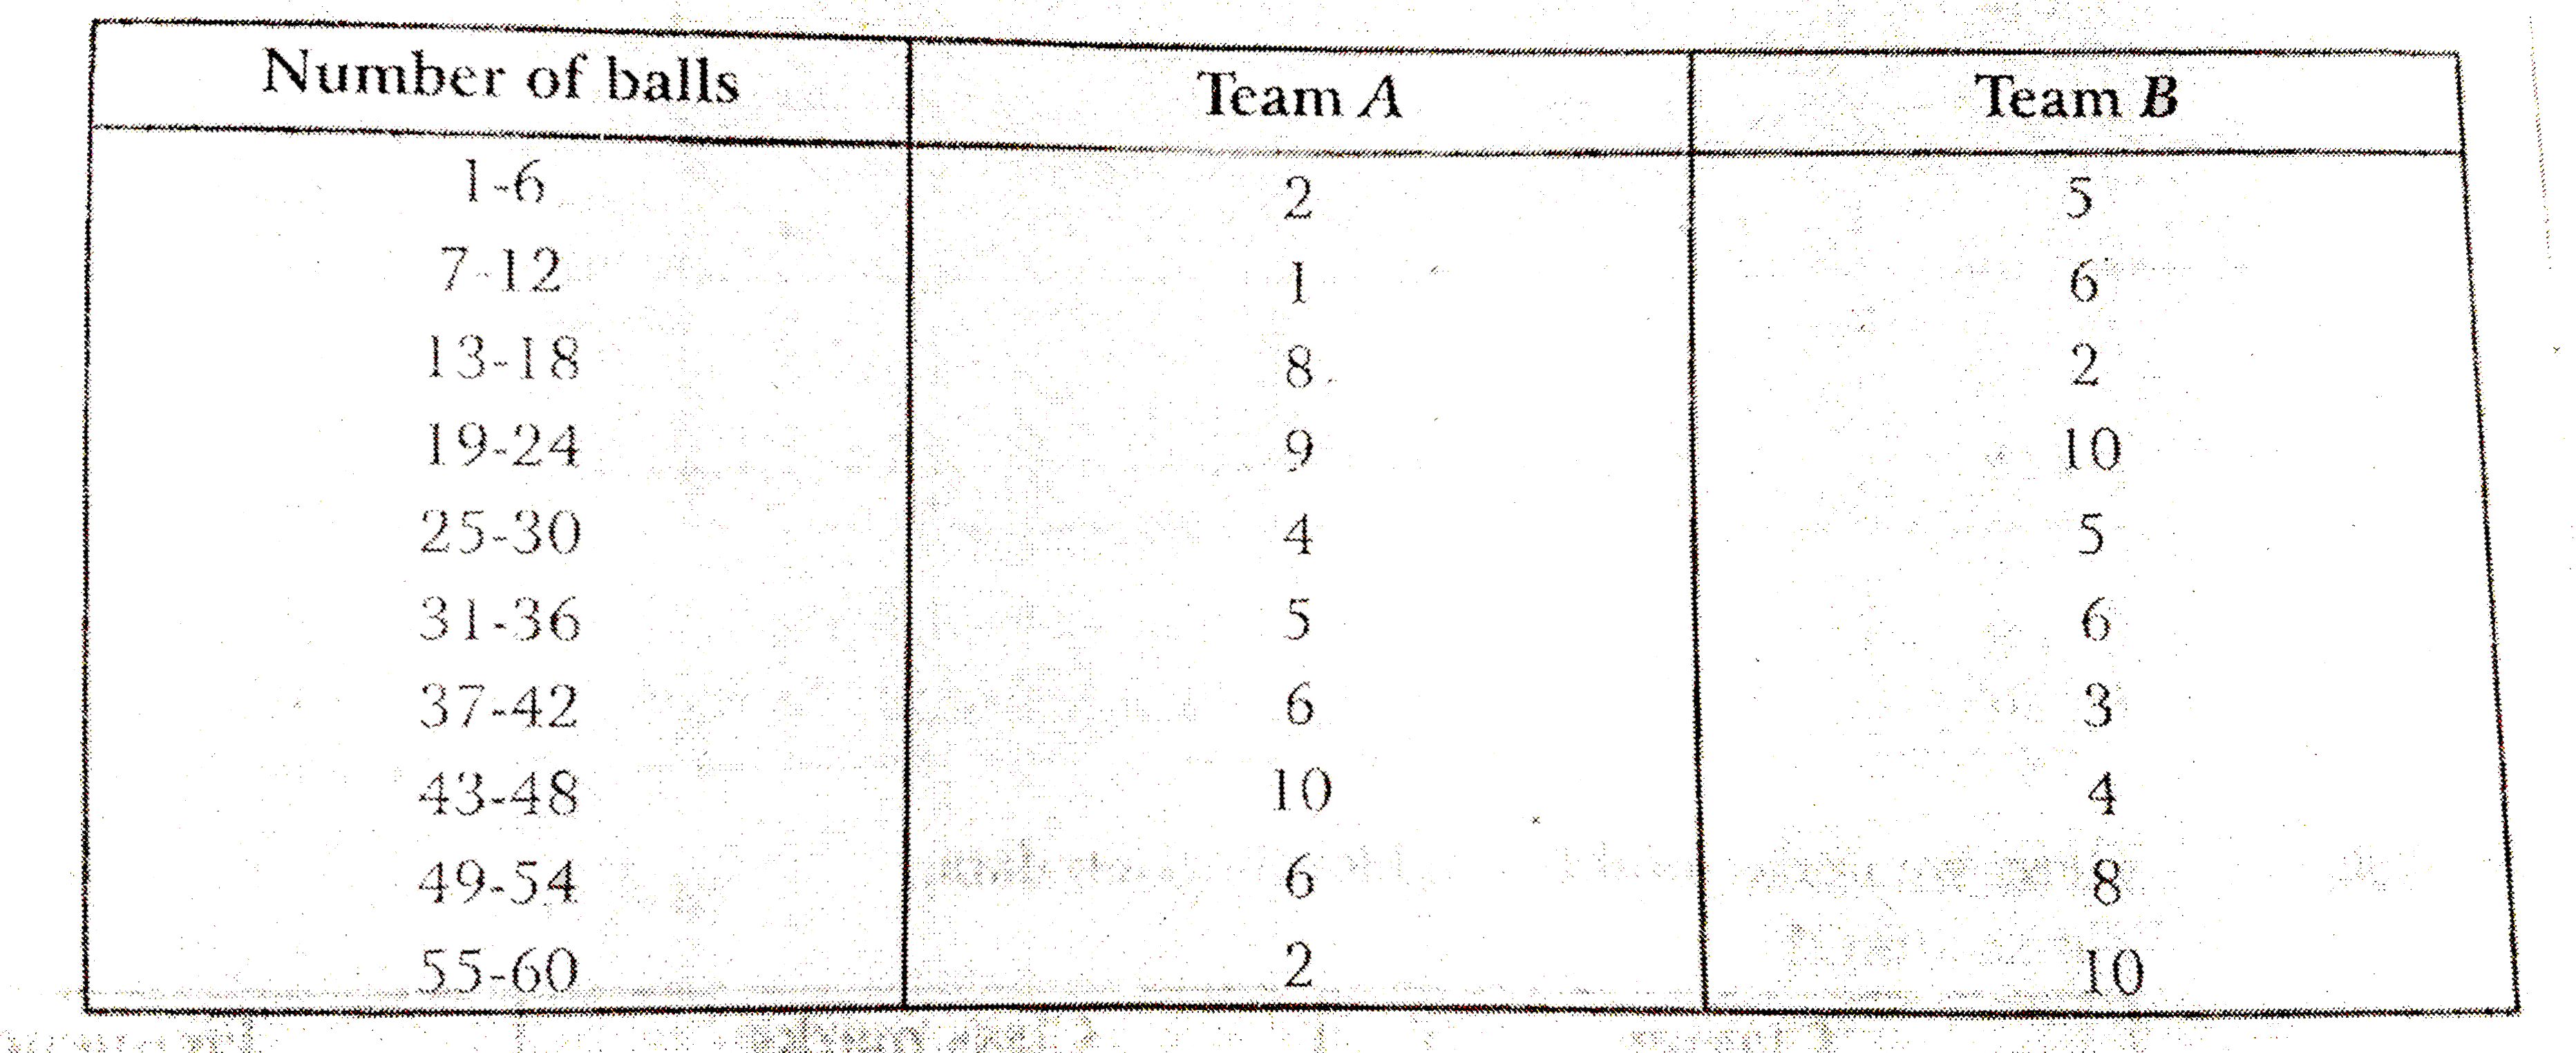
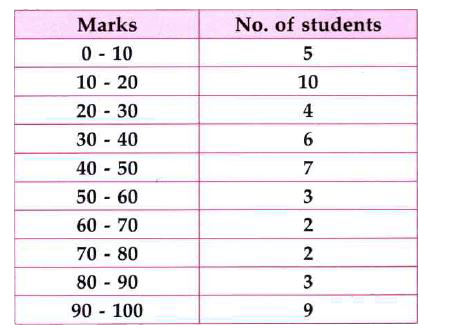
Exhibit the above data using a frequency polygon.
Topper's Solved these Questions
- DATA-ITS SOURCE AND COMPLIATIONBook:FULL MARKSChapter:DATA-ITS SOURCE AND COMPLIATIONExercise:ADDITIONAL QUESTION SOLVED (III. LONG ANSWER QUESTIONS)
Explore 1 Video
- DATA-ITS SOURCE AND COMPLIATIONBook:FULL MARKSChapter:DATA-ITS SOURCE AND COMPLIATIONExercise:ADDITIONAL QUESTION SOLVED (IV. VIVA-VOCE QUESTIONS)
Explore 8 Videos
- DATA-ITS SOURCE AND COMPLIATIONBook:FULL MARKSChapter:DATA-ITS SOURCE AND COMPLIATIONExercise:ADDITIONAL QUESTION SOLVED (I.VERY SHORT ANSWER QUESTIONS)
Explore 14 Videos
- GRAPHICAL REPRESENTATION OF DATABook:FULL MARKSChapter:GRAPHICAL REPRESENTATION OF DATAExercise:TEST ASSIGNMENT
Explore 3 Videos
Similar Questions
Define frequency polygon.
View SolutionShow the following data by a frequency polygon.

View SolutionShow the following data by a frequency polygon.

View SolutionHow is a frequency polygon obtained?
View Solution
The above data is to be shown by a frequency polygon. The coordinates of the points to show number of students in the class 4−6 are _______ .
View SolutionFind the correct answer from the alternative given :

The above data is to be shown by a frequency polygon. The coordinates of the points to show number of students in the class 4−6 are ………
View SolutionFollowing table shows a frequency distribution for the speed of cars passing through at a particular spot on a high way.

Draw a histogram and frequency polygon representing the data above.
View SolutionIn case of _____ the points are joined using a foot-rule. (frequency polygon/ frequency curve)
View SolutionThe runs scored by two teams A and B on the first 60 balls in a cricket match are given below:

Represent the data of both the teams on the same graph by frequency polygons.
View SolutionFor the following data, draw a histogram and a frequency polygon

View Solution

