Consider the following statements related to cumulative frequency polygon of a frequency distribution, the frequencies being cumulated from the lower end of the range :
1. The cumulative frequency polygon gives an equivalent representation of frequency distribution table.
2. The cumulative frequency polygon is a closed polygon with one horizontal and one vertical side. The other sides have non-negative slope.
Which of the above statements is/are correct?
1 only
2 only
Both 1 and 2
Neither 1 nor 2
Step by step video & image solution for Consider the following statements related to cumulative frequency polygon of a frequency distribution, the frequencies being cumulated from the lower end of the range : 1. The cumulative frequency polygon gives an equivalent representation of frequency distribution table. 2. The cumulative frequency polygon is a closed polygon with one horizontal and one vertical side. The other sides have non-negative slope. Which of the above statements is/are correct? by Maths experts to help you in doubts & scoring excellent marks in Class 14 exams.
Updated on:21/07/2023Similar Questions
Draw a frequency polygon for the following grouped frequency distribution table :

View SolutionConsider the following statements pertaining to a frequency polygon of a frequency distribution of a continuous variable with seven class intervals of equal width:
1. The original frequency distribution can be reconstructed from the frequency polygon.
2. The frequency polygon touches the x-axis in its extreme right and extreme left.
Which of the above statements is/are correct?
View Solution
Knowledge Check
Which of the following is useful to find from the cumulative frequencies in a grouped frequency table?
AMeanBMedianCModeDAll of theseConsider the following statements in respect of histogram :
1. The histogram is a suitable representation of a frequency distribution of a continuous variable.
2. The area included under the whole histogram is the total frequency.
Which of the above statements is/are correct?A1 onlyB2 onlyCBoth 1 and 2DNeither 1 nor 2Consider the following statements in respect of histogram :
1. Histogram is an equivalent graphical representation of the frequency distribution.
2. Histogram is suitable for continuous random variables, where the total frequency of an interval is evenly distributed over the interval.
What of the statements given above is/are correct?AOnly IBOnly IICBoth 1 and IDNeither I nor 2
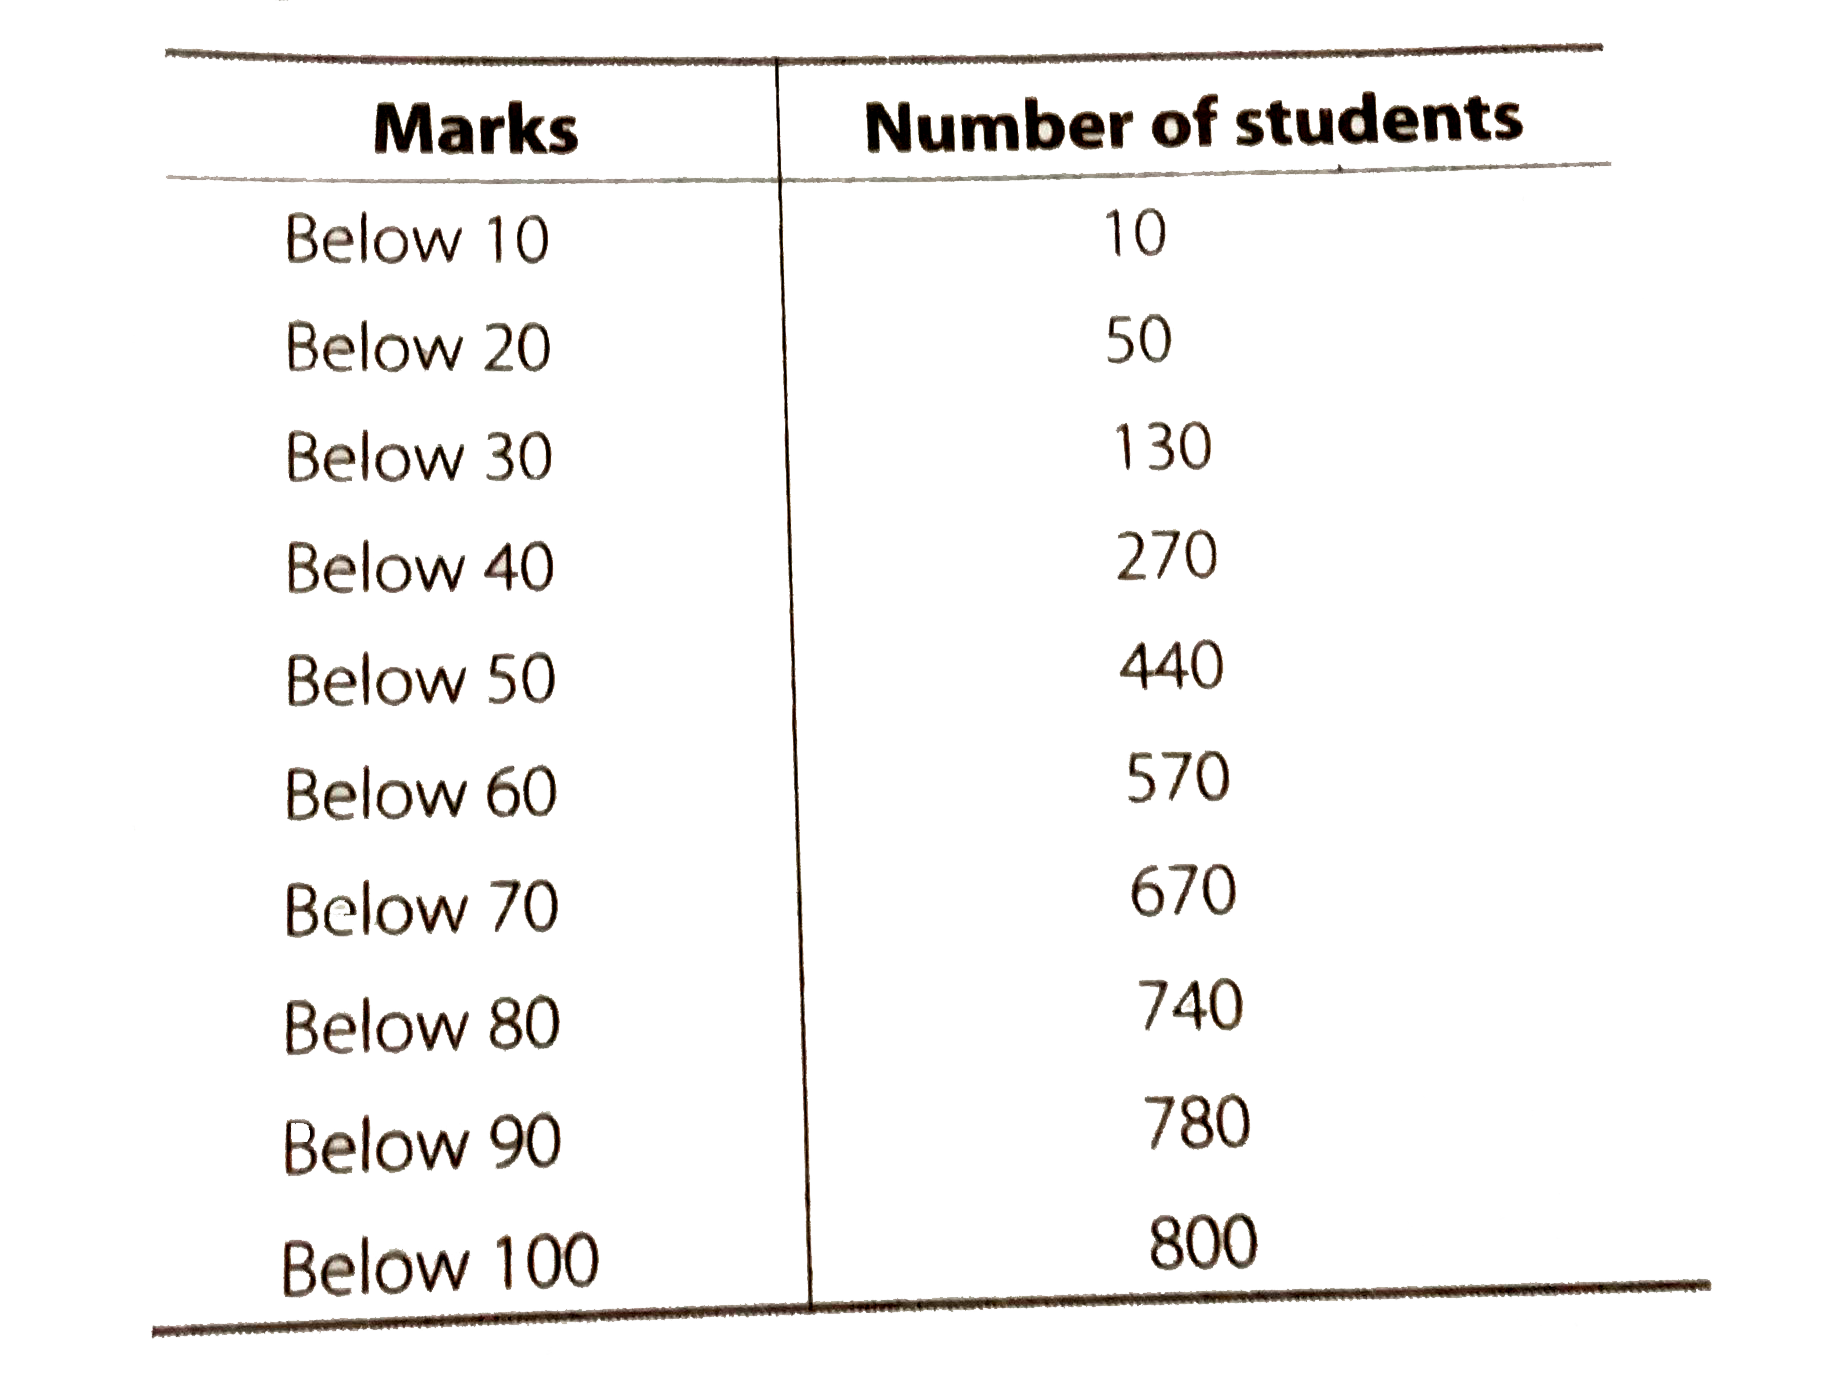
The following table show tha cumulative frequency distribution of marks of 800 students in an examination.

Construct a frequency distribution table for the data above.
View SolutionGiven below is a cumulative frequency distribution showing the mars secured by 50 students of a class

From the frequency distribution table for the data.
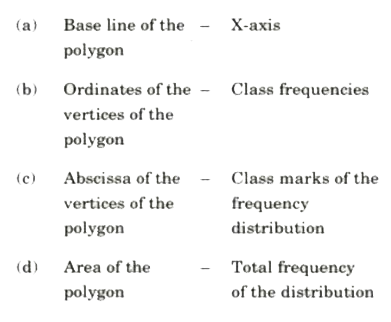
View SolutionThe following pairs relate to frequency distribution of a discrete variable and its frequency polygon. Which one of the following pairs is not correctly matched ?

View SolutionWhich one of the following measures is determined only after the construction of cumulative frequency distribution?
View SolutionWhich one of the following measures is determined only after the construction of cumulative frequency distribution
View Solution
