Following table shows production of a factory between January and June. Present the information in the form of a one variable time series graph.
MonthJanuaryFebruaryMarchAprilMayJuneProduction (Quintals)57.551012.515
Take the following steps:
(i) Indicate time period (in terms of months) on the X-axis, and production on the Y-axis.
(ii) Mark different points on the graph indicating values of production corresponding to different months.
(iii) Join the point to get a graph showing the behaviour of production over time.
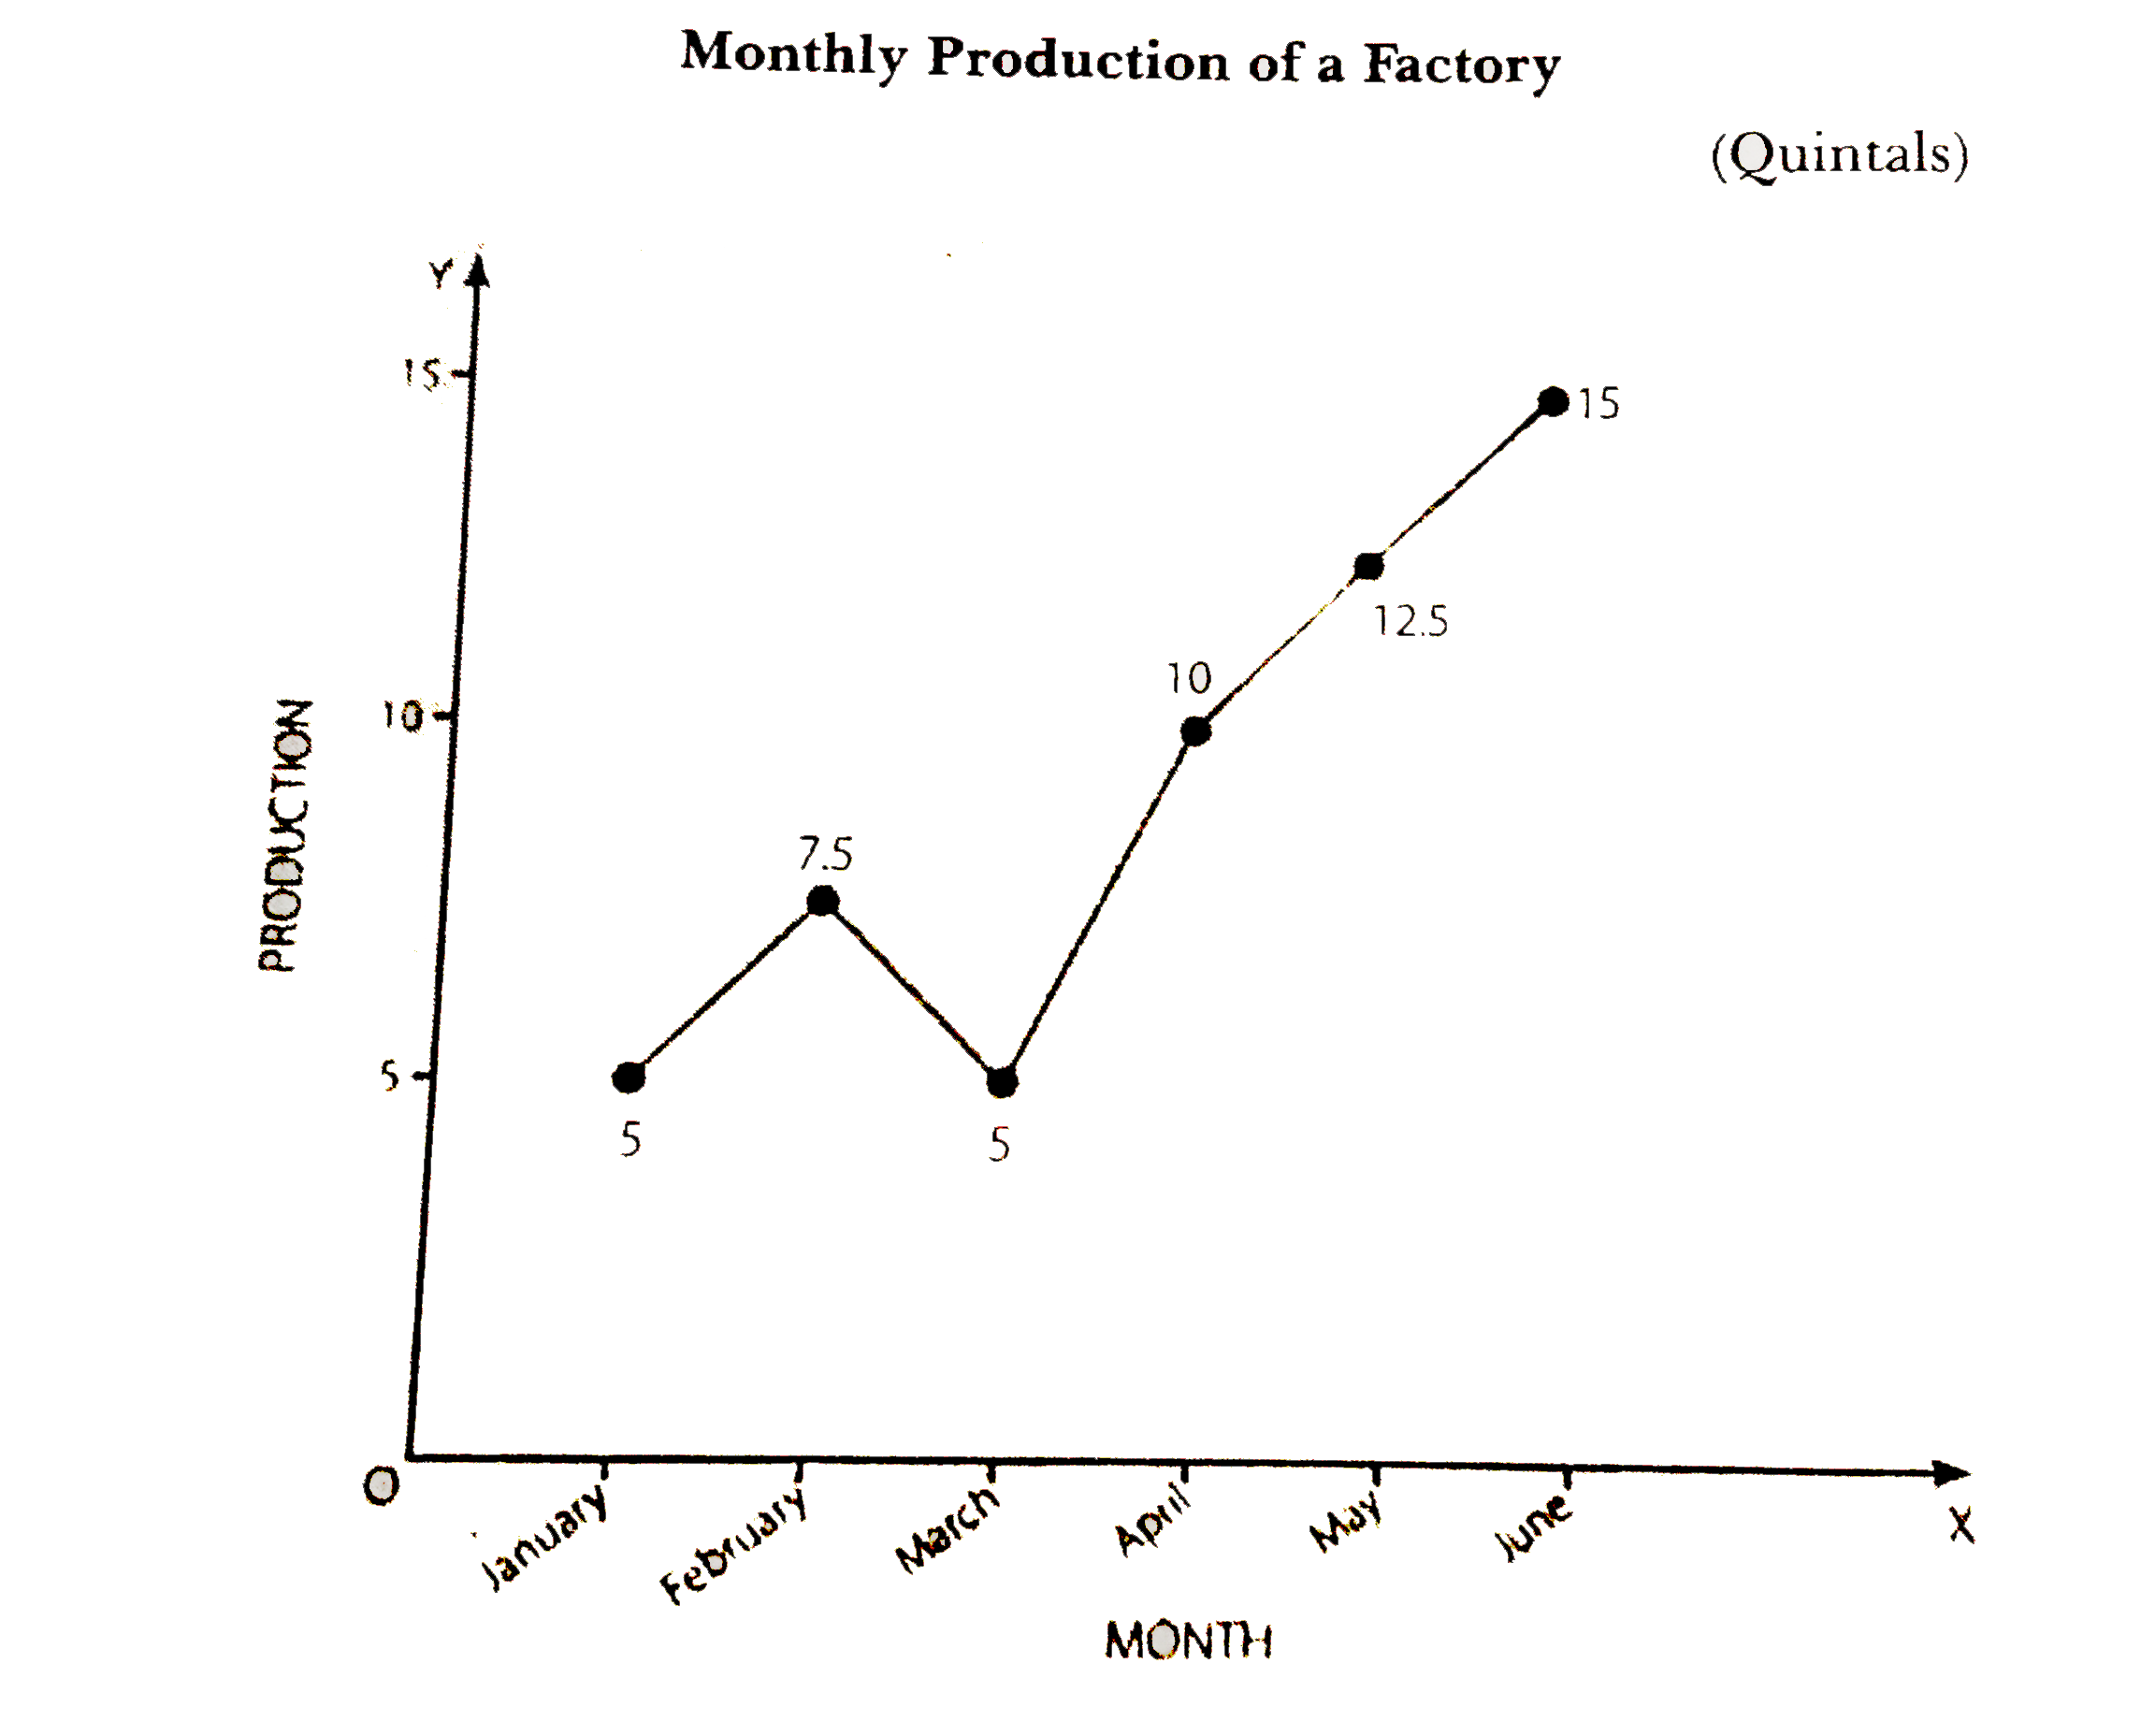
Use of False Line : The use of false line is very common with respect to time series data. Following illustration explains how exactly it is done.
Topper's Solved these Questions
- BOOK - TARUN JAIN & VK OHRICHAPTER - ARITHMETIC LINE-GRAPHS OR TIME SERIES GRAPHSEXERCISE - A. Mupltiple Choice Questions6videos
ARITHMETIC LINE-GRAPHS OR TIME SERIES GRAPHS
- BOOK - TARUN JAIN & VK OHRICHAPTER - ARITHMETIC LINE-GRAPHS OR TIME SERIES GRAPHSEXERCISE - B. Fill in the blank4videos
ARITHMETIC LINE-GRAPHS OR TIME SERIES GRAPHS
- BOOK - TARUN JAIN & VK OHRICHAPTER - CENSUS AND SAMPLE METHODS OF COLLECTION OF DATAEXERCISE - NCERT Question9videos
CENSUS AND SAMPLE METHODS OF COLLECTION OF DATA
Similar Questions
The following table gives data on the production and sales of a factory (in thousand rupees) between January and June. Present the information in the form of a two variable arithmetic-line graph.
MonthJanuaryFebruaryMarchAprilMayJuneProduction57.551012.515Sales7.5107.512.51517.5View SolutionFind the product of the following.
7.5×0.01View Solution
Knowledge Check
- Question 1 - Select One
Direction: The following table shows the production of fertilizers (in lakh tonne) by six companies for 5 months (January to May)
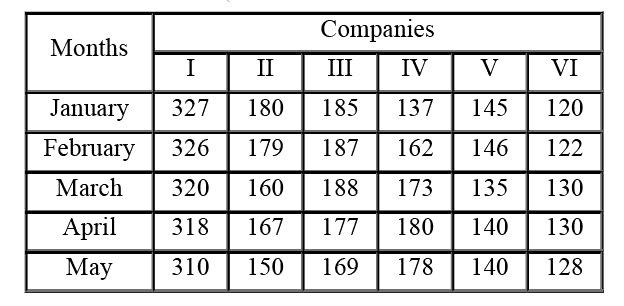
There is a continuous decrease in production over the months in:ACompany IIBCompany ICCompany IIIDCompany IV
Convert the following products into factorial: 5.6.7.8.9.10
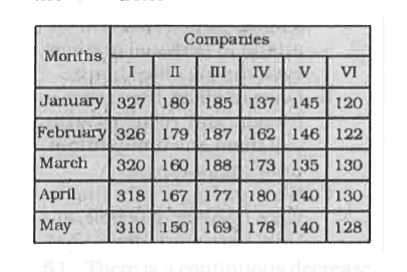
View SolutionThe following table shows the production of fertilizers (in lakh tonne) by six companies for 5 months (January to May). Study the table and answer the questions.
There is a continuous decrease in production over the months in:
 View Solution
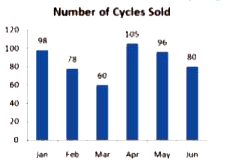
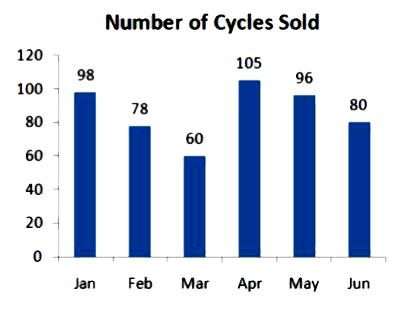
The bar graph shows the number of cycles sold by a distributor in each month from January to June. Whatis the increase in the number of cycles sold in April as compared to March?
 View Solution
The bar graph shows the number of cycles sold by a distributor in each month from January to June. Whatis the increase in the number of cycles sold in April as compared to March ?
 View Solution
The bar graph shows the number of cycles sold by a distributor in each month from January to June. Whatis the increase in the number of cycles sold in April as compared to March ?
 View Solution
Convert the following products into factorial: 1.3.5.7.9(2n−1)
View SolutionFour of the following five are alike in a certain way and so form a group. Which is the one that does not belong to that group?
1) March
2) January
3)July
4) June
5) MayView Solution

