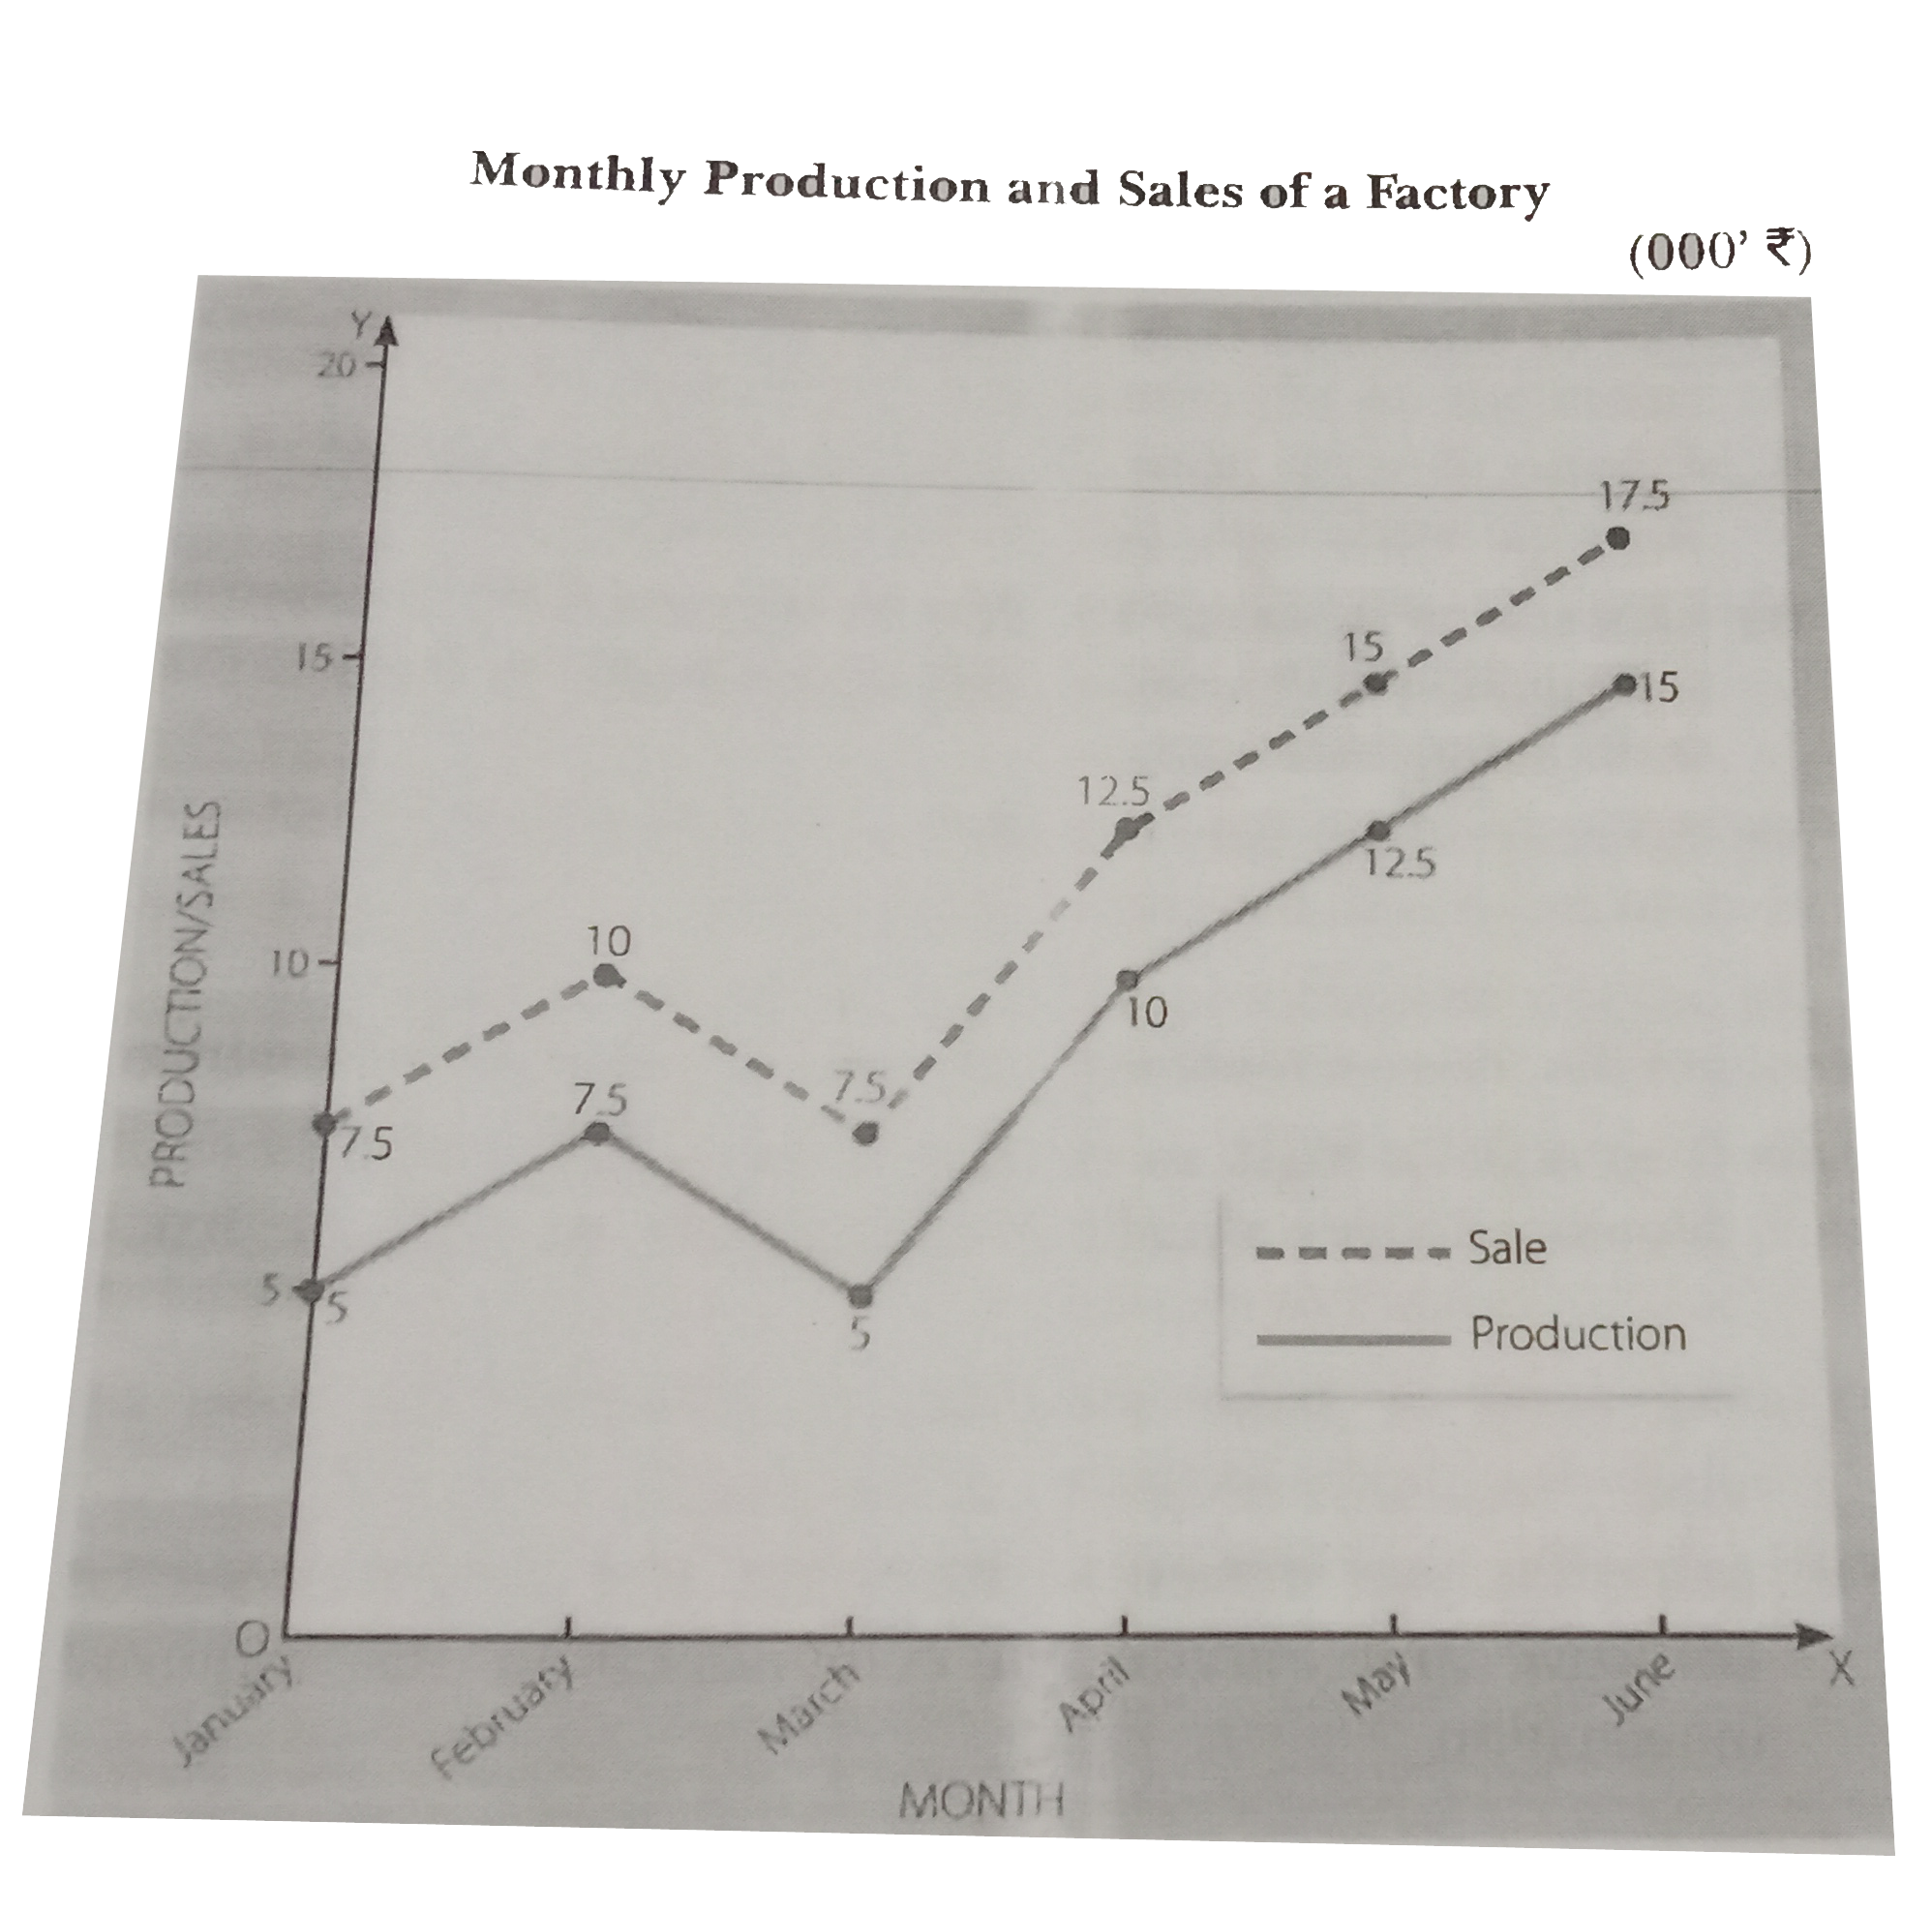
The following table gives data on the production and sales of a factory (in thousand rupees) between January and June. Present the information in the form of a two variable arithmetic-line graph.
These data will also be presented in the form of graph in the same manner as shown in the above graph. In graph, following data pertaining to both production and sales are shown on Y-axis. These are represented by two differented graph lines in the same graph.

Topper's Solved these Questions
- BOOK - TARUN JAIN & VK OHRICHAPTER - ARITHMETIC LINE-GRAPHS OR TIME SERIES GRAPHSEXERCISE - A. Mupltiple Choice Questions6videos
ARITHMETIC LINE-GRAPHS OR TIME SERIES GRAPHS
- BOOK - TARUN JAIN & VK OHRICHAPTER - ARITHMETIC LINE-GRAPHS OR TIME SERIES GRAPHSEXERCISE - B. Fill in the blank4videos
ARITHMETIC LINE-GRAPHS OR TIME SERIES GRAPHS
- BOOK - TARUN JAIN & VK OHRICHAPTER - CENSUS AND SAMPLE METHODS OF COLLECTION OF DATAEXERCISE - NCERT Question9videos
CENSUS AND SAMPLE METHODS OF COLLECTION OF DATA
Similar Questions
Following table shows production of a factory between January and June. Present the information in the form of a one variable time series graph.
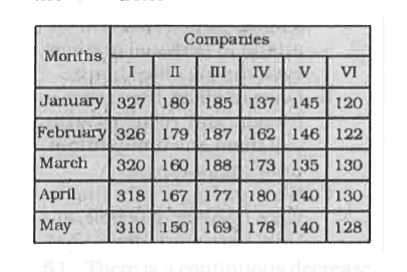
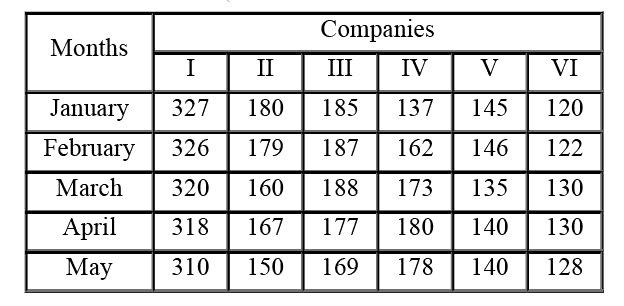
MonthJanuaryFebruaryMarchAprilMayJuneProduction (Quintals)57.551012.515View SolutionThe following table shows the production of fertilizers (in lakh tonne) by six companies for 5 months (January to May). Study the table and answer the questions.
There is a continuous decrease in production over the months in:
 View Solution
Knowledge Check
- Question 1 - Select One
3,5,7, 12,13,17,19
A19B17C13D12 - Question 2 - Select One
3,7,6,5,9 3,12,1,15 (…)
A18B13C(-1)D3 - Question 3 - Select One
Direction: The following table shows the production of fertilizers (in lakh tonne) by six companies for 5 months (January to May)

There is a continuous decrease in production over the months in:ACompany IIBCompany ICCompany IIIDCompany IV
Convert the following products into factorial: 5.6.7.8.9.10
View SolutionAre the following statements true?
7.5 litres : 15 litres = 5 kg : 10 kgView SolutionAre the following statements true ?
7.5 litres : 15 litres = 5 kg : 10 kgView Solution412115671038910775?4
View Solution1, 5, 5, 9, 7, 11, 11, 15, 12, 17
View Solution

