Plot the following hypothetical figures on time series graphs:
YearImports(Rs. thousand crore)Exports (Rs. thousand crore)2013−14 123 1062014−15 178 1402015−16 215 1592016−17 231 2032017−18 245 209
Step by step video & image solution for Plot the following hypothetical figures on time series graphs: {:("Year","Imports(Rs. thousand crore)","Exports (Rs. thousand crore)"),(2013-14," "123," "106),(2014-15," "178," "140),(2015-16," "215," "159),(2016-17," "231," "203),(2017-18," "245," "209):} by Economics experts to help you in doubts & scoring excellent marks in Class 11 exams.
Updated on:21/07/2023Topper's Solved these Questions
- ARITHMETIC LINE-GRAPHS OR TIME SERIES GRAPHSBOOK - TARUN JAIN & VK OHRICHAPTER - ARITHMETIC LINE-GRAPHS OR TIME SERIES GRAPHSEXERCISE - NCERT Questions
2 Videos
- ARITHMETIC LINE-GRAPHS OR TIME SERIES GRAPHSBOOK - TARUN JAIN & VK OHRICHAPTER - ARITHMETIC LINE-GRAPHS OR TIME SERIES GRAPHSEXERCISE - Long Answer Type Questions
3 Videos
- CENSUS AND SAMPLE METHODS OF COLLECTION OF DATABOOK - TARUN JAIN & VK OHRICHAPTER - CENSUS AND SAMPLE METHODS OF COLLECTION OF DATAEXERCISE - NCERT Question
9 Videos
Similar Questions
Knowledge Check
The following table shows the imports and exports (in Rs. Crore) of a country over 4 years (from 2016 to 2019).
 The average trade balanc (in Rs. Crores) is:A12B8C6D4
Convert the following numbers into figure form
Five crore nine lakh sixty thousand and nine
View SolutionPlot the annual profits of a firm on a time series graph:
Year201320142015201620172018Profit ('000 Rs.)607275658095
View SolutionWrite each of the following numbers in figures:
Fifty crore, forty lac, sixty thousand, nine.
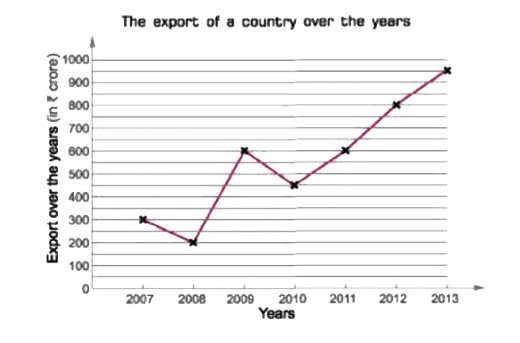
View SolutionStudy the following graph carefully and answer the given questions.

What is the total exports ( in ? Crore) for the given years ?
View SolutionWrite each of the following numbers in figures:
Nineteen crore, ninety lac, fourteen thousand, six hundred eighty.
View SolutionStudy the following bar-graph carefully and answer the question:
The average export of pearls for the given period (in crores Rs) is
View SolutionThe following table shows the imports and exports (in Rs. Crore) of a country over 4 years (from 2016 to 2019).
 The average trade balanc (in Rs. Crores) is:
View Solution
