The following are the figures of sales of two firms A and B for the years 2011-2018. Present the dats graphically.
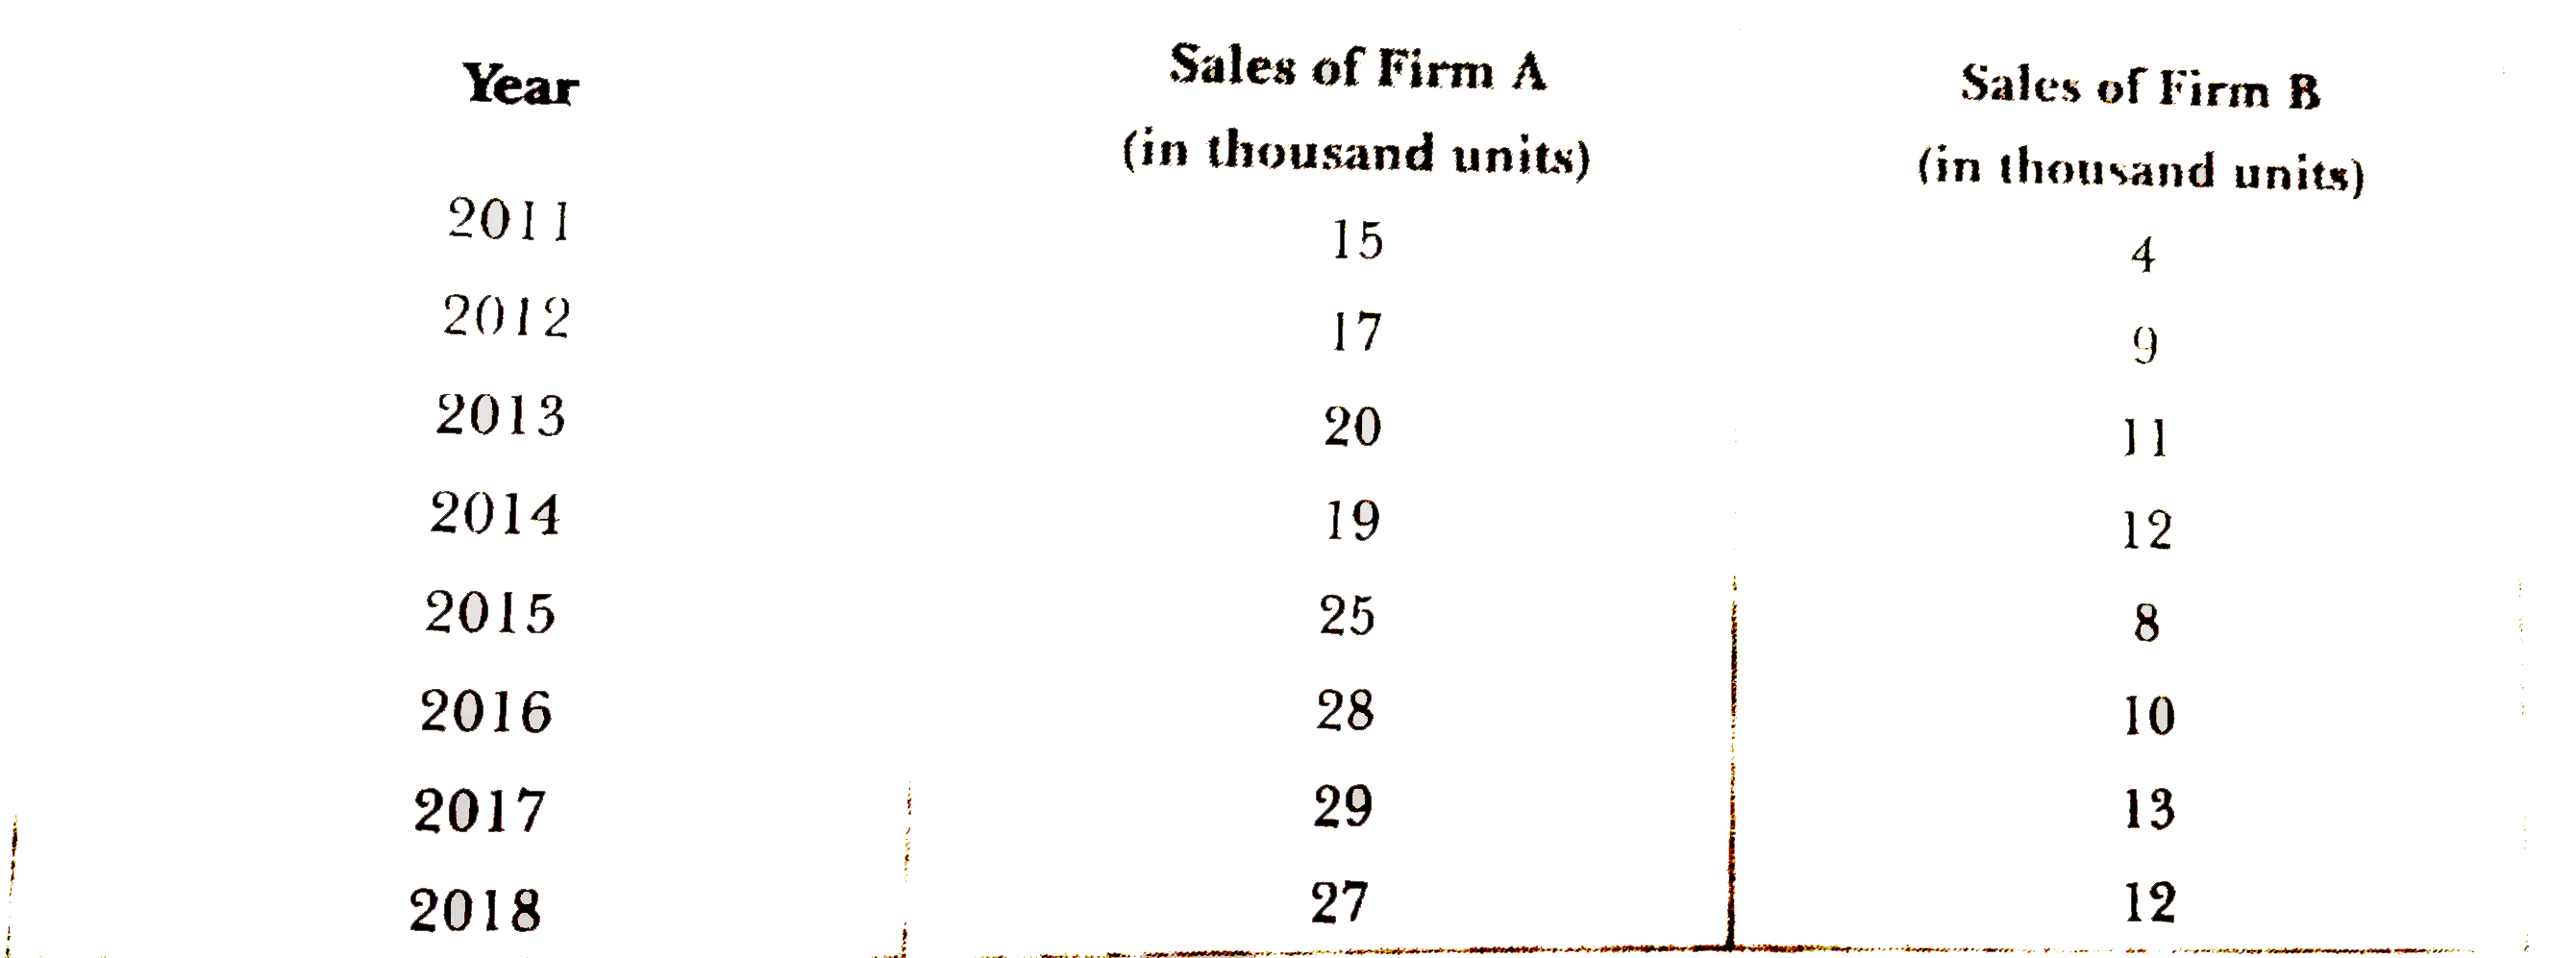
Step by step video & image solution for The following are the figures of sales of two firms A and B for the years 2011-2018. Present the dats graphically. by Economics experts to help you in doubts & scoring excellent marks in Class 11 exams.
Updated on:21/07/2023Topper's Solved these Questions
- ARITHMETIC LINE-GRAPHS OR TIME SERIES GRAPHSBOOK - TARUN JAIN & VK OHRICHAPTER - ARITHMETIC LINE-GRAPHS OR TIME SERIES GRAPHSEXERCISE - NCERT Questions
2 Videos
- ARITHMETIC LINE-GRAPHS OR TIME SERIES GRAPHSBOOK - TARUN JAIN & VK OHRICHAPTER - ARITHMETIC LINE-GRAPHS OR TIME SERIES GRAPHSEXERCISE - Long Answer Type Questions
3 Videos
- CENSUS AND SAMPLE METHODS OF COLLECTION OF DATABOOK - TARUN JAIN & VK OHRICHAPTER - CENSUS AND SAMPLE METHODS OF COLLECTION OF DATAEXERCISE - NCERT Question
9 Videos
Similar Questions
The following graph shows the sales of cars (in thousands) in four cities in 4 years. Study the graph and answer the question
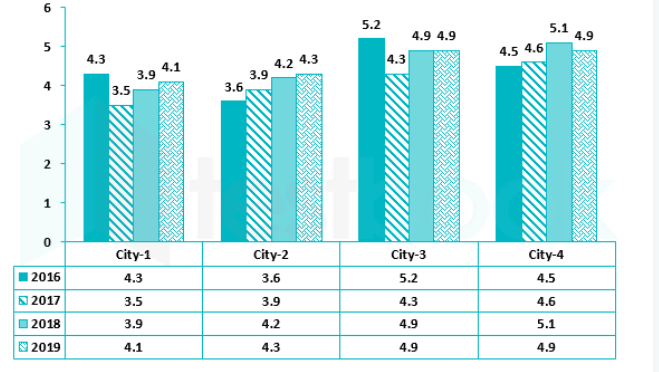
In which year. the sales are highest?
View SolutionStudy the following bar graph and answer the question that follows.
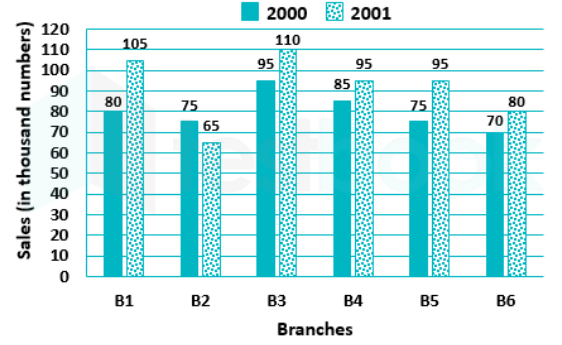
The ratio of the total sales of books for branches B2, B4 and B5 taken together for the year 2000 to the total sales of books for branches B1, B3 and B6 taken together for the year 2001 is:
View Solution
Knowledge Check
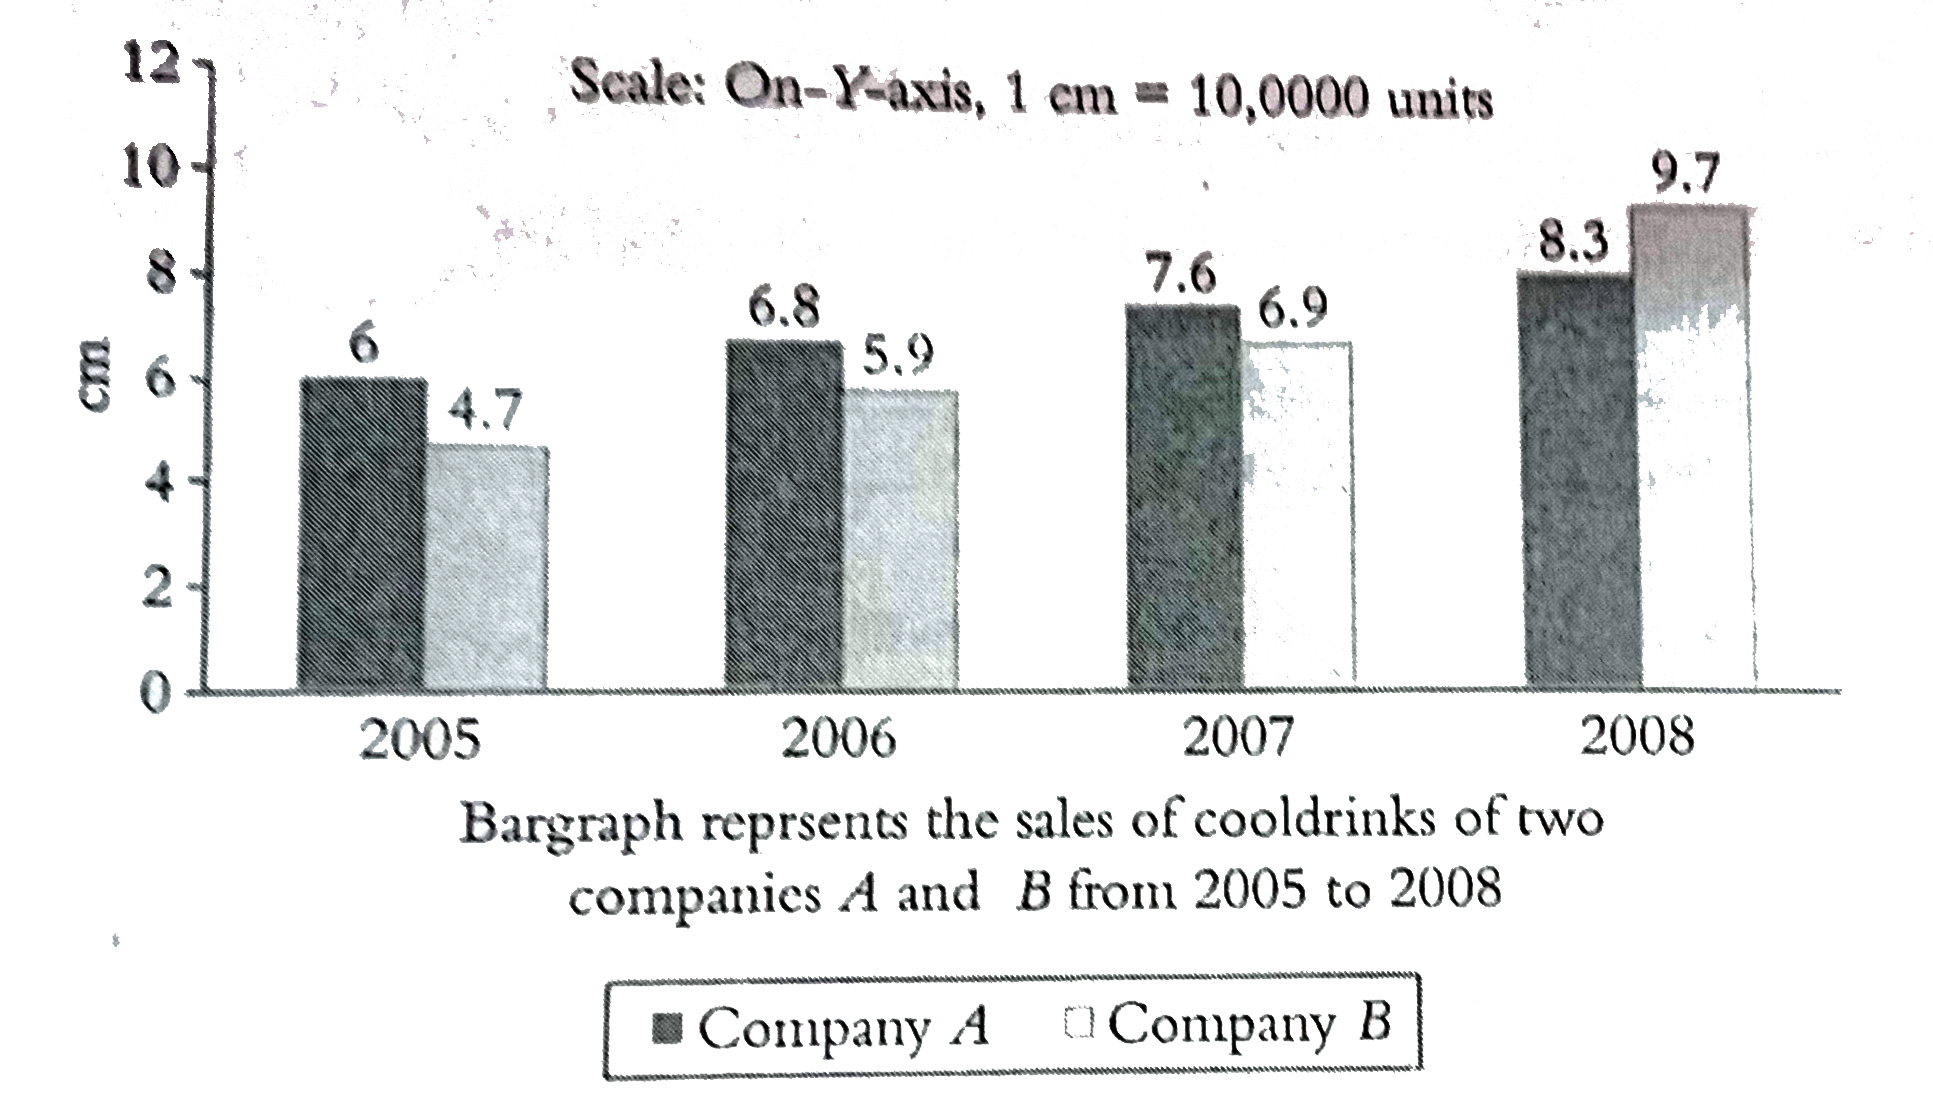
Total sales of A and B in the year 2006 is _____.A11,60,000B12,70,000C13,80,000D14,90,000The Table given below presents the profit (in multiple of thousand rupees) of a firm for the years 2010-2018. By how much percentage is the average profit of years 2015-2017 greater than the profit of 2012?
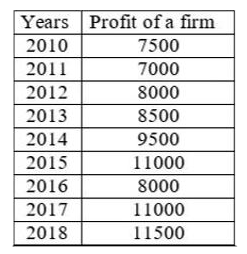 A50B12.5C25D33.33
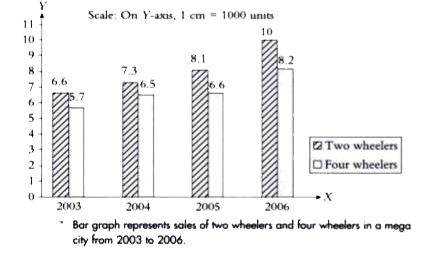
In which year the difference between sales of two wheelers and four wheelers is less?A2003B2004C2005D2006
Who among the following was awarded The Hindu Prize in Fiction category for the year 2018 ?
View SolutionThe bar chart given below shows the number of cars sold by brand A and B for the year for 2008 to 2016
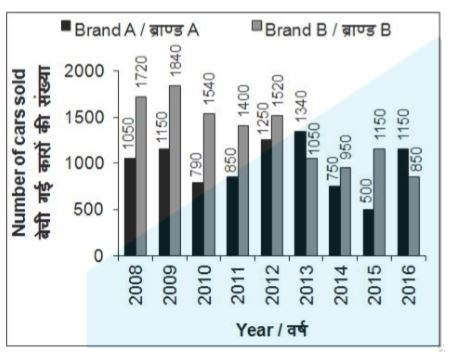
The total sales of the two brands in year 2015 is what percent of the total sales in 2016?
View SolutionThe bar chart given below shows the sales (in crores) of 2 companies A and B from years 2010 to 2015.
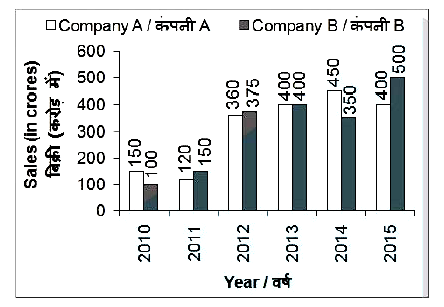
What is the percentage change in sale of company B from years 2011 to 2012?
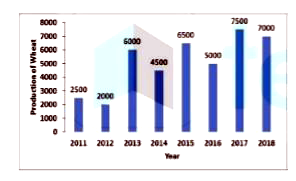
View SolutionThe Bar graph given below presents the production of wheat (in tonnes) by a big farm during the years 2011-2018. In how many of the given years was the production of wheat greater than the average production of the period?
View SolutionThe given bar chart shows the details of cycle sales by a company between January and May for years 2017 and 2018.
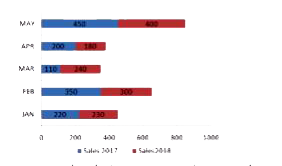
In the given bar-chart, what is the total increase or decrease in percentage sale in 2018?
View Solution
