The following are the sales figures of TVs of Firm A, during 2013, 2018:
Year201320142015201620172018Sale (in thousand units)2,1552,2012,1902,2502,0952,170
Step by step video & image solution for The following are the sales figures of TVs of Firm A, during 2013, 2018: {:("Year",2013,2014,2015,2016,2017,2018),("Sale (in thousand units)","2,155","2,201","2,190","2,250","2,095","2,170"):} by Economics experts to help you in doubts & scoring excellent marks in Class 11 exams.
Updated on:21/07/2023Topper's Solved these Questions
- ARITHMETIC LINE-GRAPHS OR TIME SERIES GRAPHSBOOK - TARUN JAIN & VK OHRICHAPTER - ARITHMETIC LINE-GRAPHS OR TIME SERIES GRAPHSEXERCISE - NCERT Questions
2 Videos
- ARITHMETIC LINE-GRAPHS OR TIME SERIES GRAPHSBOOK - TARUN JAIN & VK OHRICHAPTER - ARITHMETIC LINE-GRAPHS OR TIME SERIES GRAPHSEXERCISE - Long Answer Type Questions
3 Videos
- CENSUS AND SAMPLE METHODS OF COLLECTION OF DATABOOK - TARUN JAIN & VK OHRICHAPTER - CENSUS AND SAMPLE METHODS OF COLLECTION OF DATAEXERCISE - NCERT Question
9 Videos
Similar Questions
Knowledge Check
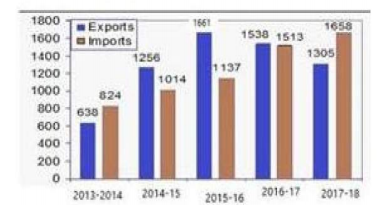
The given Bar Graph present the Imports and Exports of an item (in tonnes) manufactured by a company for the five financial years, 2013-2014 to 2017-2018.
दिया गया दंड आरेख (बार ग्राफ) पांच वित्त वर्षों, 2013-2014 से 2017-2018, के दौरान किसी कंपनी दवारा निर्यात किसी वस्तु (टन में] के आयात और निर्यात को दर्शाता है| What is the ratio of total Imports to total Exports during 2013-2014, 2015-2016 and 2017-2018?
2013-2014, 2015-2016 3X 2017-2018 के दौरान कुल आयात का कुल निर्यात से क्या अनुपात है?A3604:3073B4011:4175C3619:3604D4175:4011If a=√(2013)2+2013+2014, then the value of a is
A1002B1007C2013D2014
Represent the following data related to export and imports to India (hypothetical figures) graphically:
Year2012201320142015201620172018Exports (in Rs. crore)300350400380450280250Imports (in Rs. crore)420460600480550450400
View SolutionRepresent the following data related to population (in thousands) of men and women in a village in different years graphically:
Year2012201320142015201620172018Number of Men10131514171821Number of Women12181617202224
View SolutionFollowing table gives hypothetical figures of exports from India during the years 2013-14 to 2017-18. Present the information in the form of a suitable graph.
Year2013−142014−152015−162016−172017−18Exports (Rs. core)600640670780900
View SolutionPlot the following hypothetical figures on time series graphs:
YearImports(Rs. thousand crore)Exports (Rs. thousand crore)2013−14 123 1062014−15 178 1402015−16 215 1592016−17 231 2032017−18 245 209
View SolutionThe profits of a firm for the last five years were as follows :
Year ended 31st MarchProfits (Rs.)201143,000201250,000201352,000201465,000201585,000
You are required to calculate the value of goodwill on the basis of two year's purchase of weighted average profits. The weights to be used are :
2011 - 1, 2012 - 2, 2013 - 3, 2014 - 4, 2015 - 5.
View SolutionThe profits ear ned by a firm during the last four years were as follows:
Year ended 31st MarchProfits (Rs.)201380,00020141,00,00020151,10,00020161,50,000
Calculate the value of goodwill on the basis of three year's purchase of weighted average profits. Weights to be used are 1,2,3 and 4 respectively to the profits for 2013, 2014, 2015 and 2016.
View Solution
