What is the line of best fit ?
Line of best fit is the one that passes through the scattered points such that it represents most of these points.Roughly, half of the scattered points should be on either side of the line .
Topper's Solved these Questions
- CORRELATIONBOOK - TARUN JAIN & VK OHRICHAPTER - CORRELATIONEXERCISE - Short answer type questions
10 Videos
- CORRELATIONBOOK - TARUN JAIN & VK OHRICHAPTER - CORRELATIONEXERCISE - Long answer type questions
7 Videos
- CORRELATIONBOOK - TARUN JAIN & VK OHRICHAPTER - CORRELATIONEXERCISE - Choose apporpiate word and fill in the blank
4 Videos
- CONCEPT OF ECONOMICS AND SIGNIFICANCE OF STATISTICS IN ECONOMICSBOOK - TARUN JAIN & VK OHRICHAPTER - CONCEPT OF ECONOMICS AND SIGNIFICANCE OF STATISTICS IN ECONOMICSEXERCISE - NCERT Questions
6 Videos
- DIAGRAMMATIC PRESENTATION OF DATA BAR DIAGRAMS AND PIE DIAGRAMSBOOK - TARUN JAIN & VK OHRICHAPTER - DIAGRAMMATIC PRESENTATION OF DATA BAR DIAGRAMS AND PIE DIAGRAMSEXERCISE - NCERT Question (With Hints to Answers)
3 Videos
Similar Questions
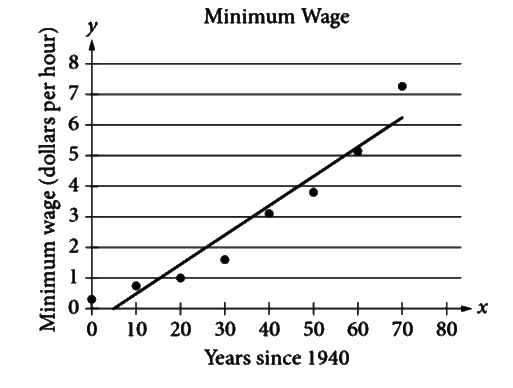
The scatterplot above shows the federal-mandated minimum wage every 10 years between 1940 and 2010. A line of best fit is shown, and its equation is y = 0.096x − 0.488.What does the line of best fit predict about the increase in the minimum wage over the 70-year period?
View Solution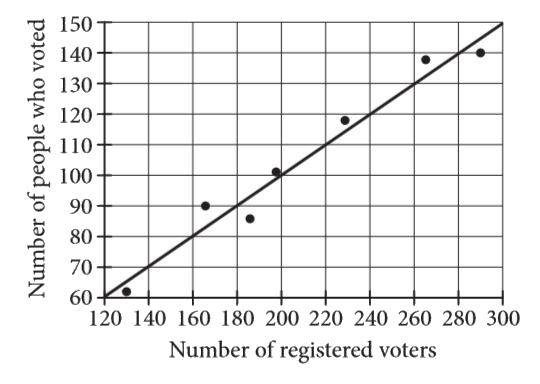
The scatterplot above shows the number of registered voters, x, and the number of people who voted in the last election, y, for seven districts in a town. A line of best fit for the data is also shown. Which of the following could be the equation of the line of best fit?
View Solution
Knowledge Check
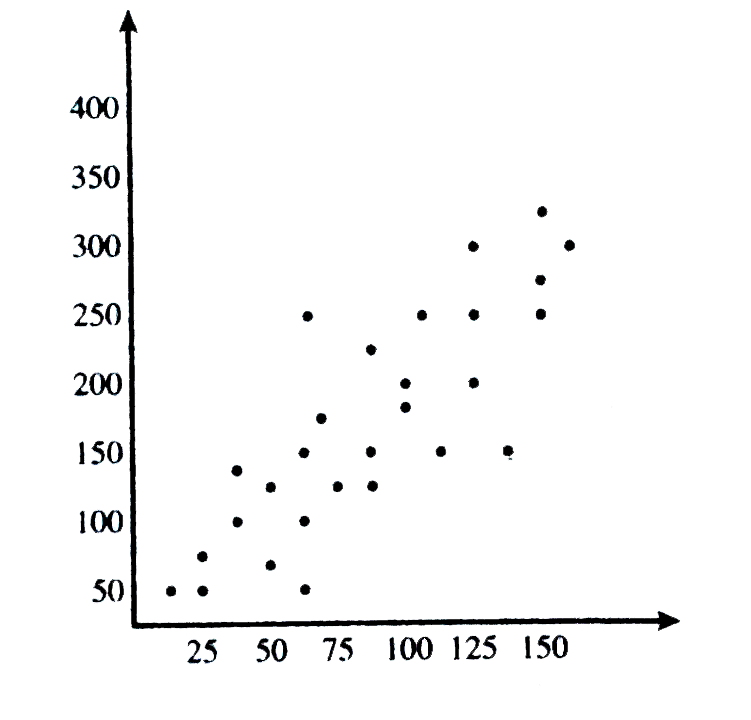
For the scatterplot above , which is closest to the slope of the line of best fit ?A12B1C2D3what is the greatest difference between the actual value of the stock and the value of the stock predicted by the line of best fit?
A25B55C75D95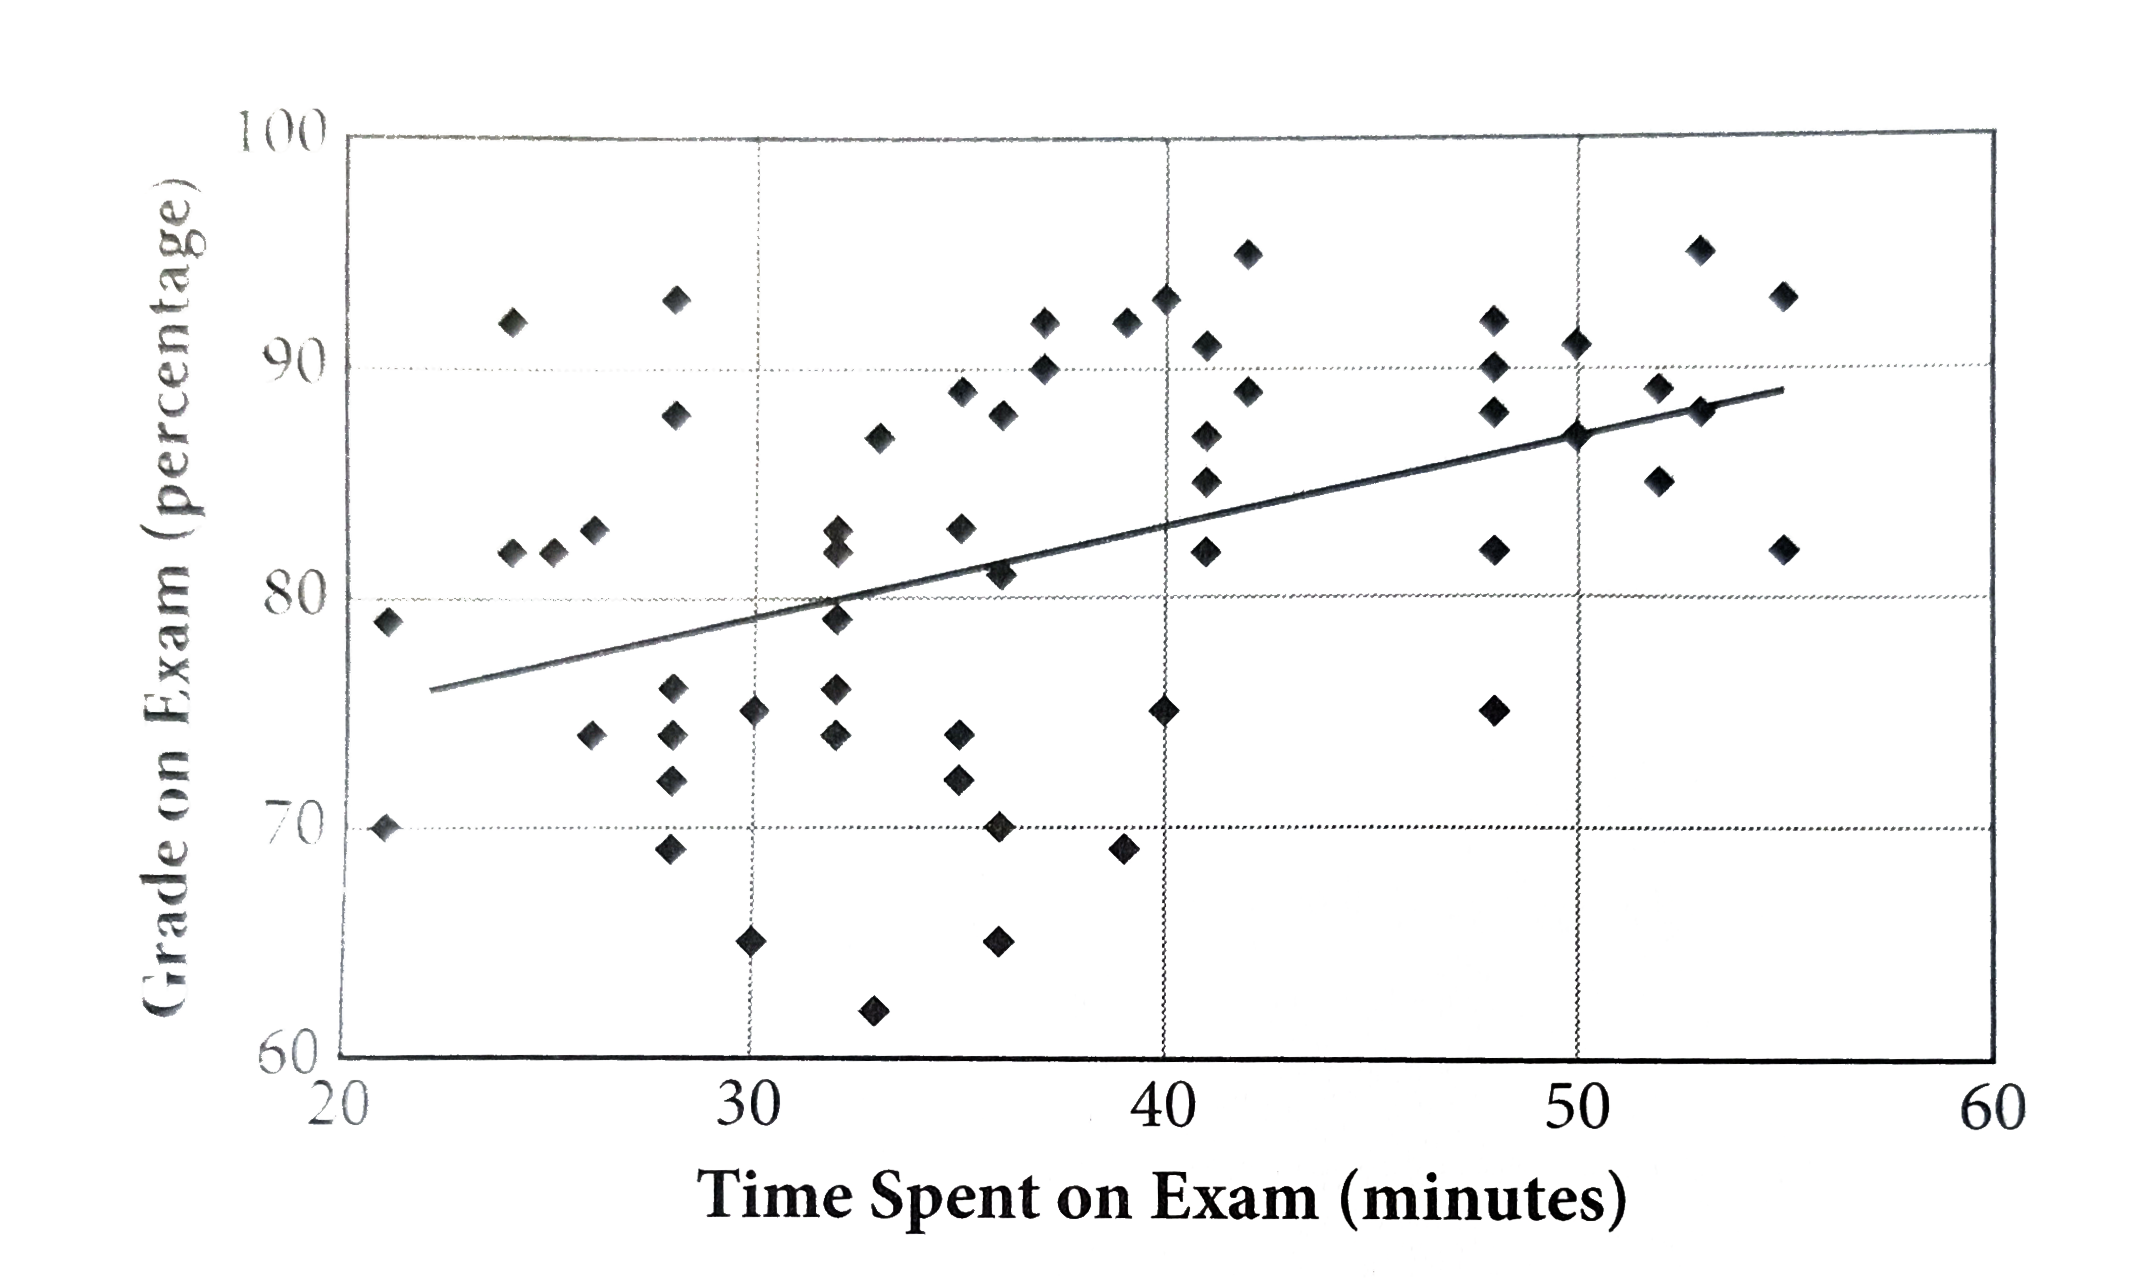
A physicas professor presented the scatterplot above to her first-year students. What is the significance of the slope of the line of best fit ?AThe slope represents the rate at which time spent on an exam increases based on a student's exam performance.BThe slope represents the average grade on the exam.CThe slope represents the rate at which a student's exam grade increases based on time spent on the exam.DThe slope has no significance.
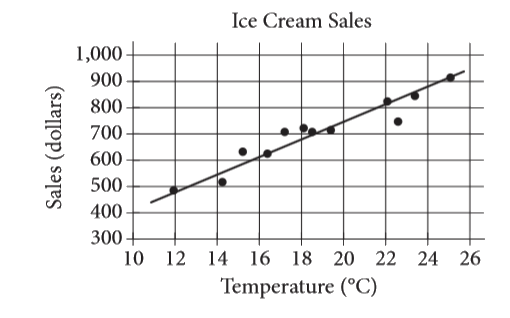
The scatterplot above shows a company’s ice cream sales d, in dollars, and the high temperature t, in degrees Celsius (.∘C), on 12 different days. A line of best fit for the data is also shown. Which of the following could be an equation of the line of best fit?
View Solution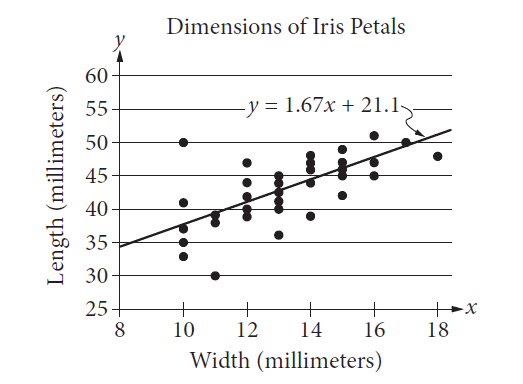
The scatterplot above shows data collected on the lengths and widths of Iris setosa petals. A line of best fit for the data is also shown. Based on the line of best fit, if the width of an Iris setosa petal is 19 millimeters, what is the predicted length, in millimeters, of the petal?
View Solution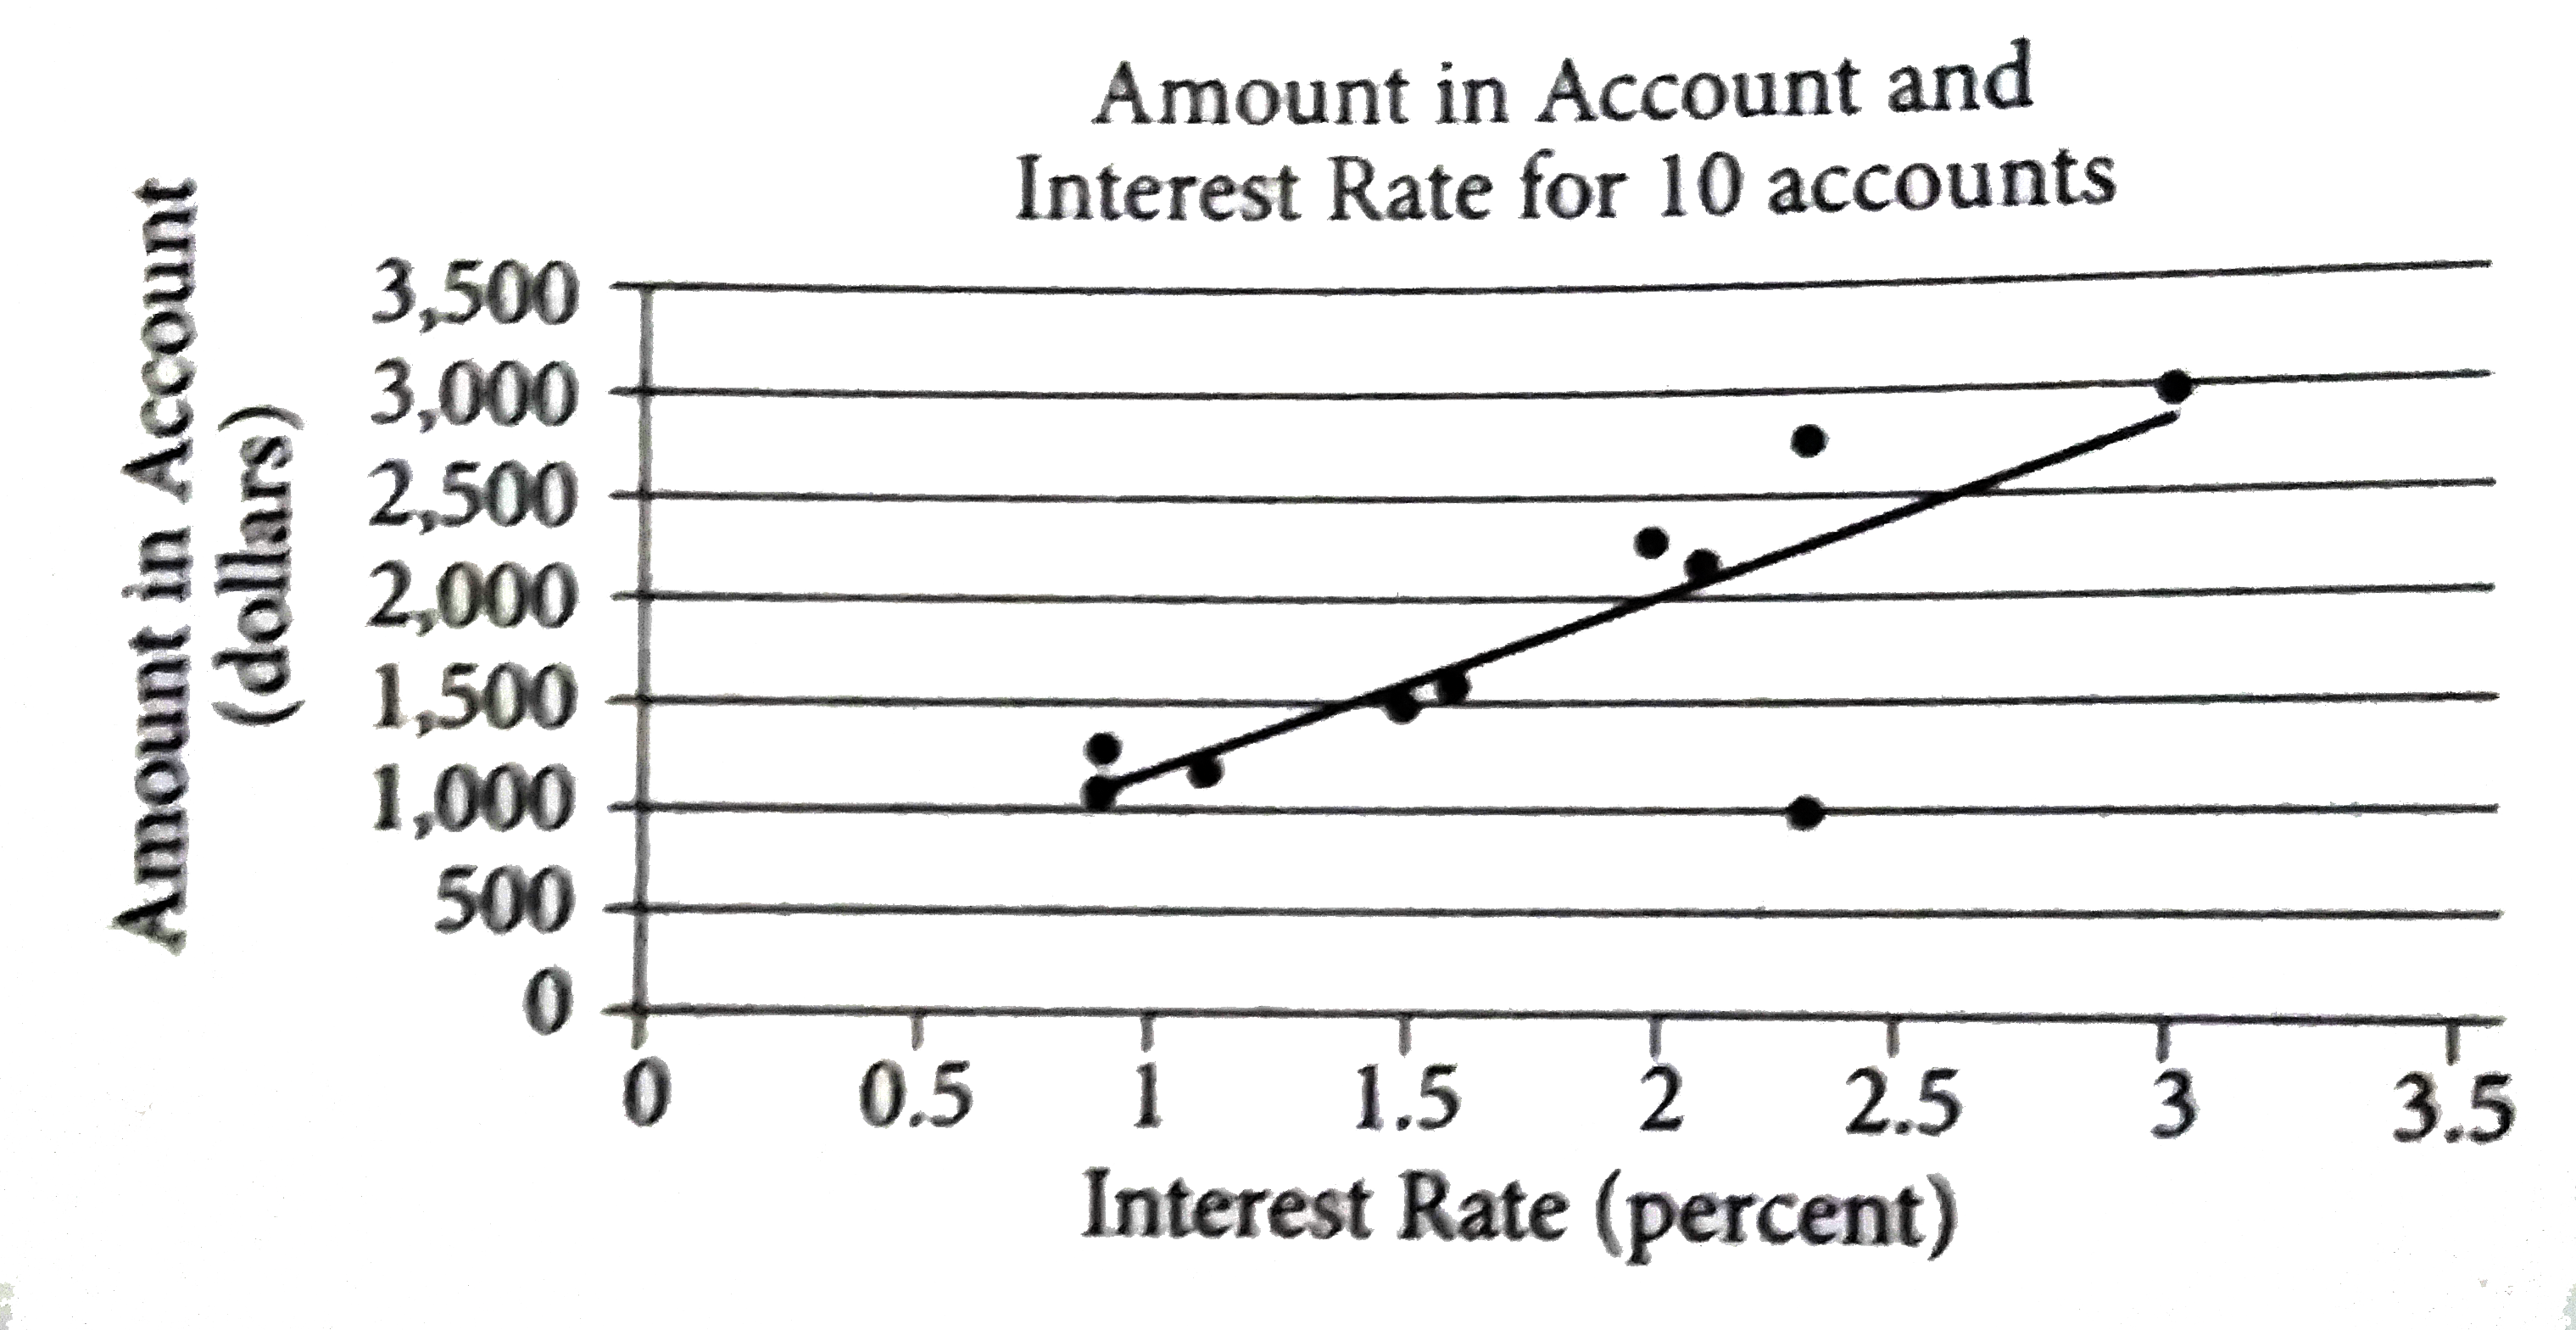
The scatterplot above shows data for ten accounts opened by a company , along with the line of best fit. For the account that contains the least amount of money, which of the following is closest to the difference of the actual amount and the amount predicted by the line of best fit?
View Solution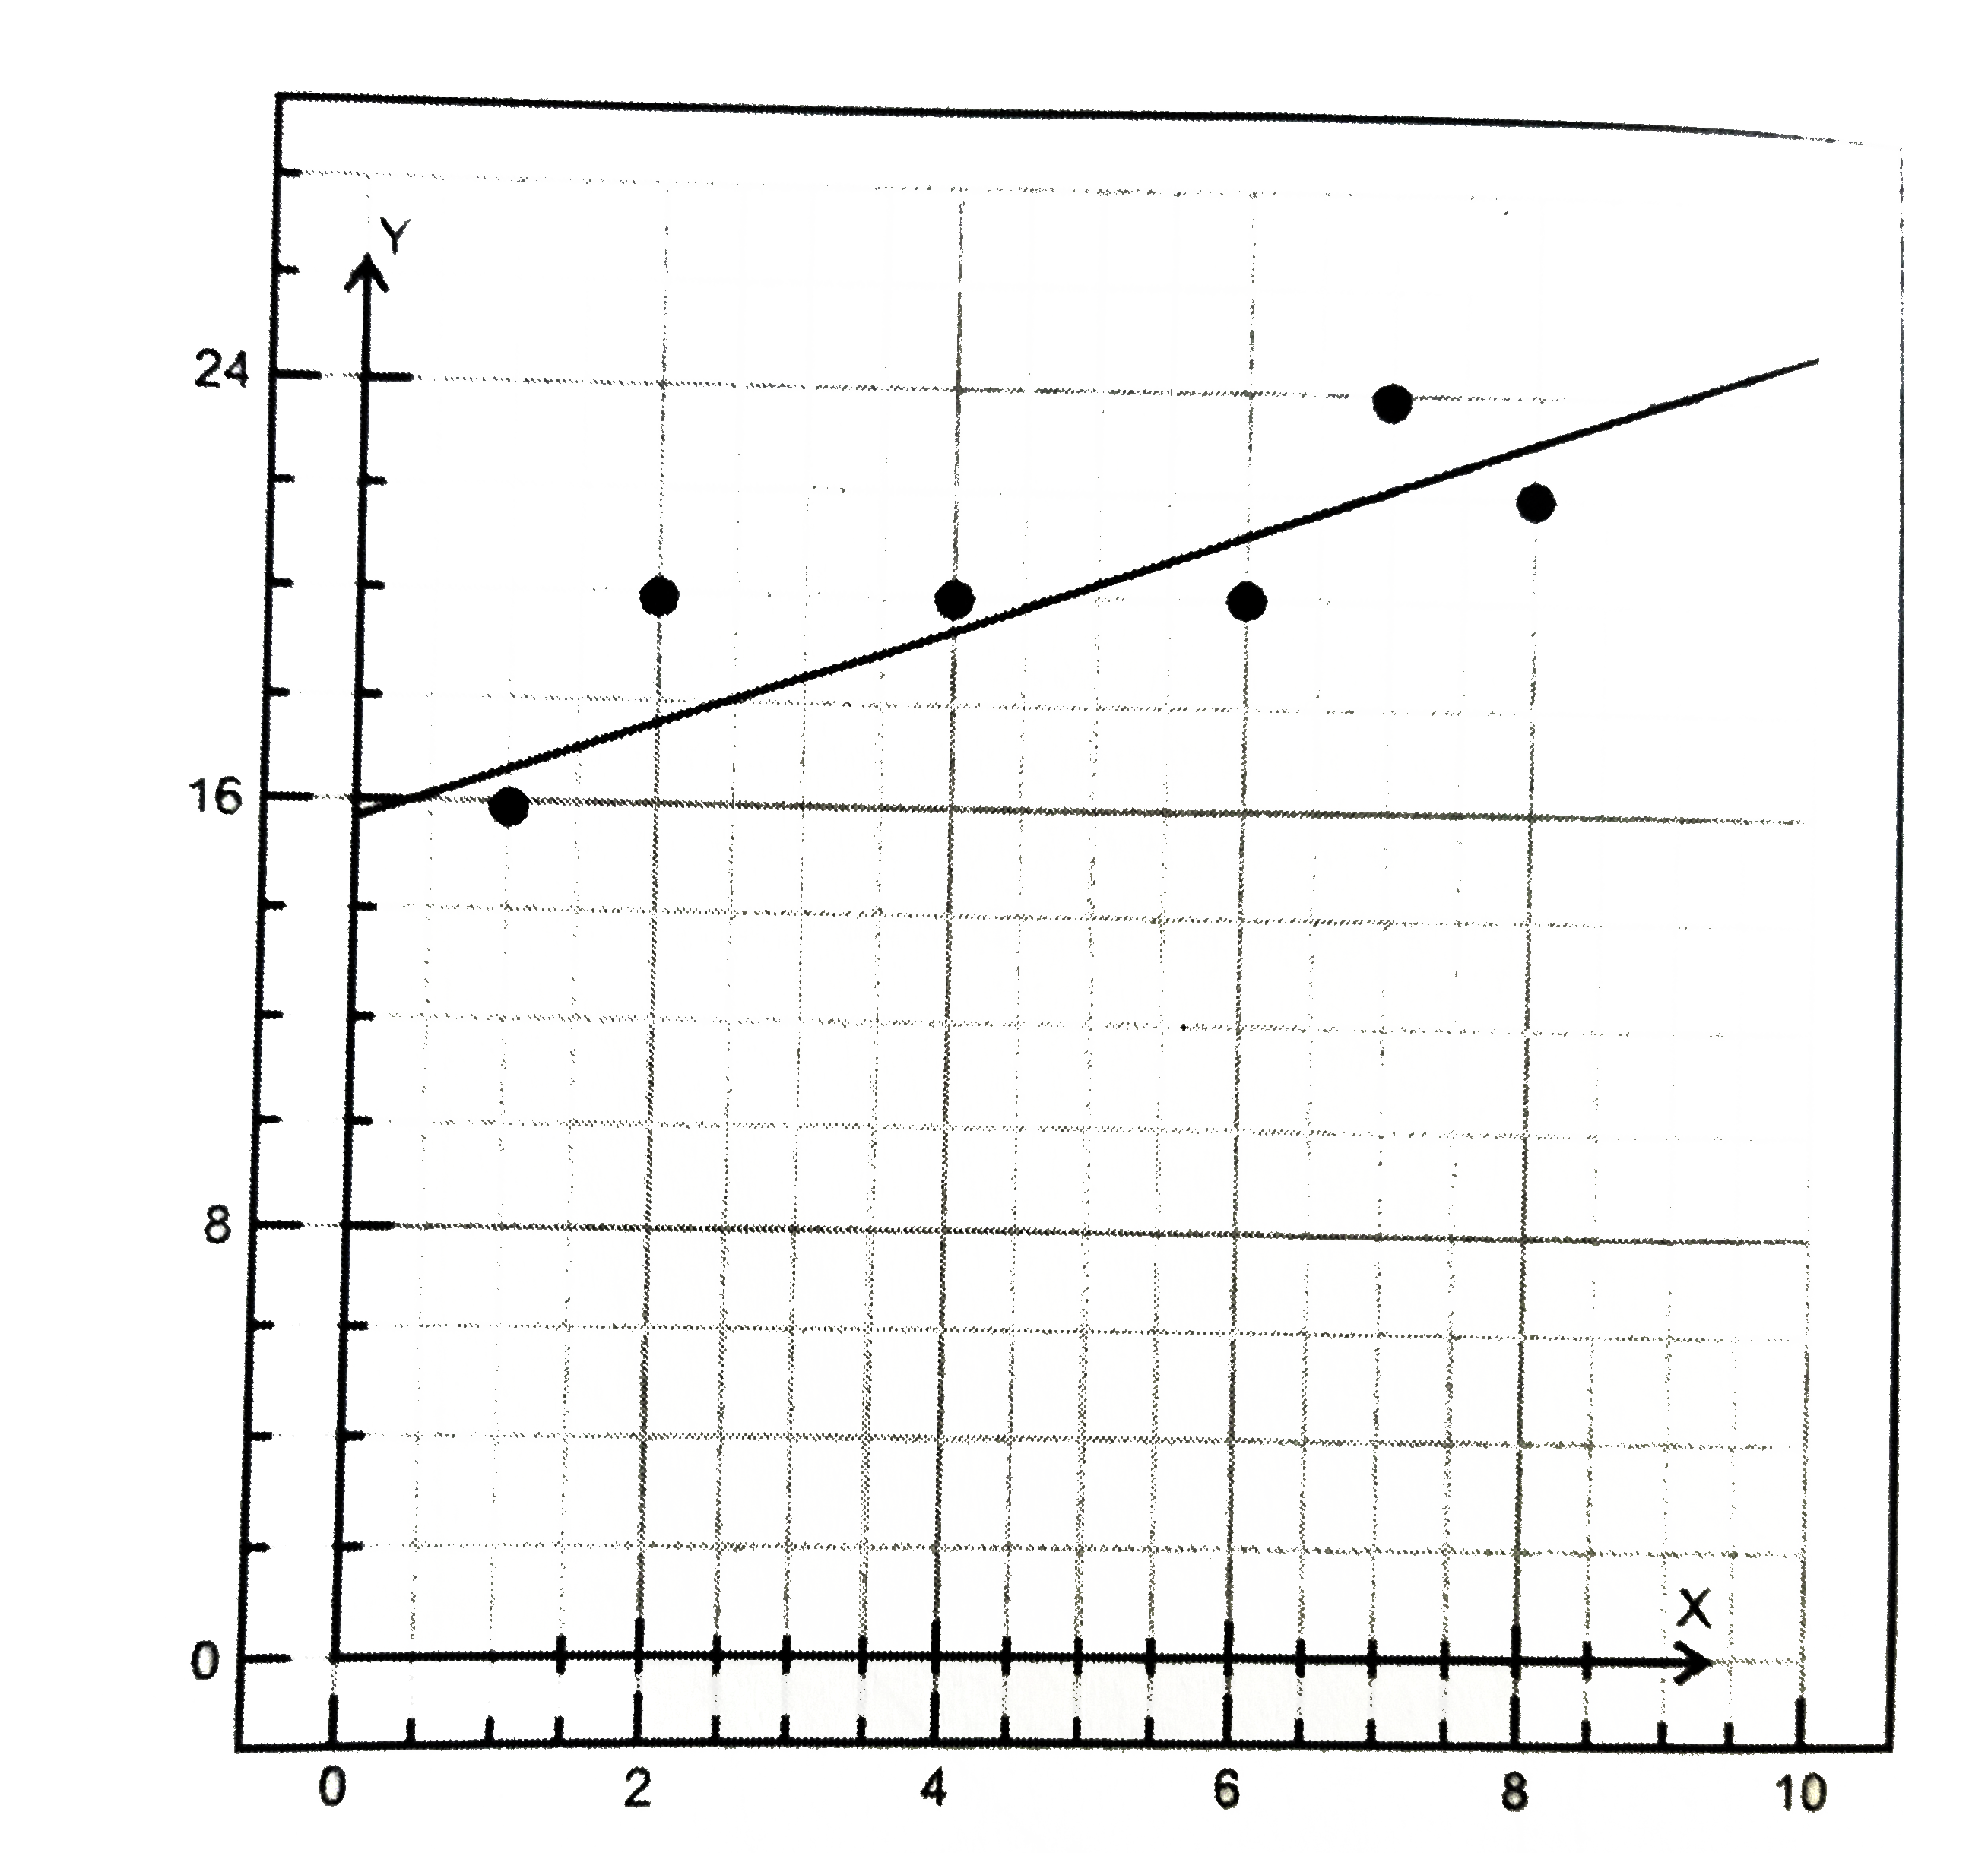
In a experiment a set of points denoted by the (x,y) coordinates are shown in the graph above along with the line of best fit. Which of the following is the best equation for the above line ?
View Solution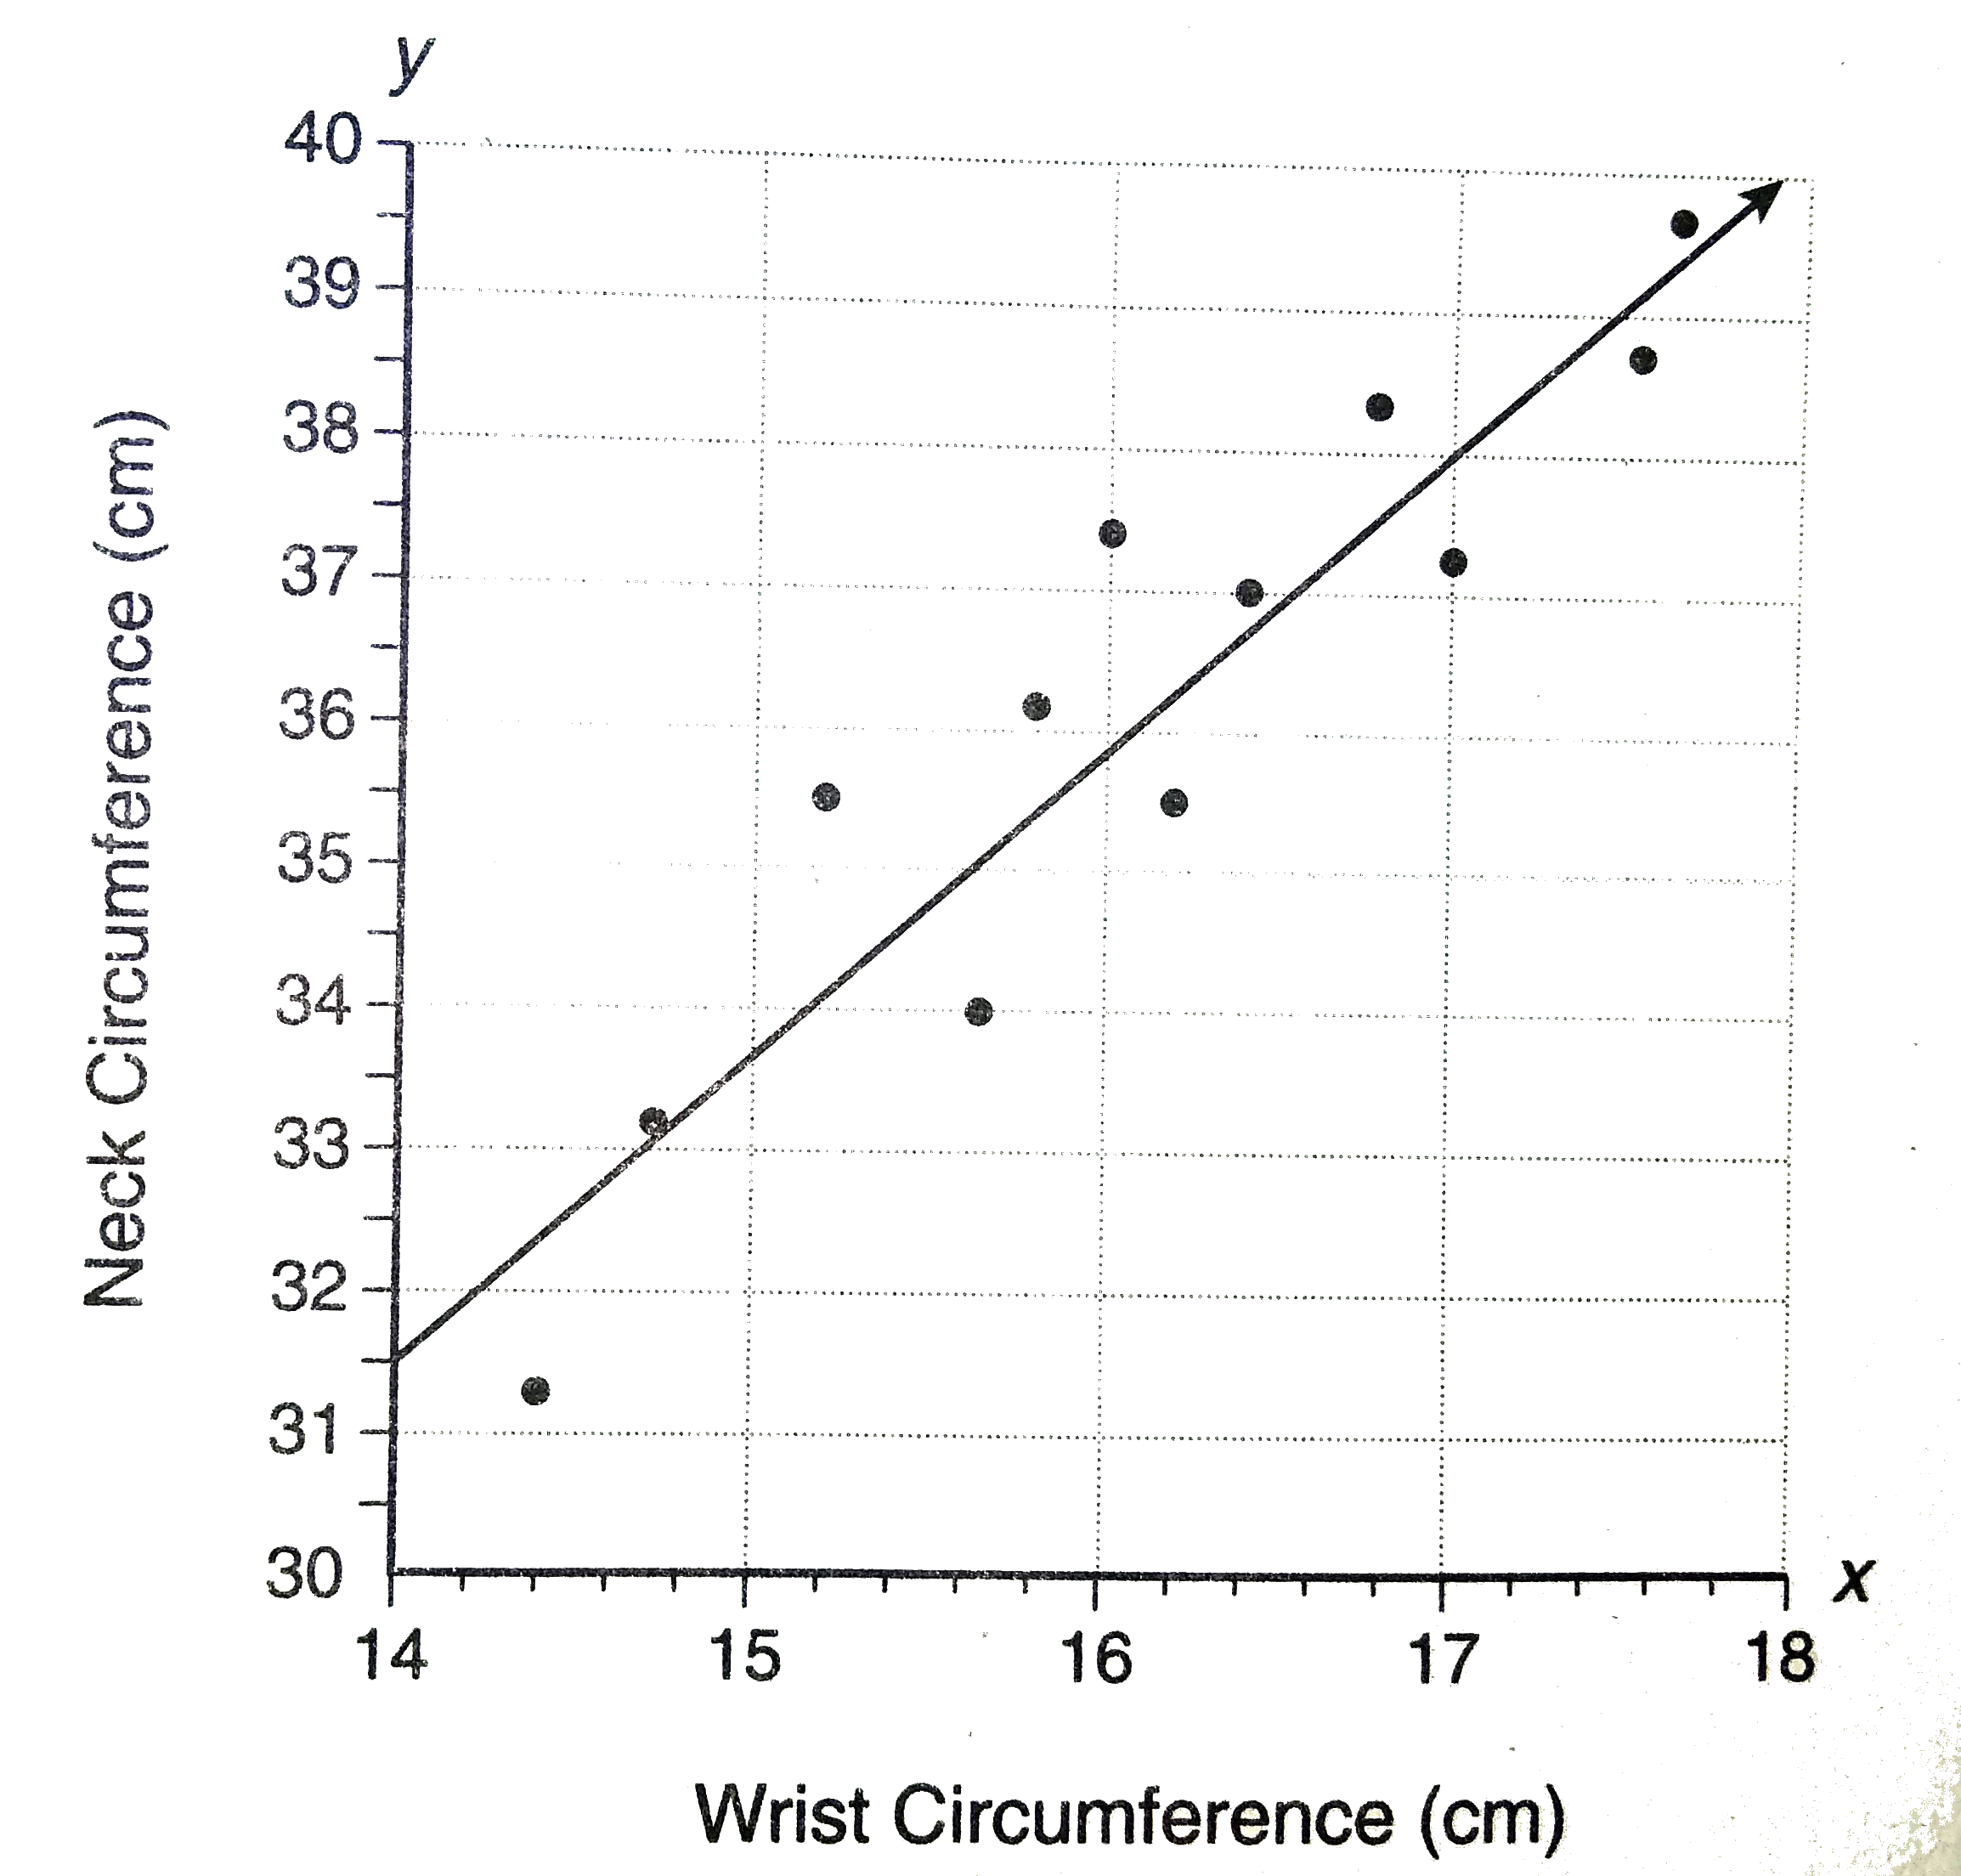
The scatterplot above summarizes the wrist and neck circumference measurements, in centimeters, for 12 people. The line of best fit is drawn. What proportion of the measurements satisfy the inequality |o−p|≤d, where o is the observed measurement, p is corresponding measurement predicted by the line of best fit, and d is 0.5cm?
View Solution
