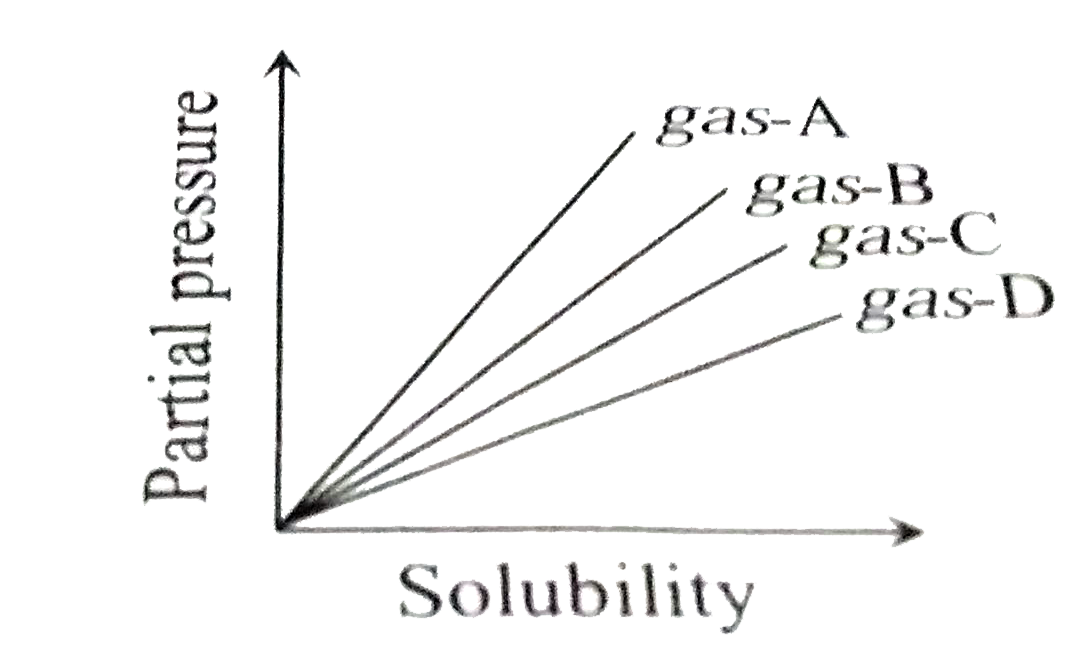
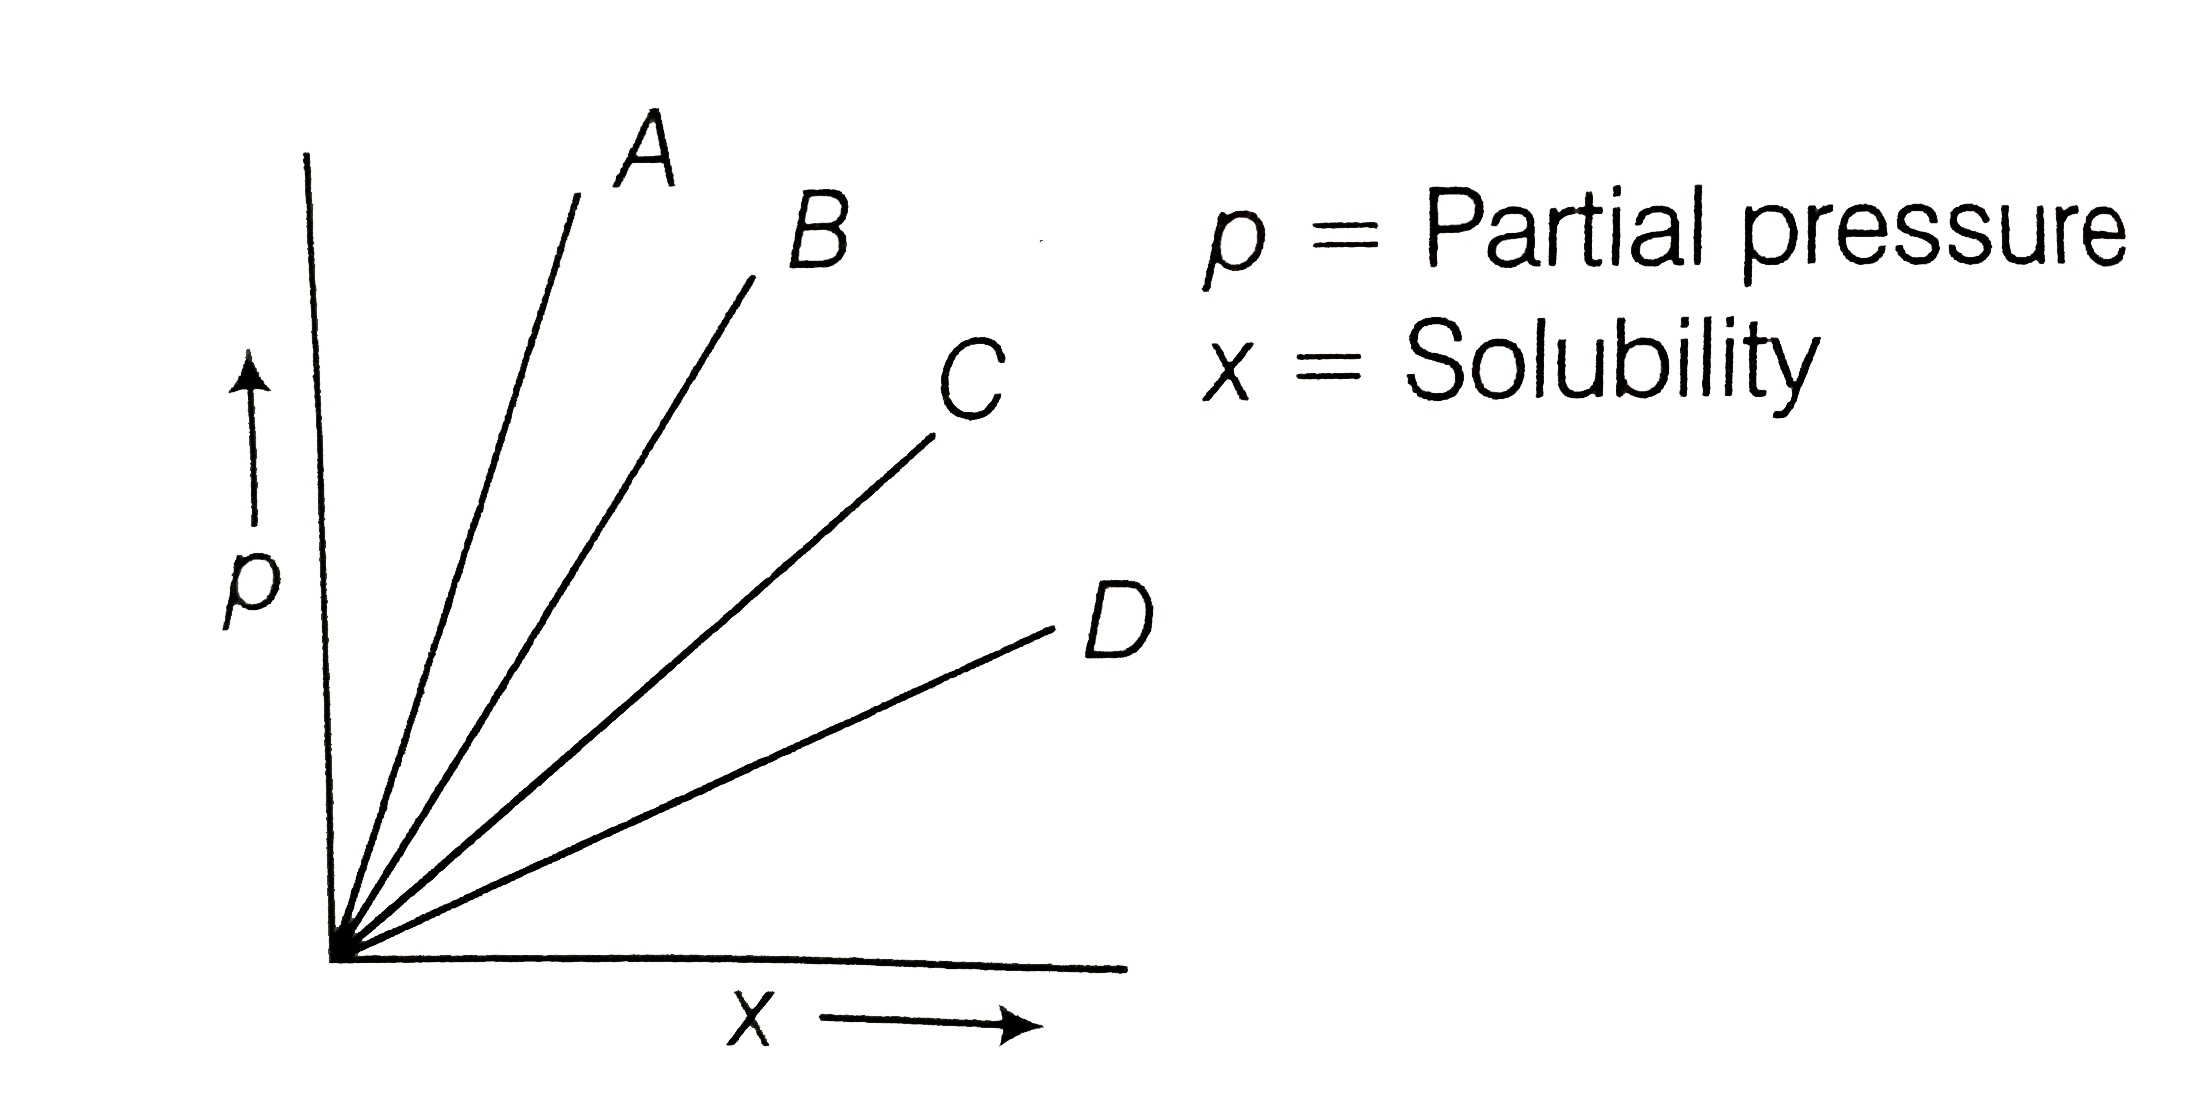
Following graphs are obtained when different gases are subjected to change in pressure at constant temperature. Identify the option which has correctly matched gas wth the graph.
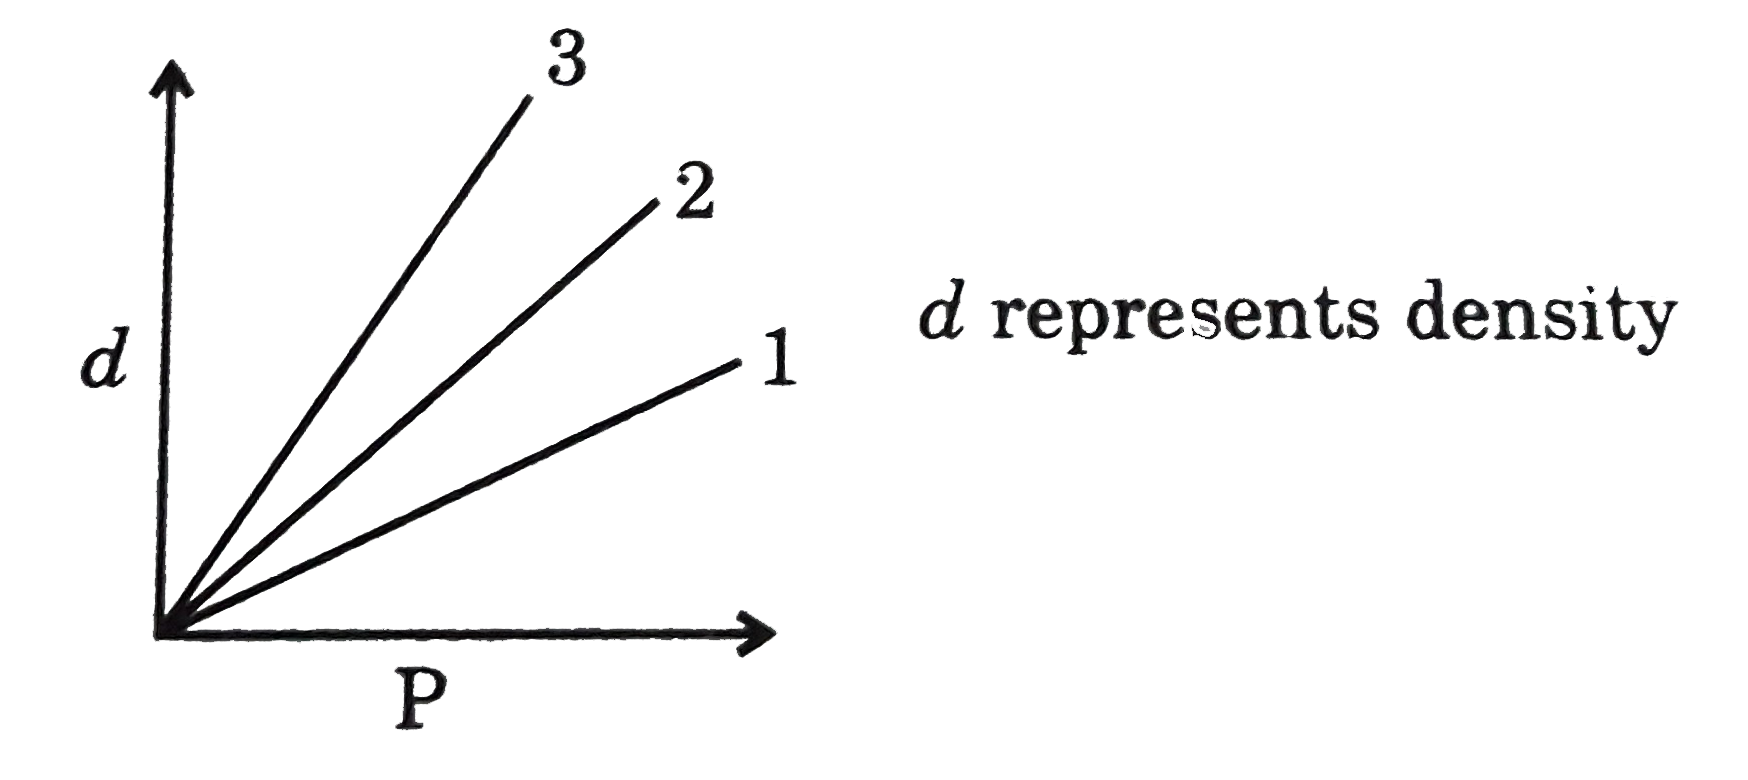
1→O2,2→H2,3→He
1→CH4,2→N2,3→CO
1→H2,2→O2,3→SO2
1→SO3,2→CO2,3→He
The correct Answer is:C
Topper's Solved these Questions
- GRAPHICAL INTERPRETATIONBOOK - GRB PUBLICATIONCHAPTER - GRAPHICAL INTERPRETATIONEXERCISE - C. Atomic Sturcture
1 Videos
- GRAPHICAL INTERPRETATIONBOOK - GRB PUBLICATIONCHAPTER - GRAPHICAL INTERPRETATIONEXERCISE - Atomic Sturcture
9 Videos
- GRAPHICAL INTERPRETATIONBOOK - GRB PUBLICATIONCHAPTER - GRAPHICAL INTERPRETATIONEXERCISE - B. Gaseous State
1 Videos
- F-BLOCK ELEMENTSBOOK - GRB PUBLICATIONCHAPTER - F-BLOCK ELEMENTSEXERCISE - Subjective type
7 Videos
- HYDROCARBON (ALIPHATIC)BOOK - GRB PUBLICATIONCHAPTER - HYDROCARBON (ALIPHATIC)EXERCISE - Previous years jee questions
28 Videos
Similar Questions
Knowledge Check
Following graphs are obtained when different gases are subjected to change in pressure at constant temperature.
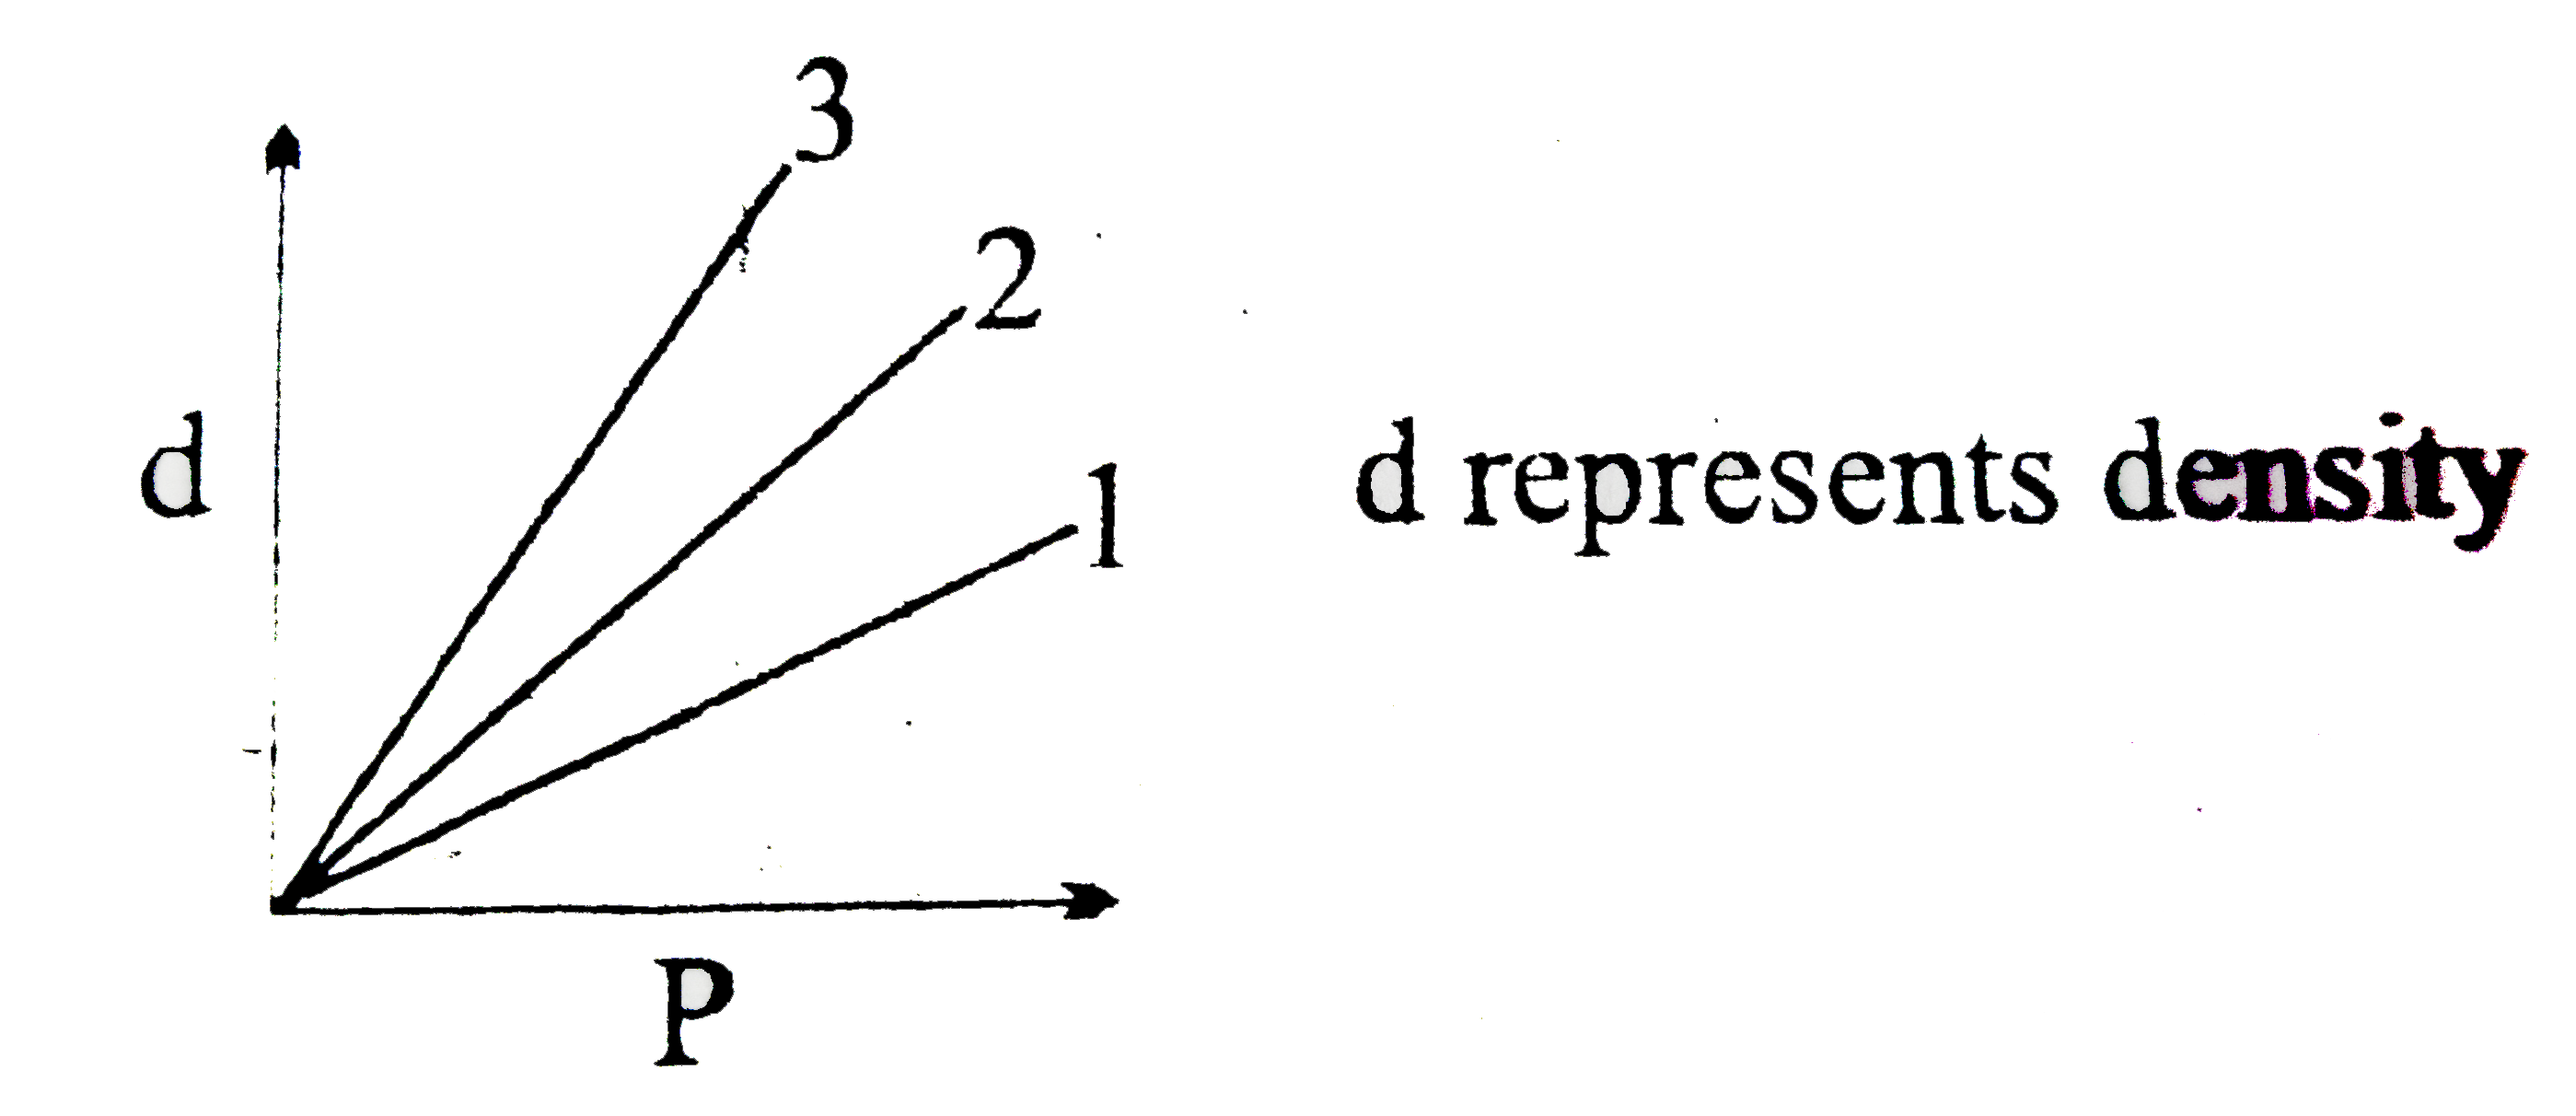
Identify the option which has correctly matched gas with the graph.A1→O2,2→H2,3→HeB1→CH4,2→N2,3→COC1→H2,2→O2,3→SO2D1→SO3,2→CO2,3→HeFor fixed mass of an ideal gas a constant temperature. Which is correct graph ?
A B
B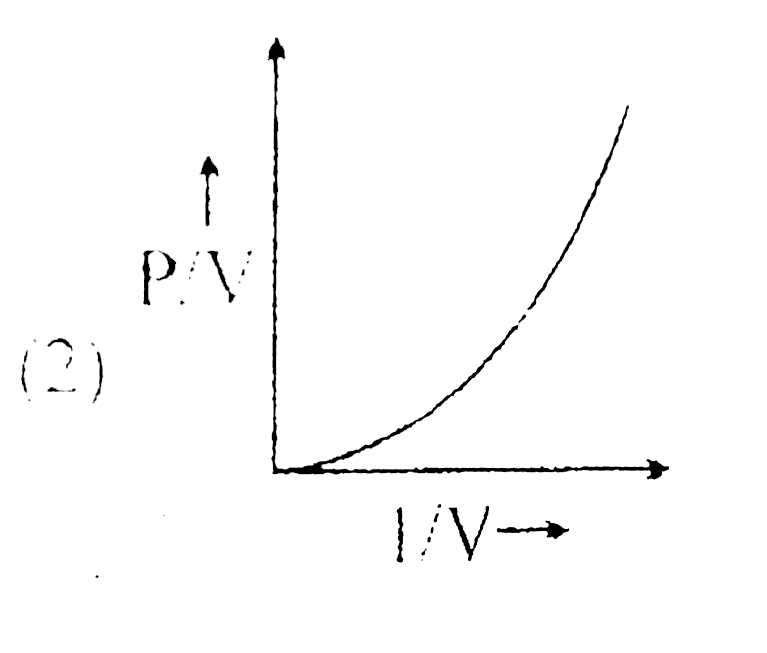 C
C D
D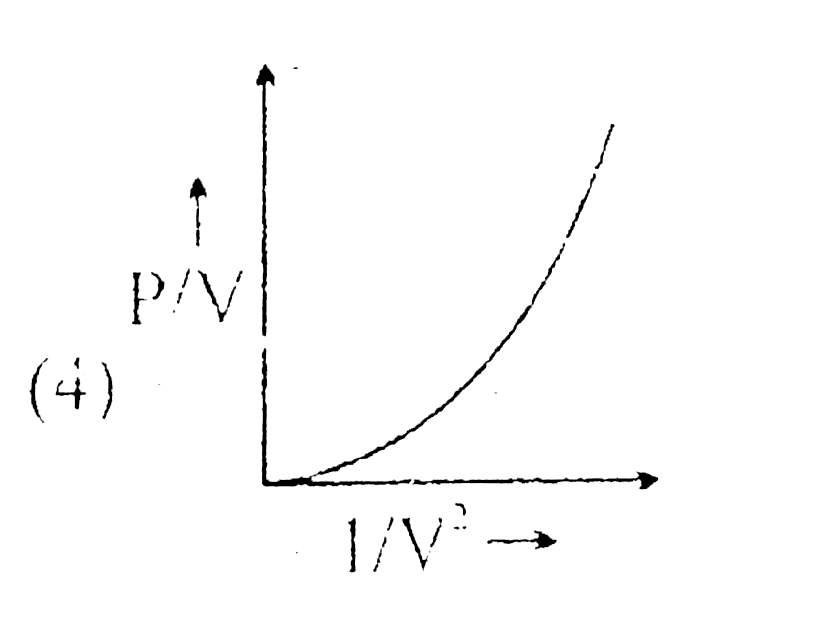
Following is the digrammatic representation of the operation of natural selection on different traits. Which of the following options correctly identifies all the three graphs A,B and C?
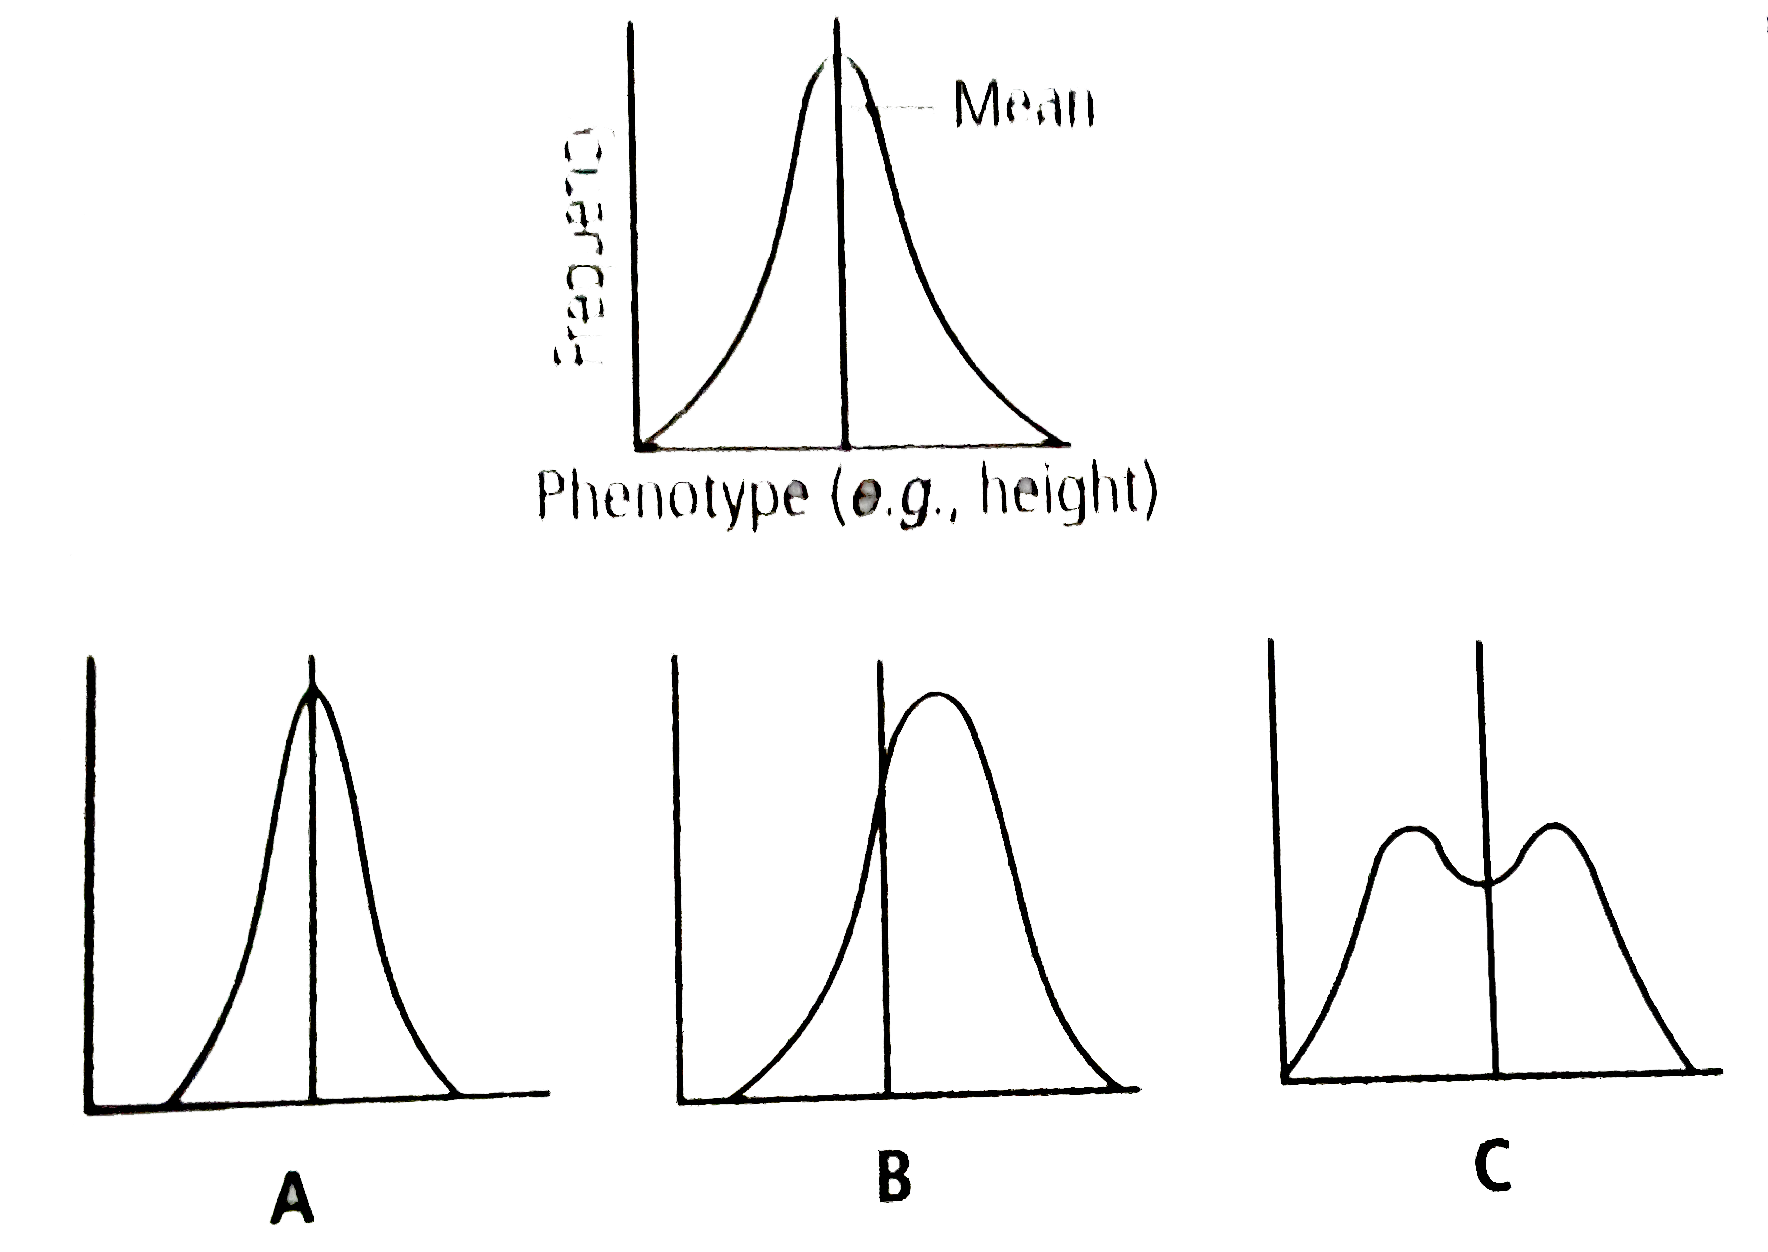 AABCDirectionalStabilisingDisruptiveBABCStabilisingDirectionalDisruptiveCABCDistruptiveStatbilisingDirectionalDABCDirectionalDisruptiveStabilising
If heat energy is given to an ideal gas at constant pressure, then select the graph which best represents the variation of VT with temperature (T).
View SolutionFollowing is the digrammatic representation of the operation of natural selection on different traits. Which of the following options correctly identifies all the three graphs A,B and C?

View SolutionWhat is the nature of graph of PV versus P for a given mass of a gas at constant temperature?
View Solution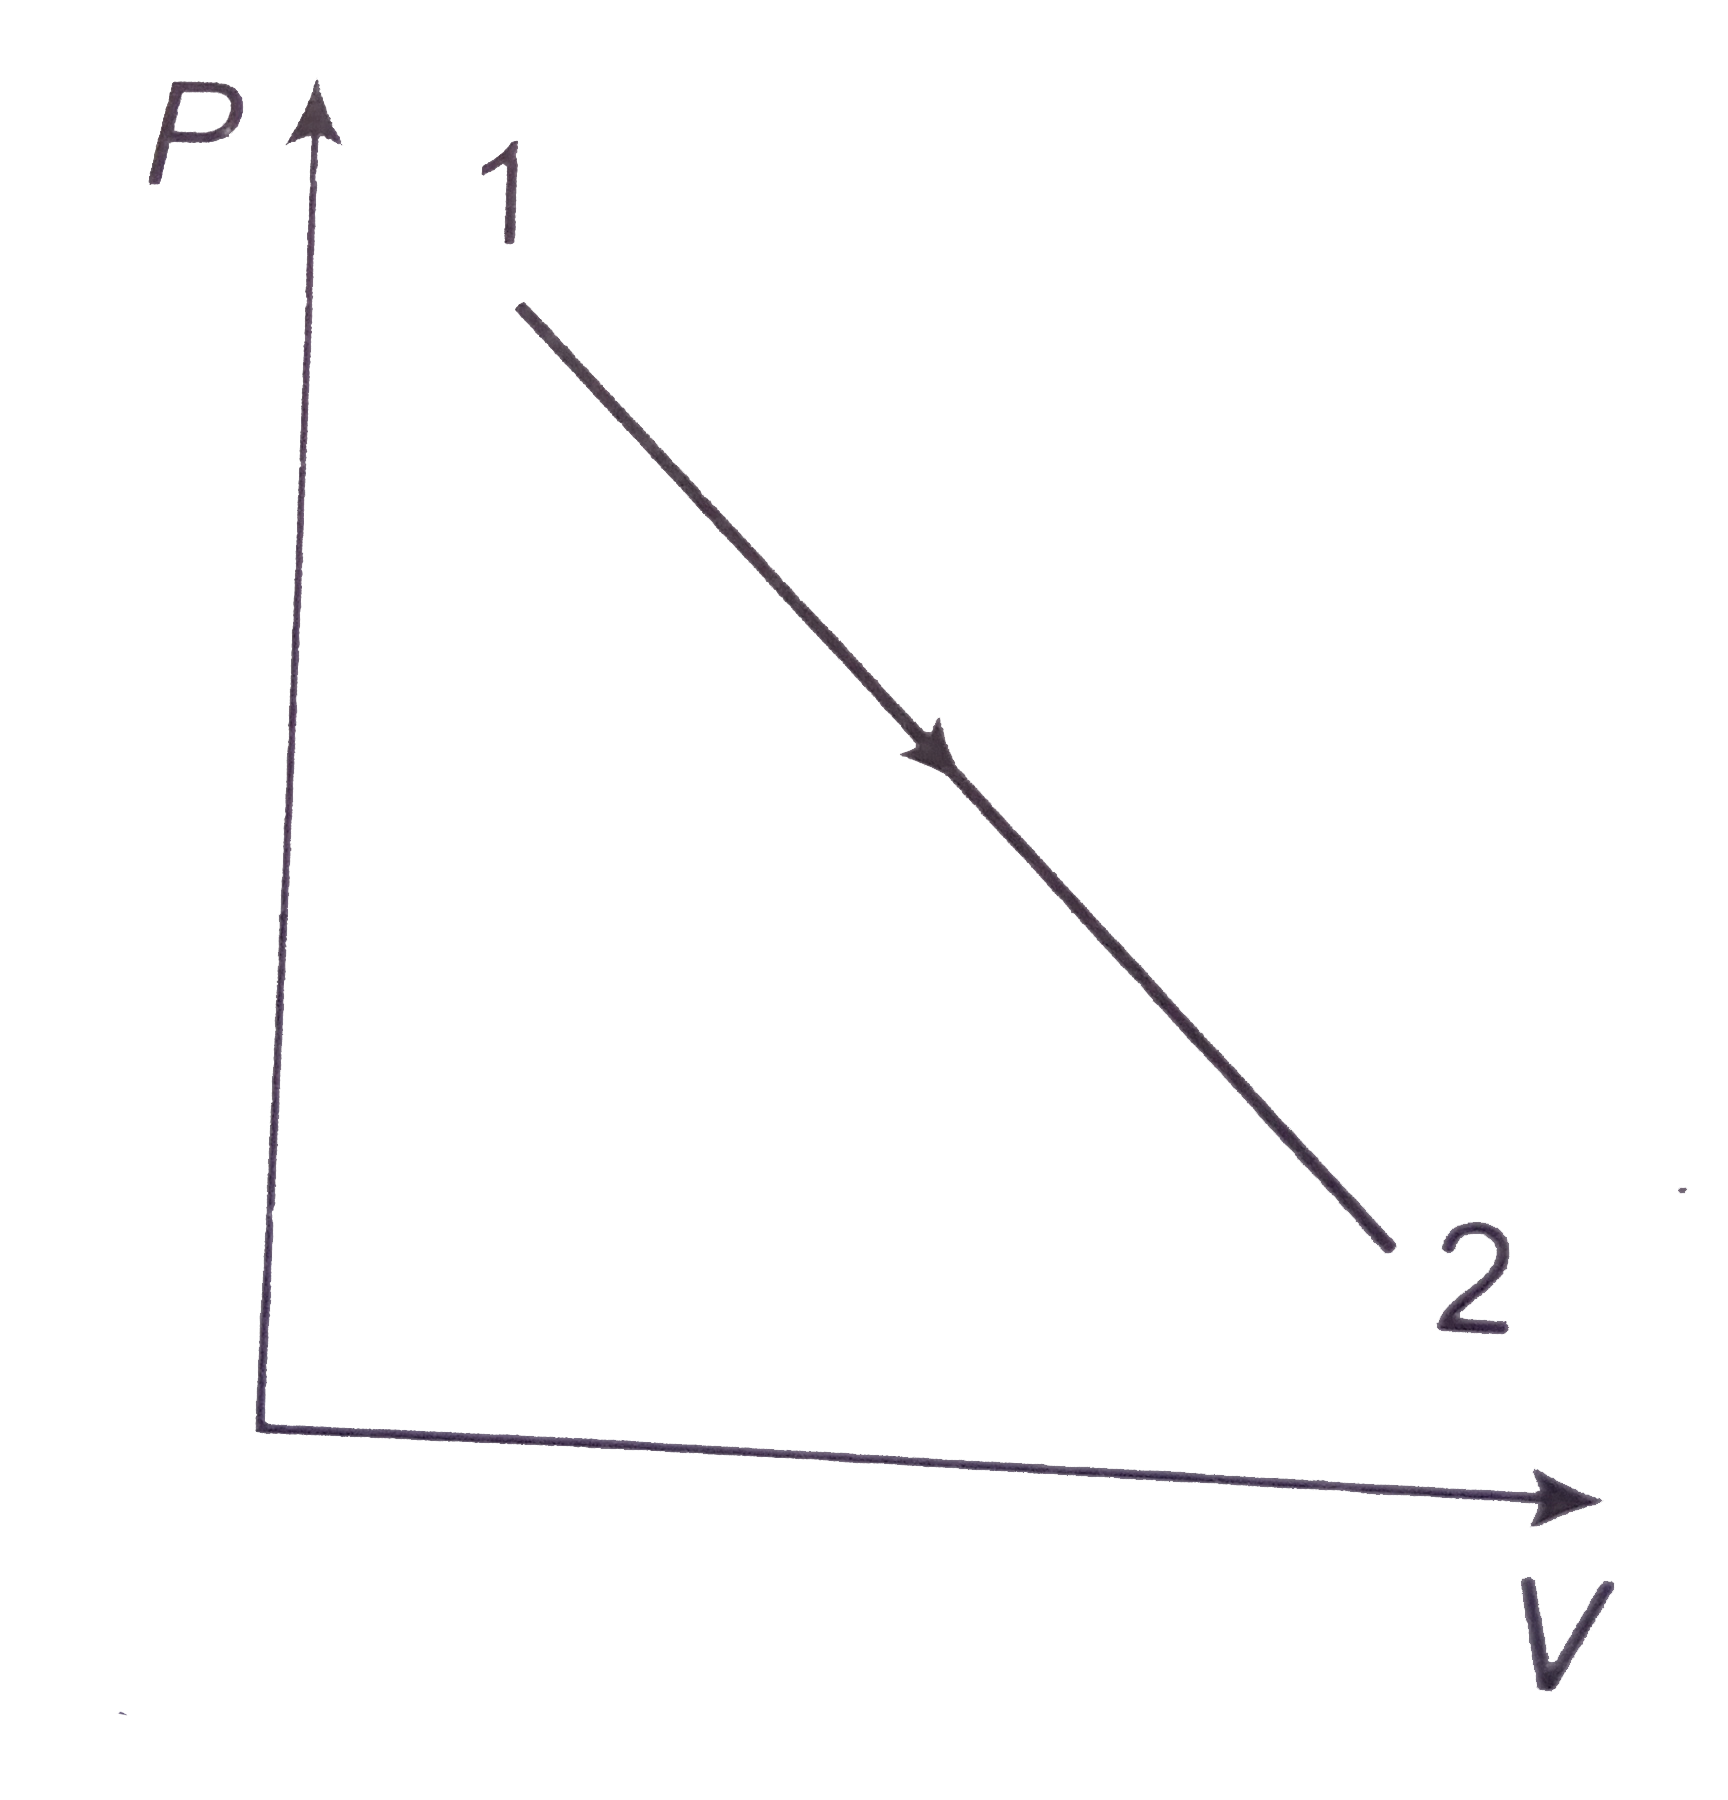
P−V graph was obtained from state 1 to state 2 when a given mass of a gas is subjected to temperature changes during the process the gas is
View SolutionIf heat energy is given to an ideal gas at constant pressure, then select the graph which best represents the variation of VT with temperature (T).
View Solution

