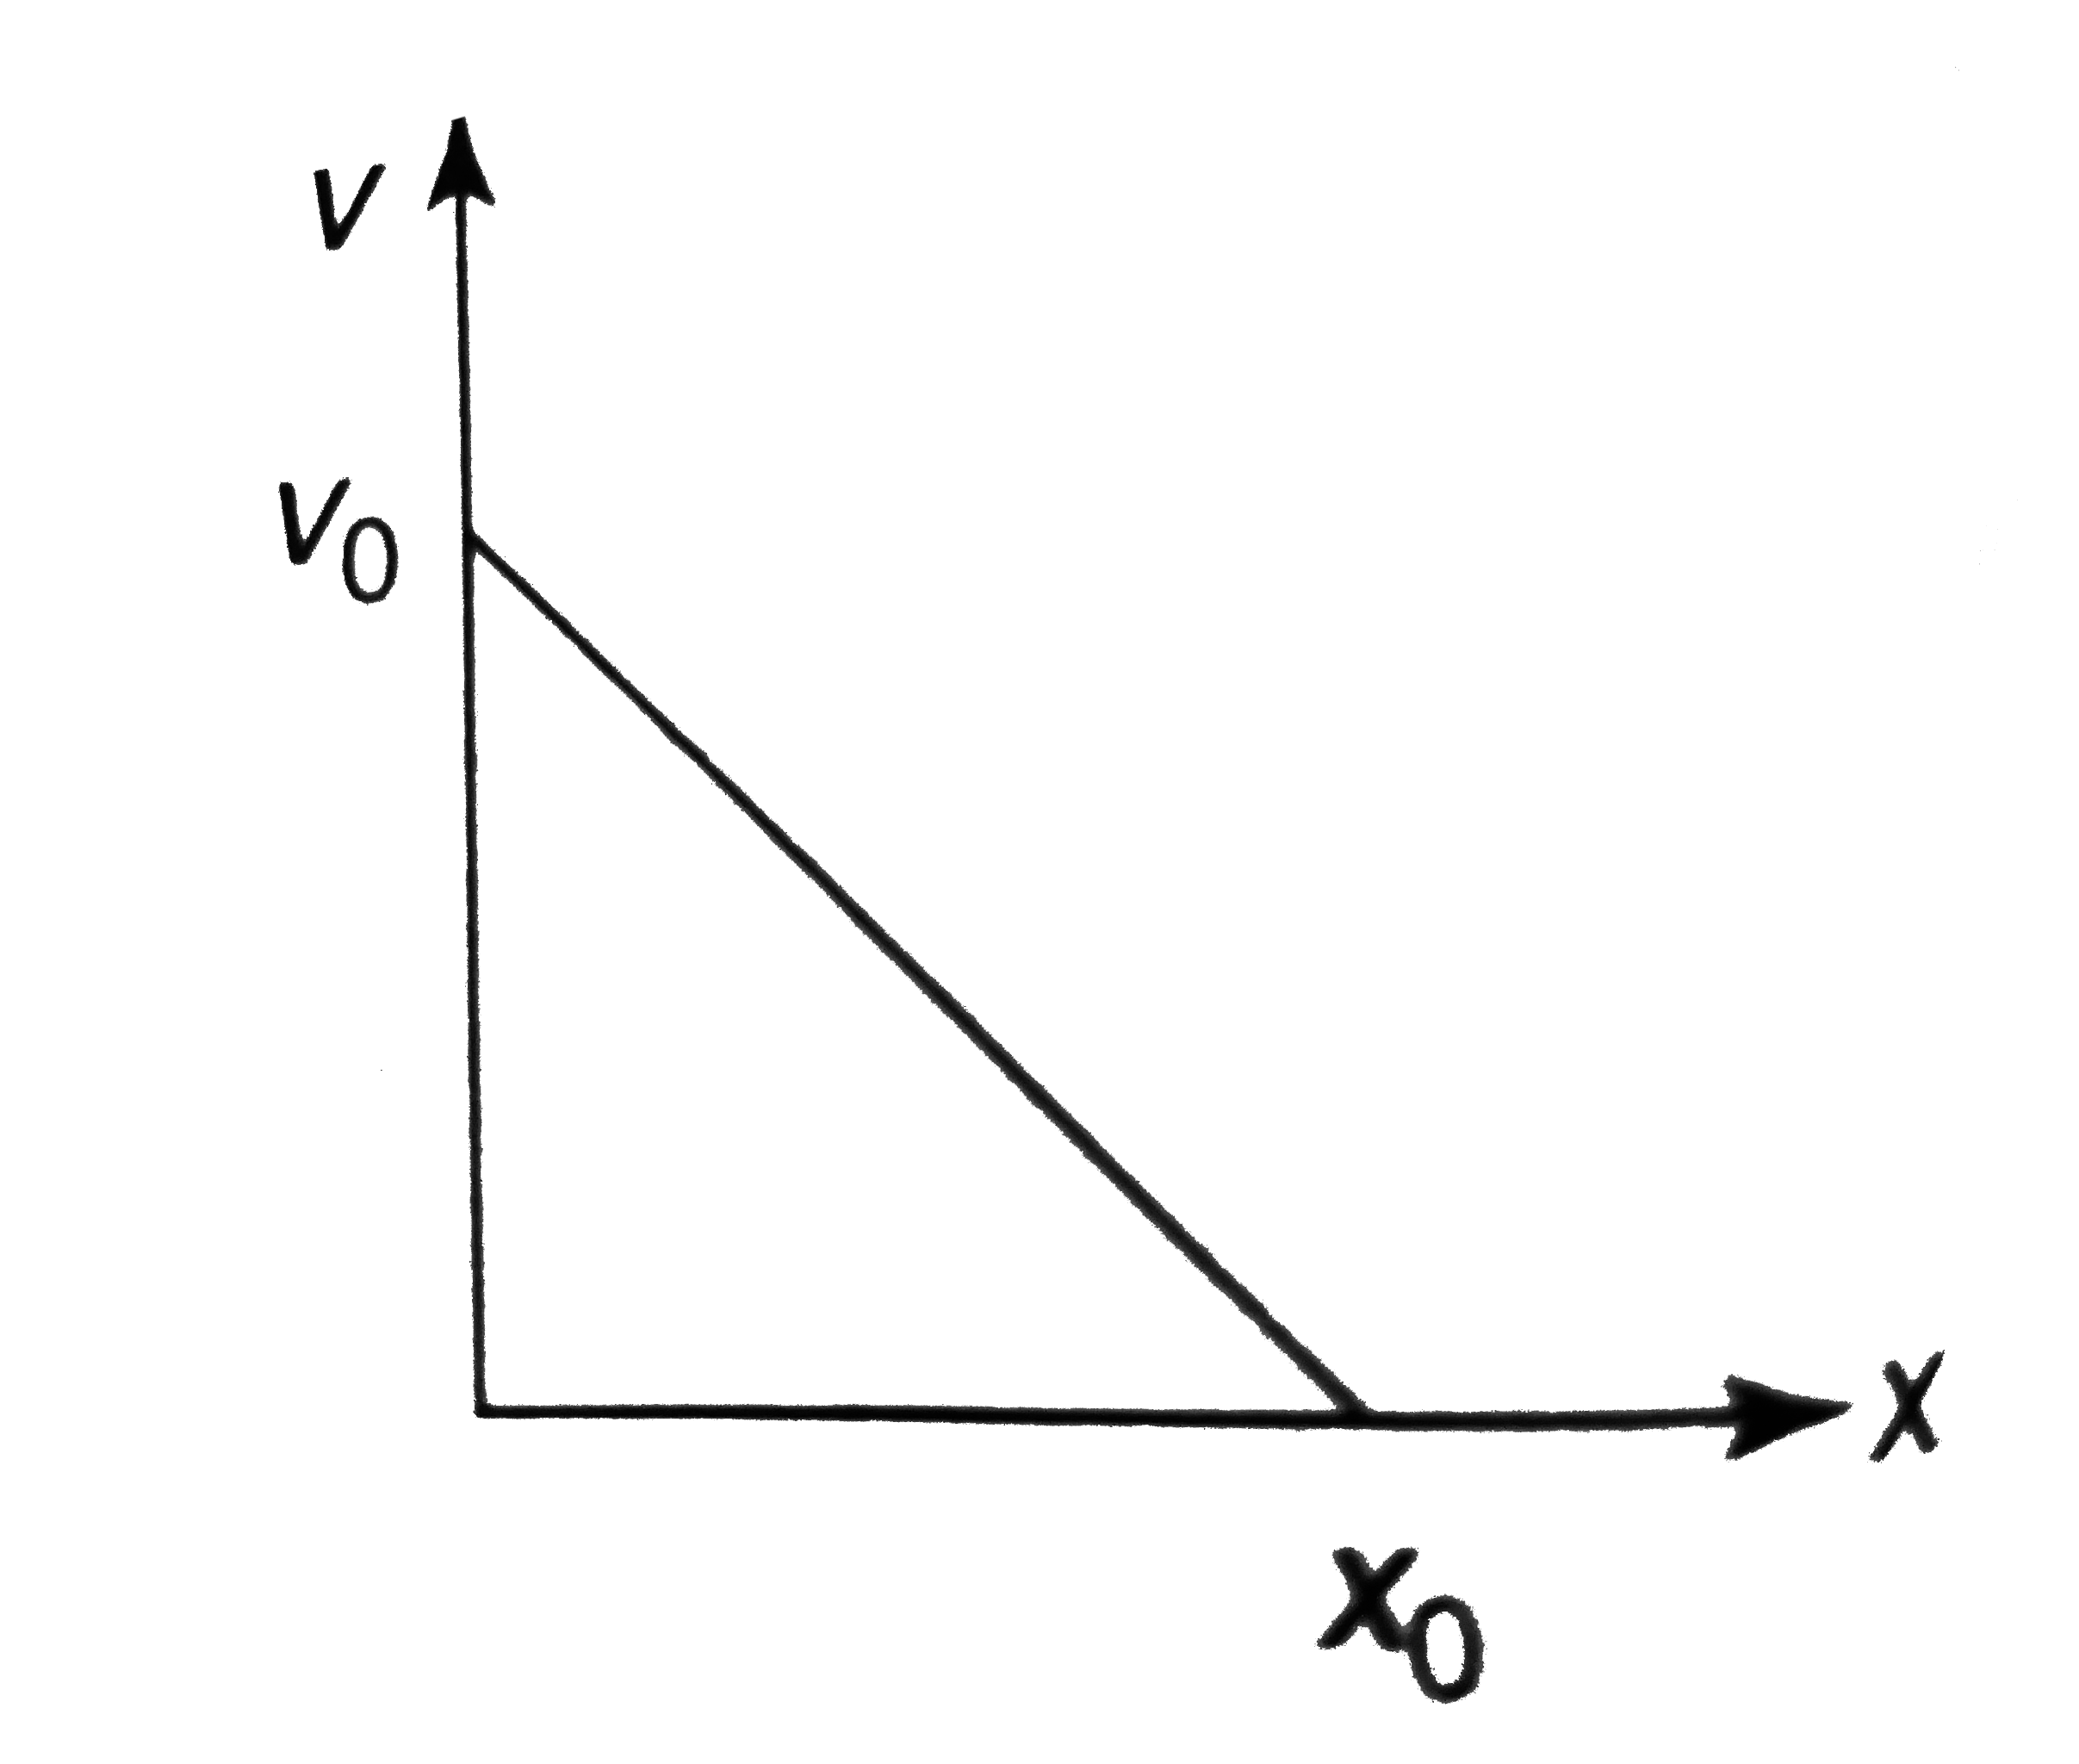
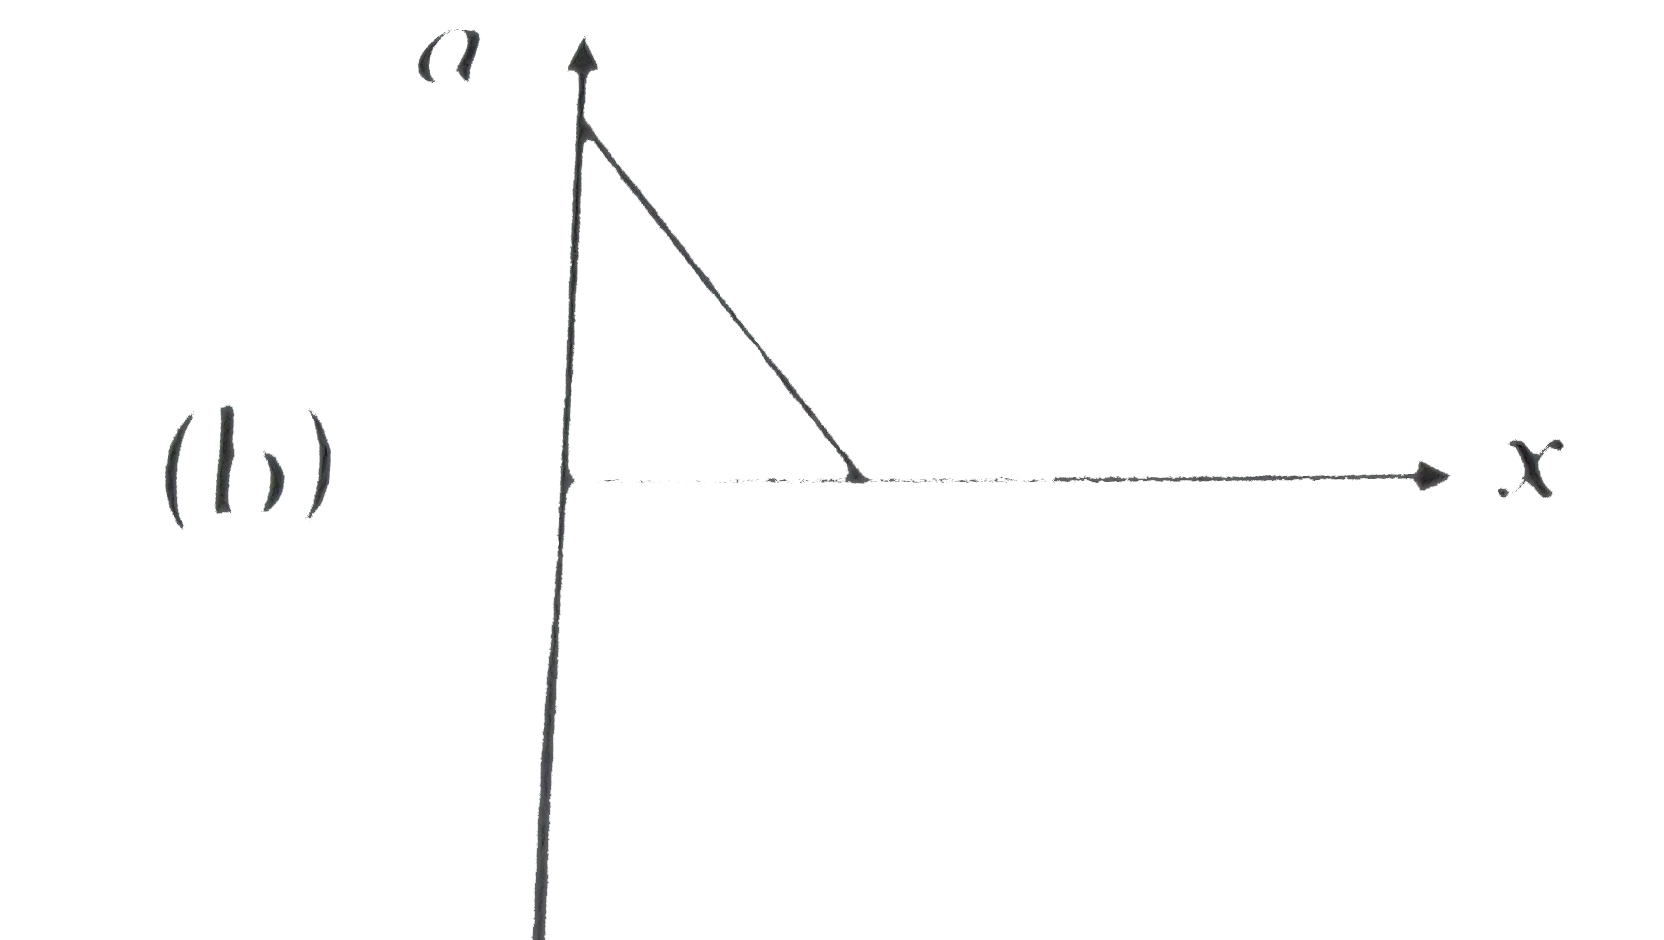
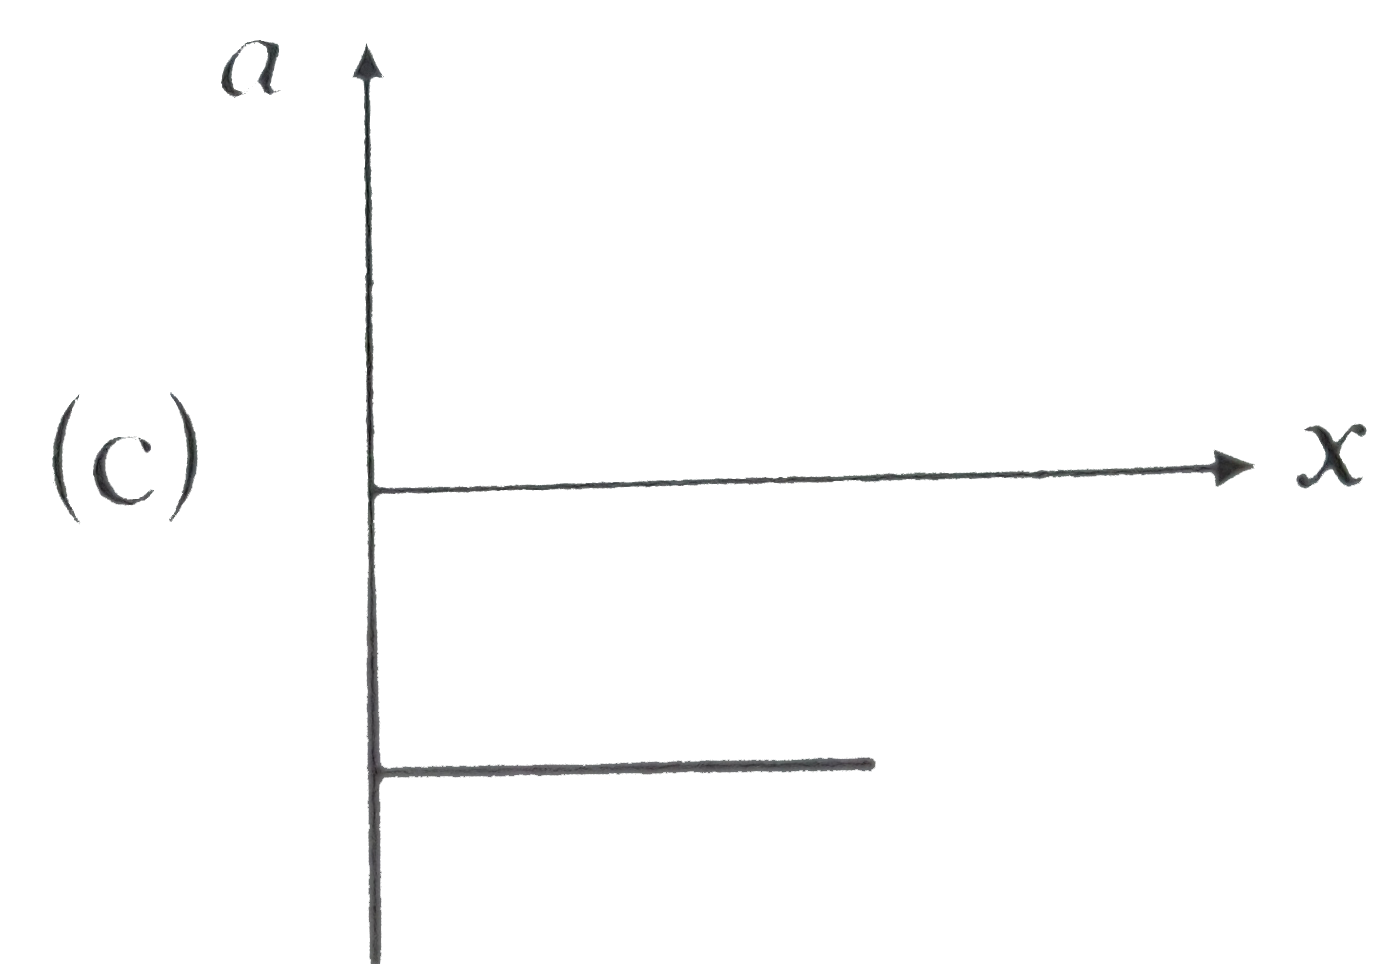
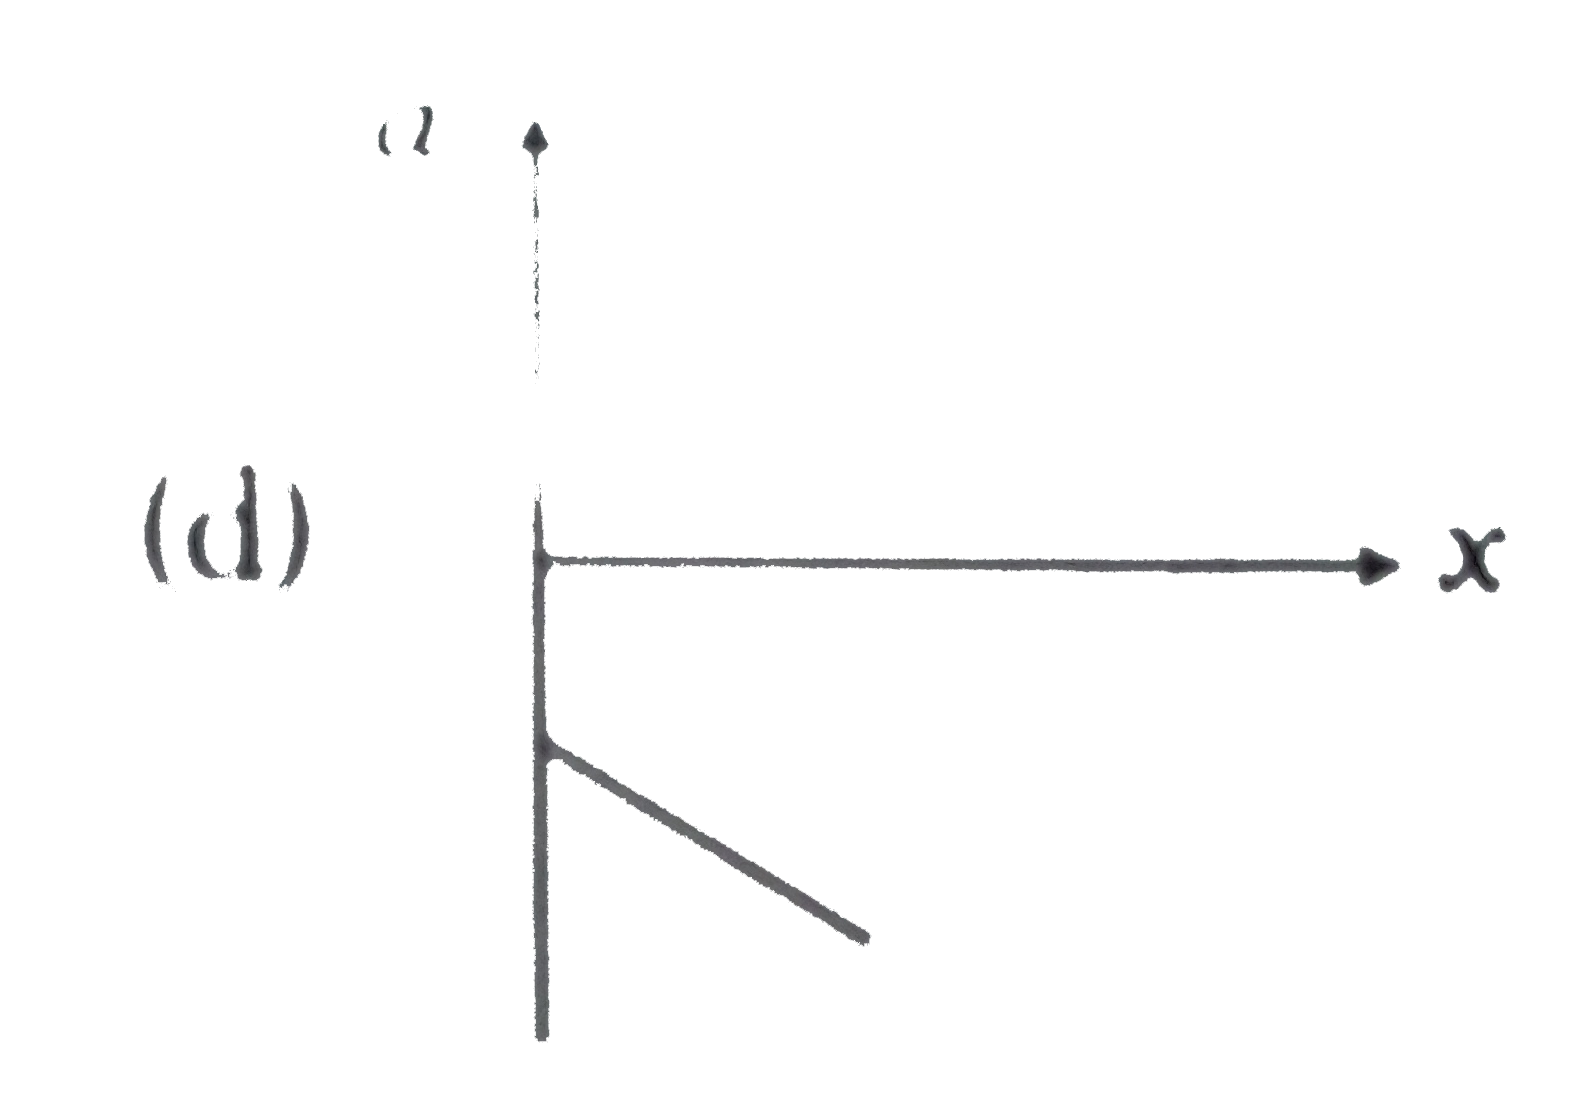
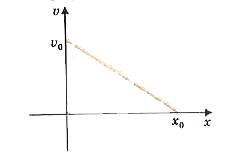
The given graph shows the variation of velocity with displacement. Which one of the graphs given below correctly represents the variation of acceleration with displacement ?
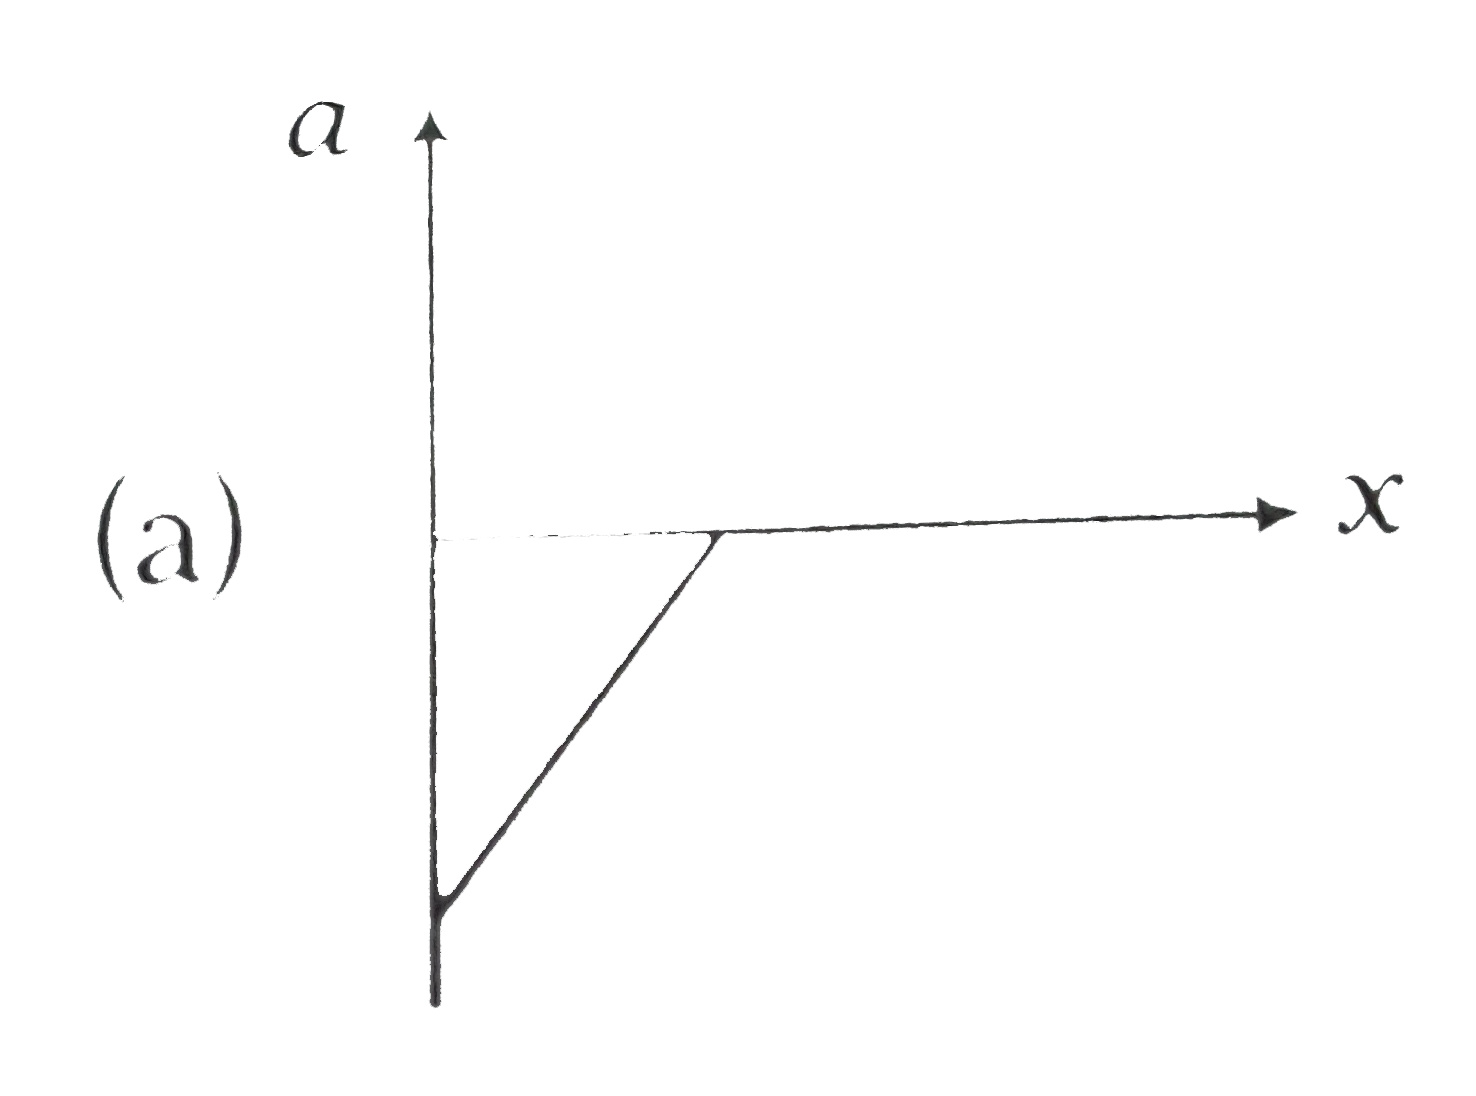
A
B
C
D
Video Solution
Text Solution
The correct Answer is:A
Given line has positive intercet but negative slopr. So its equation can be written as
υ=−mx+υ0[where ,m=tanθ=υ0x0] ….(i)
By differentiating with respect to time, we get
dυdt=−mdxdt=−mυ
Now substituting the value of υ from Eq. (i), we get
dυdt=−m[−mx+υ0]=m2x−mυ0
∴a=m2x−mυ0
i.e., the graph between a and x should have positive slope but negsative intercept on a-axis. So, graph (a) is correct.
|
Topper's Solved these Questions
- MOTION IN A PLANEBOOK - DC PANDEYCHAPTER - MOTION IN A PLANEEXERCISE - (B) Meical entrance special format questions (Assertion and reason)
19 Videos
- MOTION IN A PLANEBOOK - DC PANDEYCHAPTER - MOTION IN A PLANEEXERCISE - (B) Meical entrance special format questions (Mathch the columns)
6 Videos
- MOTION IN A PLANEBOOK - DC PANDEYCHAPTER - MOTION IN A PLANEEXERCISE - Check point 3.7
15 Videos
- MOTIONBOOK - DC PANDEYCHAPTER - MOTIONEXERCISE - Medical entrances gallery
19 Videos
- PROJECTILE MOTIONBOOK - DC PANDEYCHAPTER - PROJECTILE MOTIONEXERCISE - Level - 2 Subjective
10 Videos
Similar Questions
Knowledge Check
Which of the following graphs best represents the variation of acceleration 'a' with displacement x?
A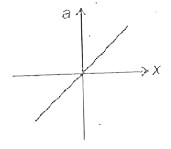 B
B C
C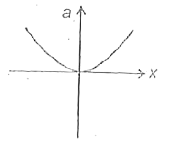 D
D
The velocity -displacement graph of a particle is as shown in the figure. Which of the following graphs correctly represents the variation of acceleration with displacement?
 A
A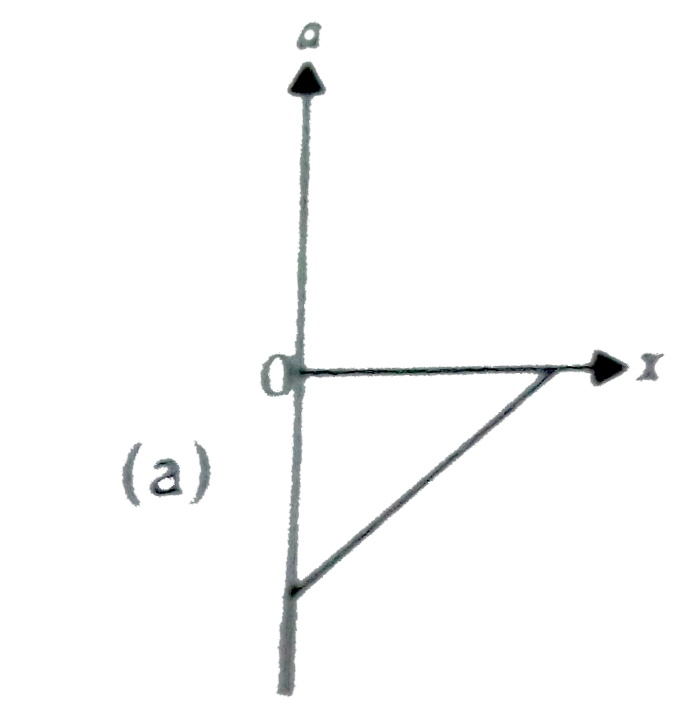 B
B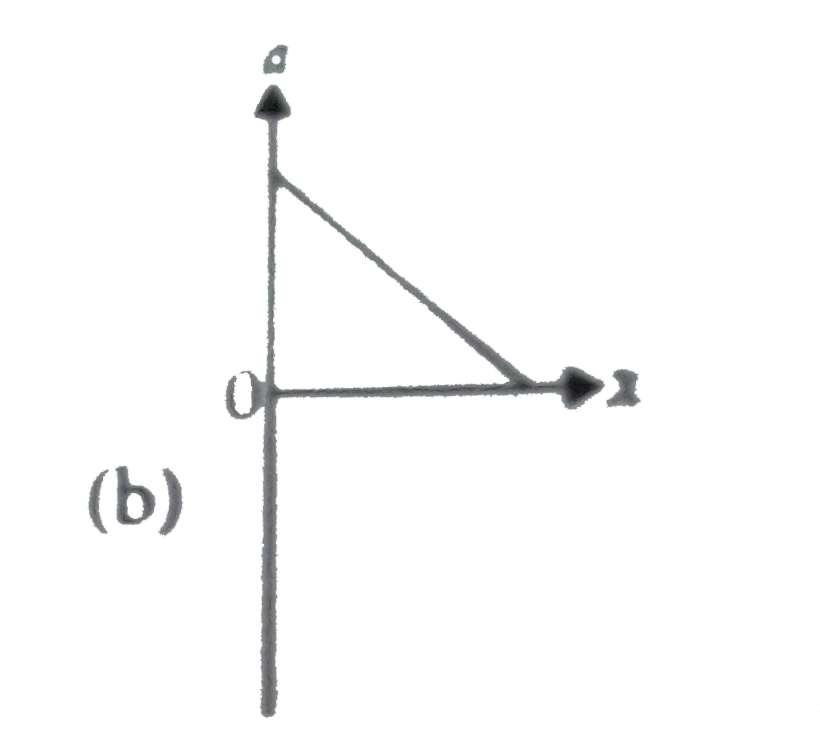 C
C D
D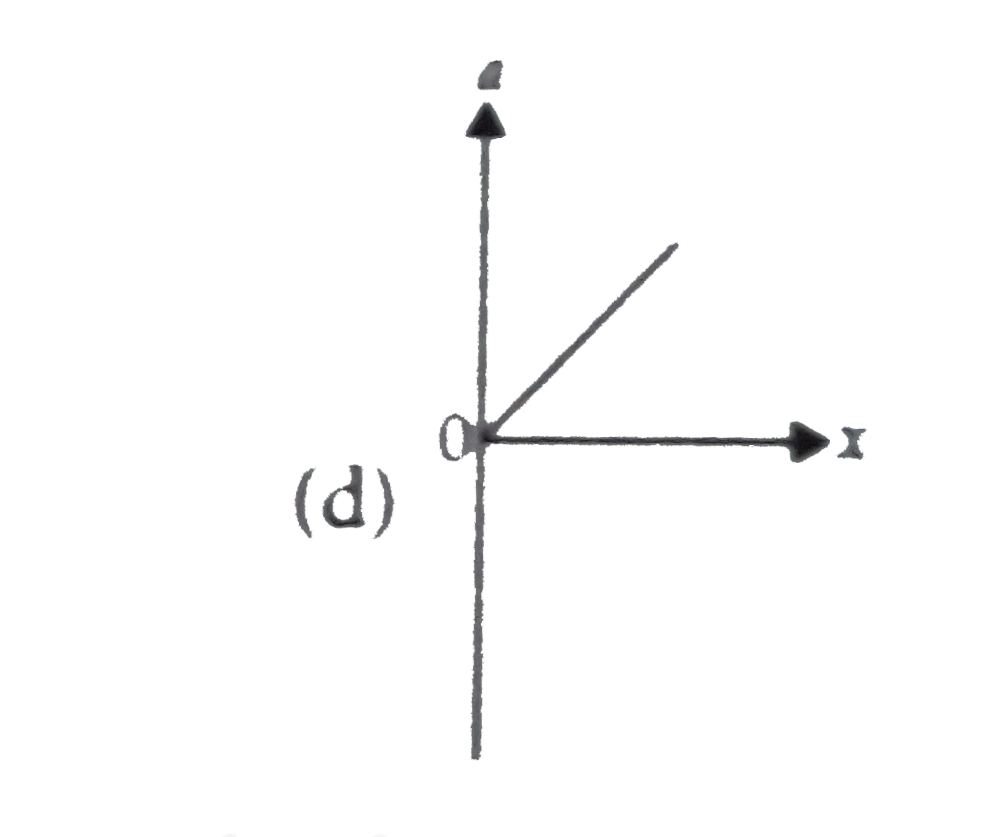
The graph shown the variation with times t of the velocity v of an object . Which one of the following graphs best represents the variation of acceleration a of the object with time t?
 A
A B
B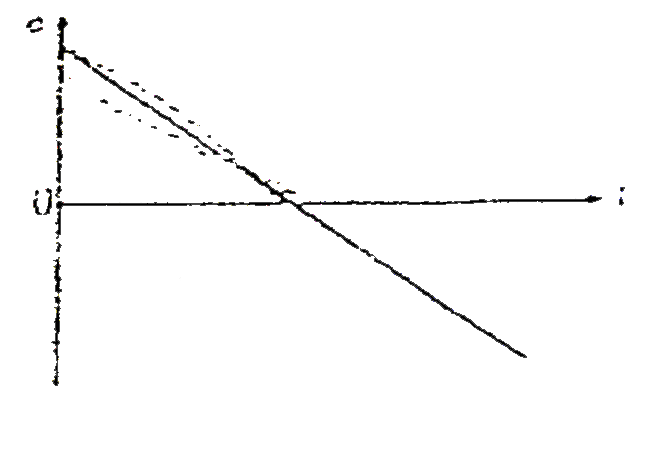 C
C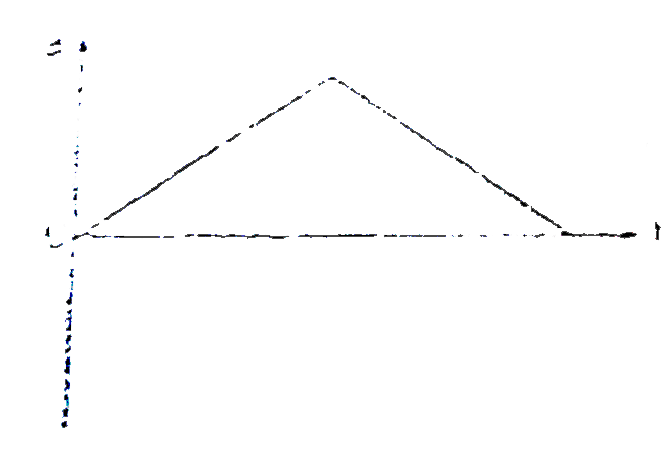 D
D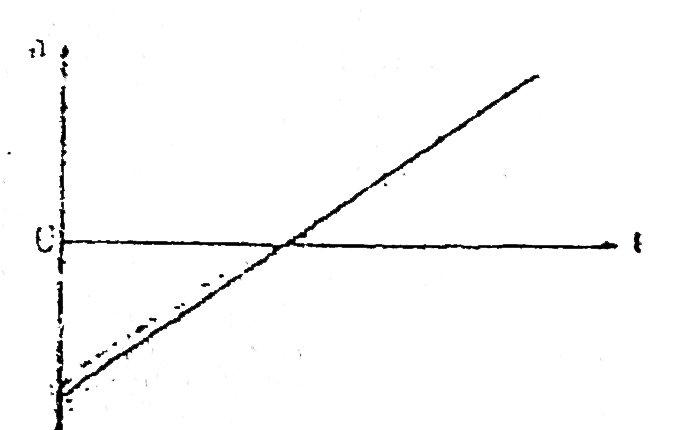
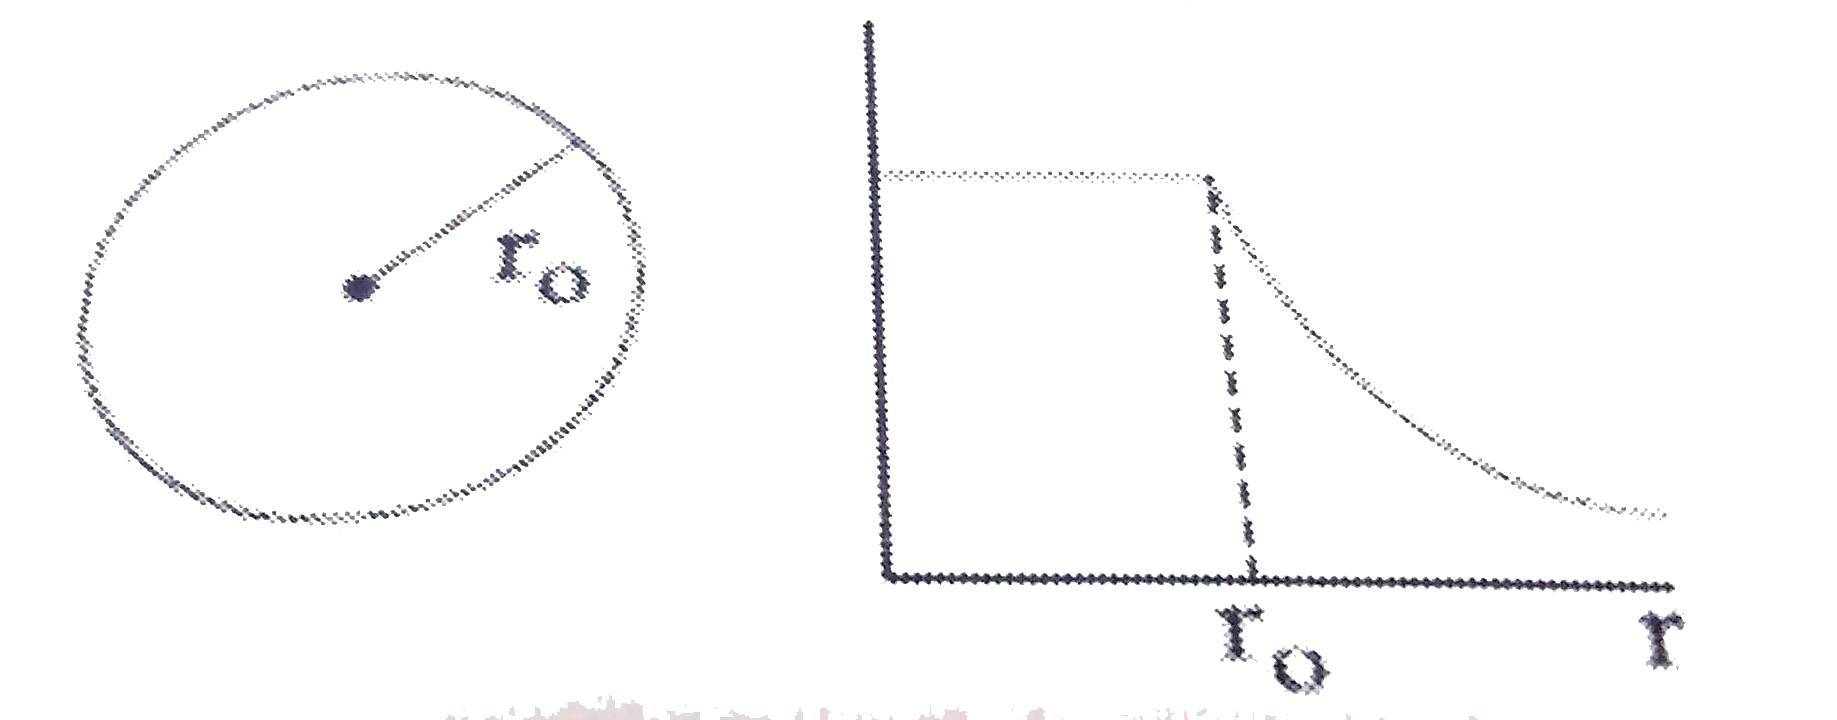
The given graph shows variation (with distance r form center) of :
View Solution
The displacement (x)-time (t) graph given above approximately represents the motion of a
View SolutionWhich of following graphs correctly represents the variation of particle momentum with de-Broglie wavelength?
View SolutionGraph between velocity and displacement is shown in the following figure:
Which of the following graphes represents the correct variation of acceleration with displacement
View SolutionWhich of the following graphs correctly represents the variation of particle momentum with associated de Broglie wavelength?
View Solution

