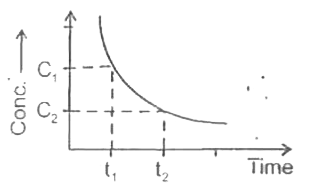
The graph between the instantaneous concentration (N) of a radioactive element and time (t) is.


The correct Answer is:D
By using N=Ne−λt
It shows that N decreases exponentially with time.
Topper's Solved these Questions
- NUCLEIBOOK - DC PANDEYCHAPTER - NUCLEIEXERCISE - B Medical entrance special format questions
9 Videos
- NUCLEIBOOK - DC PANDEYCHAPTER - NUCLEIEXERCISE - MATCH THE COLUMNS
4 Videos
- NUCLEIBOOK - DC PANDEYCHAPTER - NUCLEIEXERCISE - CHECK POINT 13.3
15 Videos
- MODERN PHYSICS - 2BOOK - DC PANDEYCHAPTER - MODERN PHYSICS - 2EXERCISE - Level 2 Subjective
10 Videos
- RAY OPTICSBOOK - DC PANDEYCHAPTER - RAY OPTICSEXERCISE - Medical entrance gallary
76 Videos
Similar Questions
Knowledge Check
The graph between number of decayed atoms N' of a radioactive element and time t is.
A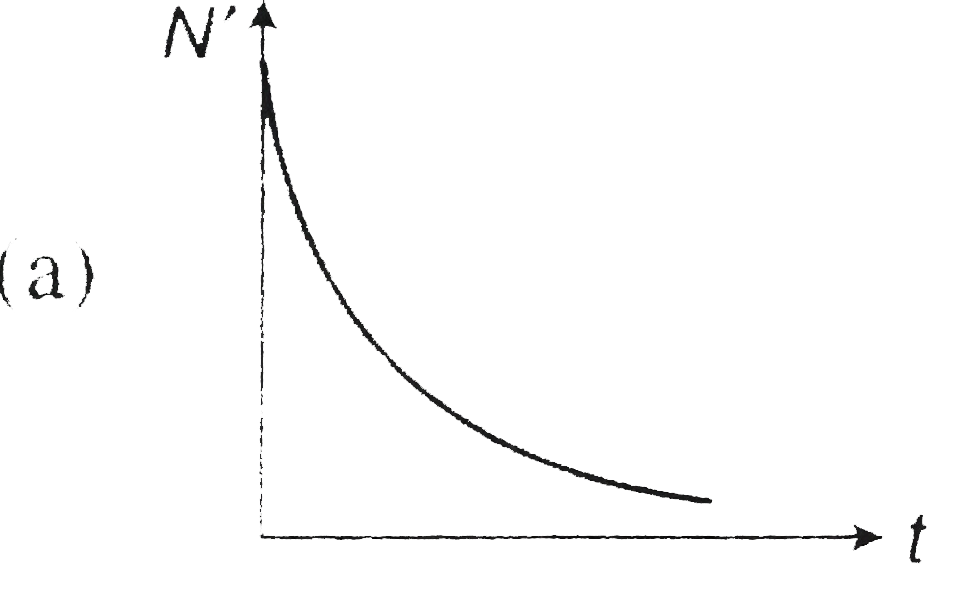 .B
.B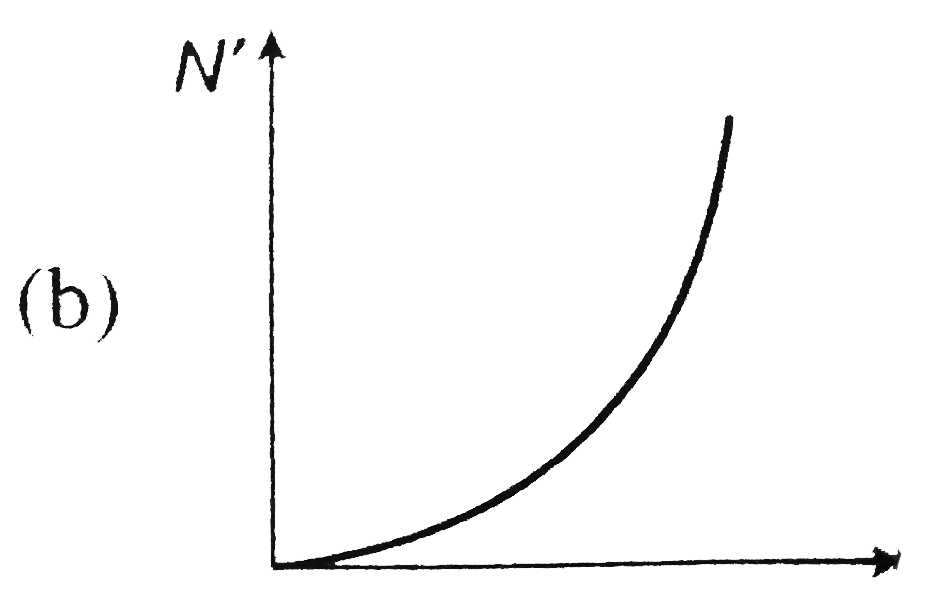 .C
.C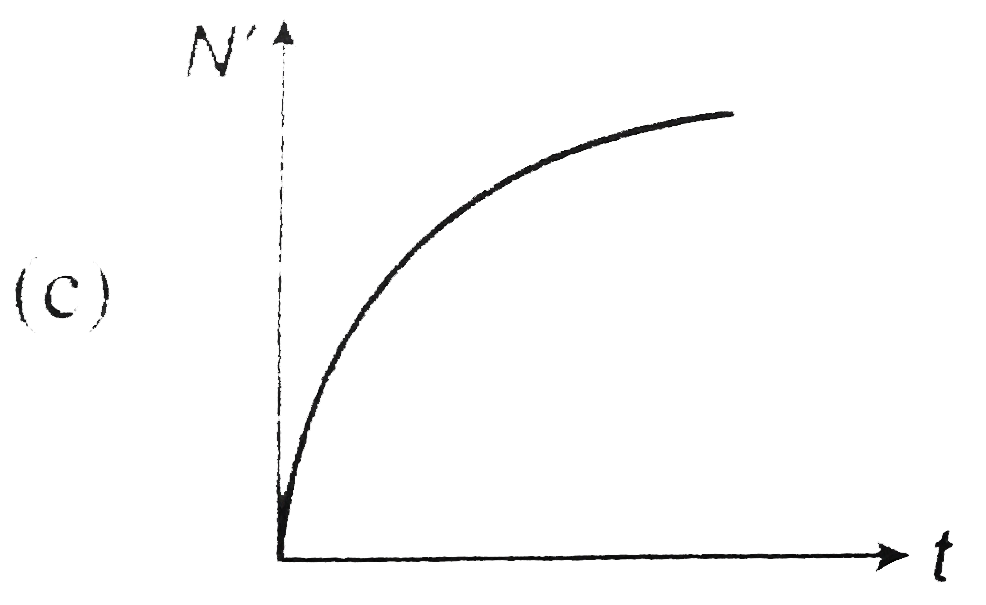 .D
.D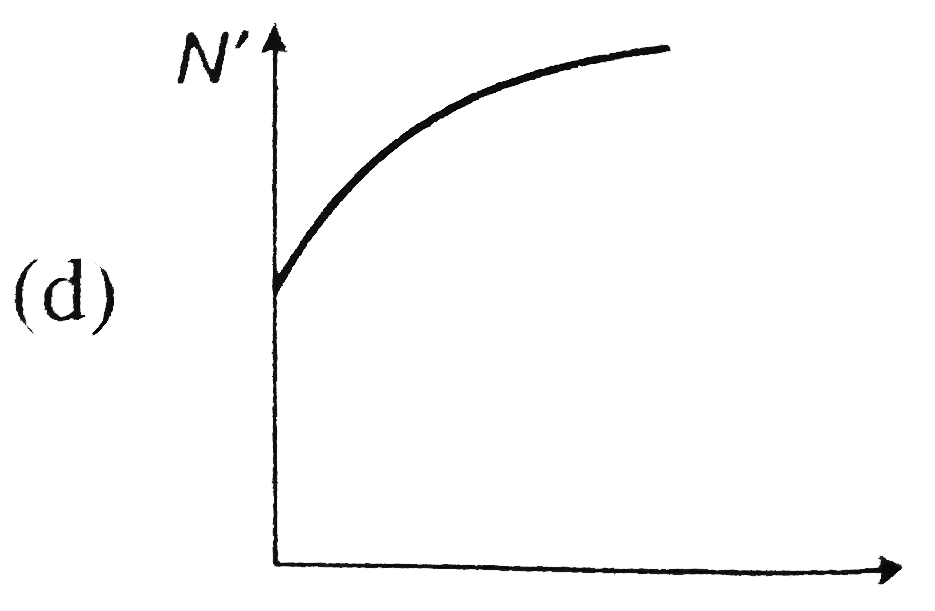 .
.99% of a radioactive element will decay between
A6 and 7 half-livesB7 and 8 half-livesC8 and 9 half-livesD9 half-livesThe graph between instantaneous velocity and acceleration of a particle performing S.H.M. is
AparabolaBstraight lineCellipseDcircle
The graph between remaining radioactive atoms and time for a radioactive decay is
View SolutionThe graph between concentration (X) of the Product and time of the reaction A→B is of the type 1. Hence, graph between −d[A]dt and time will be of the type:
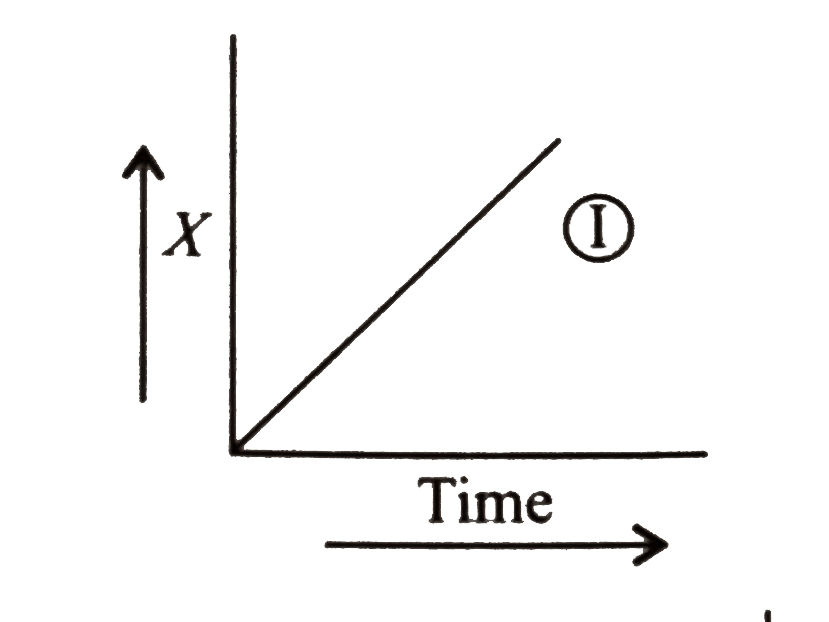
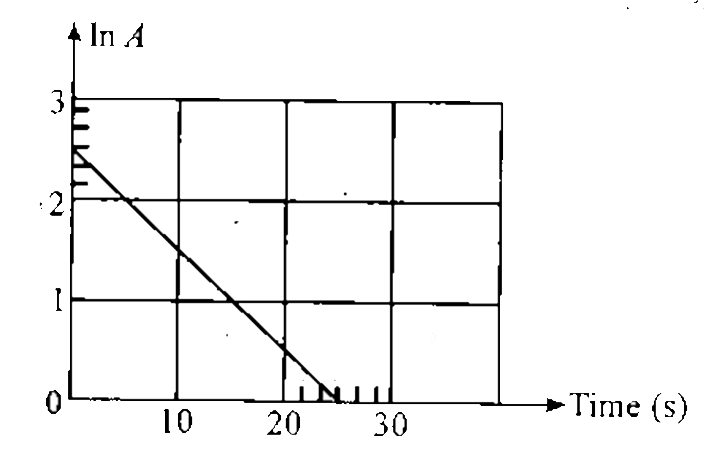
View SolutionThe graph shows how the count-rate A of a radioactive source varies with time t. A and t are related as: (assume in (12)=2.5)
View SolutionFor the reactionA→B, for which graph between half life (t1/2)and∈itialconcentration(a)oftherectantisgivenbelow<br><imga≤ocr_imageload∈g=lazysrc=https://d10lpgp6xz60nq.cloudfront.net/physics_images/NRA_PHY_CHM_JMA_C07_E01_022_Q01.pngwh=80%mx-autosty≤=background:white;><br>Hencegraphbetween-(d[A])/(dt) and time will be:
View SolutionA radioactive sample decays to form a stable nuclide. A graph showing variation of rate of disintegration (dNdt) of radioactive sample with time (t) is
View Solution

