Figure shows the position -time graph of an object in SHM. The correct equation representing this motion is

2sin(2π5t+π6)
4sin(π5t+π6)
4sin(π6t+π3)
4sin(π6t+π6)
The correct Answer is:D
Step by step video, text & image solution for Figure shows the position -time graph of an object in SHM. The correct equation representing this motion is by Physics experts to help you in doubts & scoring excellent marks in Class 12 exams.
Updated on:21/07/2023Topper's Solved these Questions
- OSCILLATIONSBOOK - AAKASH INSTITUTECHAPTER - OSCILLATIONSEXERCISE - Assignment (Section C) (PREVIOUS YEARS QUESTIONS)
43 Videos
- OSCILLATIONSBOOK - AAKASH INSTITUTECHAPTER - OSCILLATIONSEXERCISE - Assignment (Section D) (ASSERTION-REASON TYPE QUESTIONS)
13 Videos
- OSCILLATIONSBOOK - AAKASH INSTITUTECHAPTER - OSCILLATIONSEXERCISE - Assignment (Section - A) (OBJECTIVE TYPE QUESTIONS)
60 Videos
- NUCLEIBOOK - AAKASH INSTITUTECHAPTER - NUCLEIEXERCISE - ASSIGNMENT (SECTION-D)
10 Videos
- PHYSICAL WORLDBOOK - AAKASH INSTITUTECHAPTER - PHYSICAL WORLDEXERCISE - ASSIGNMENT (Section-B)
5 Videos
Similar Questions
Knowledge Check
Figure shows position-time graph of two cars A and B.
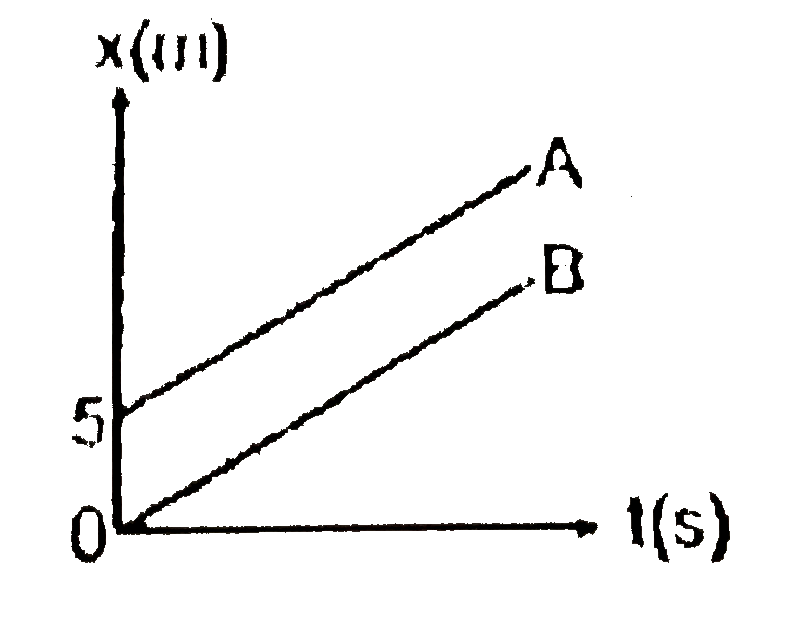 ACar A is faster than car B.BCar B is faster than car A.CBoth cars are moving with same velocity.DBoth cars have positive acceleration.
Figure shows a velocity-time graph. This shows that.
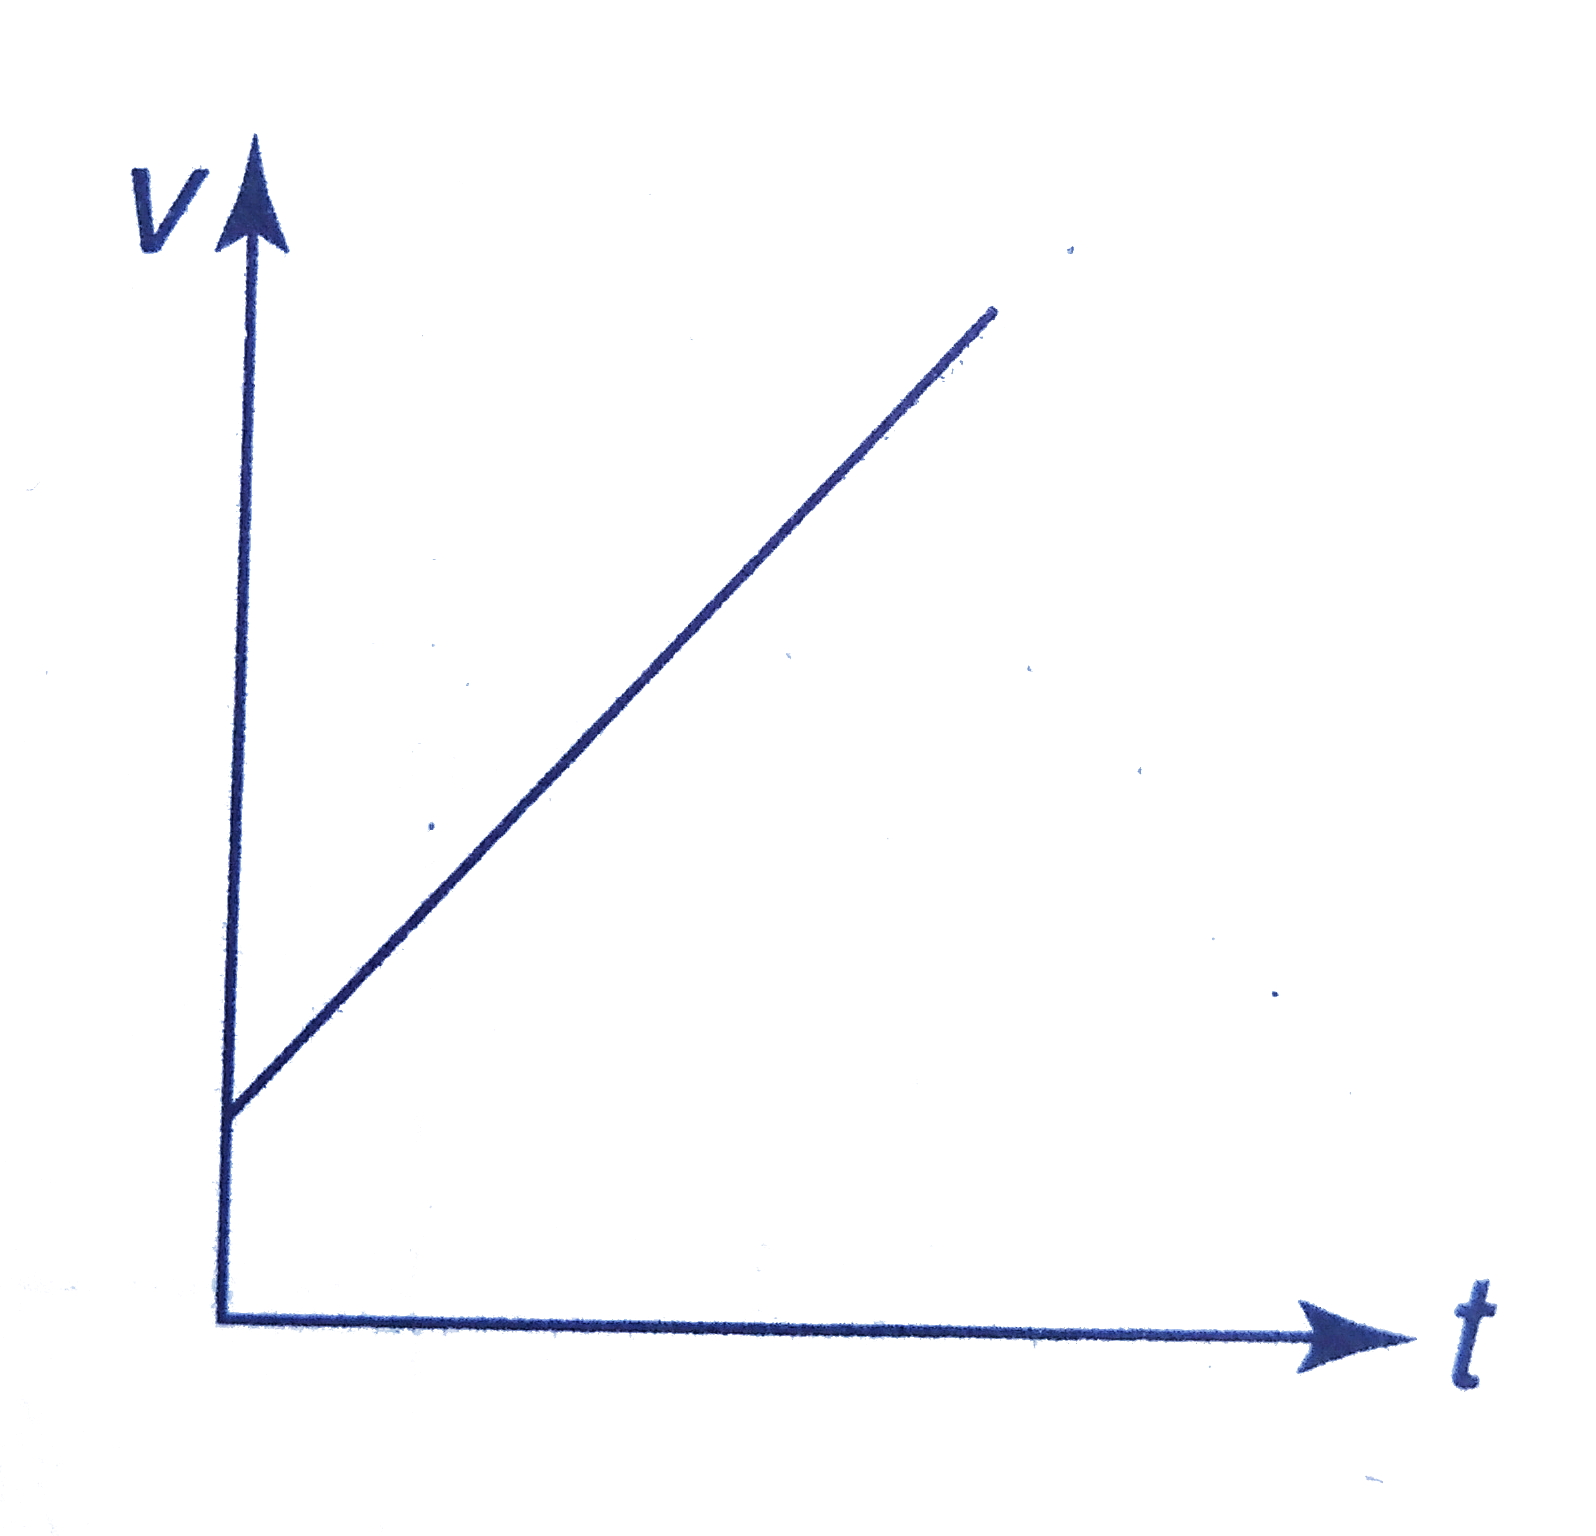 Athe body is at restBthe body starts from rest and moves with uniform velocityCthe body has some initial velocity and moves with uniform accelerationDthe motion is retarded
Figure shows the position time graph for a particle in one dimensional motion. What is the displacement of the particle in first 4 seconds ?
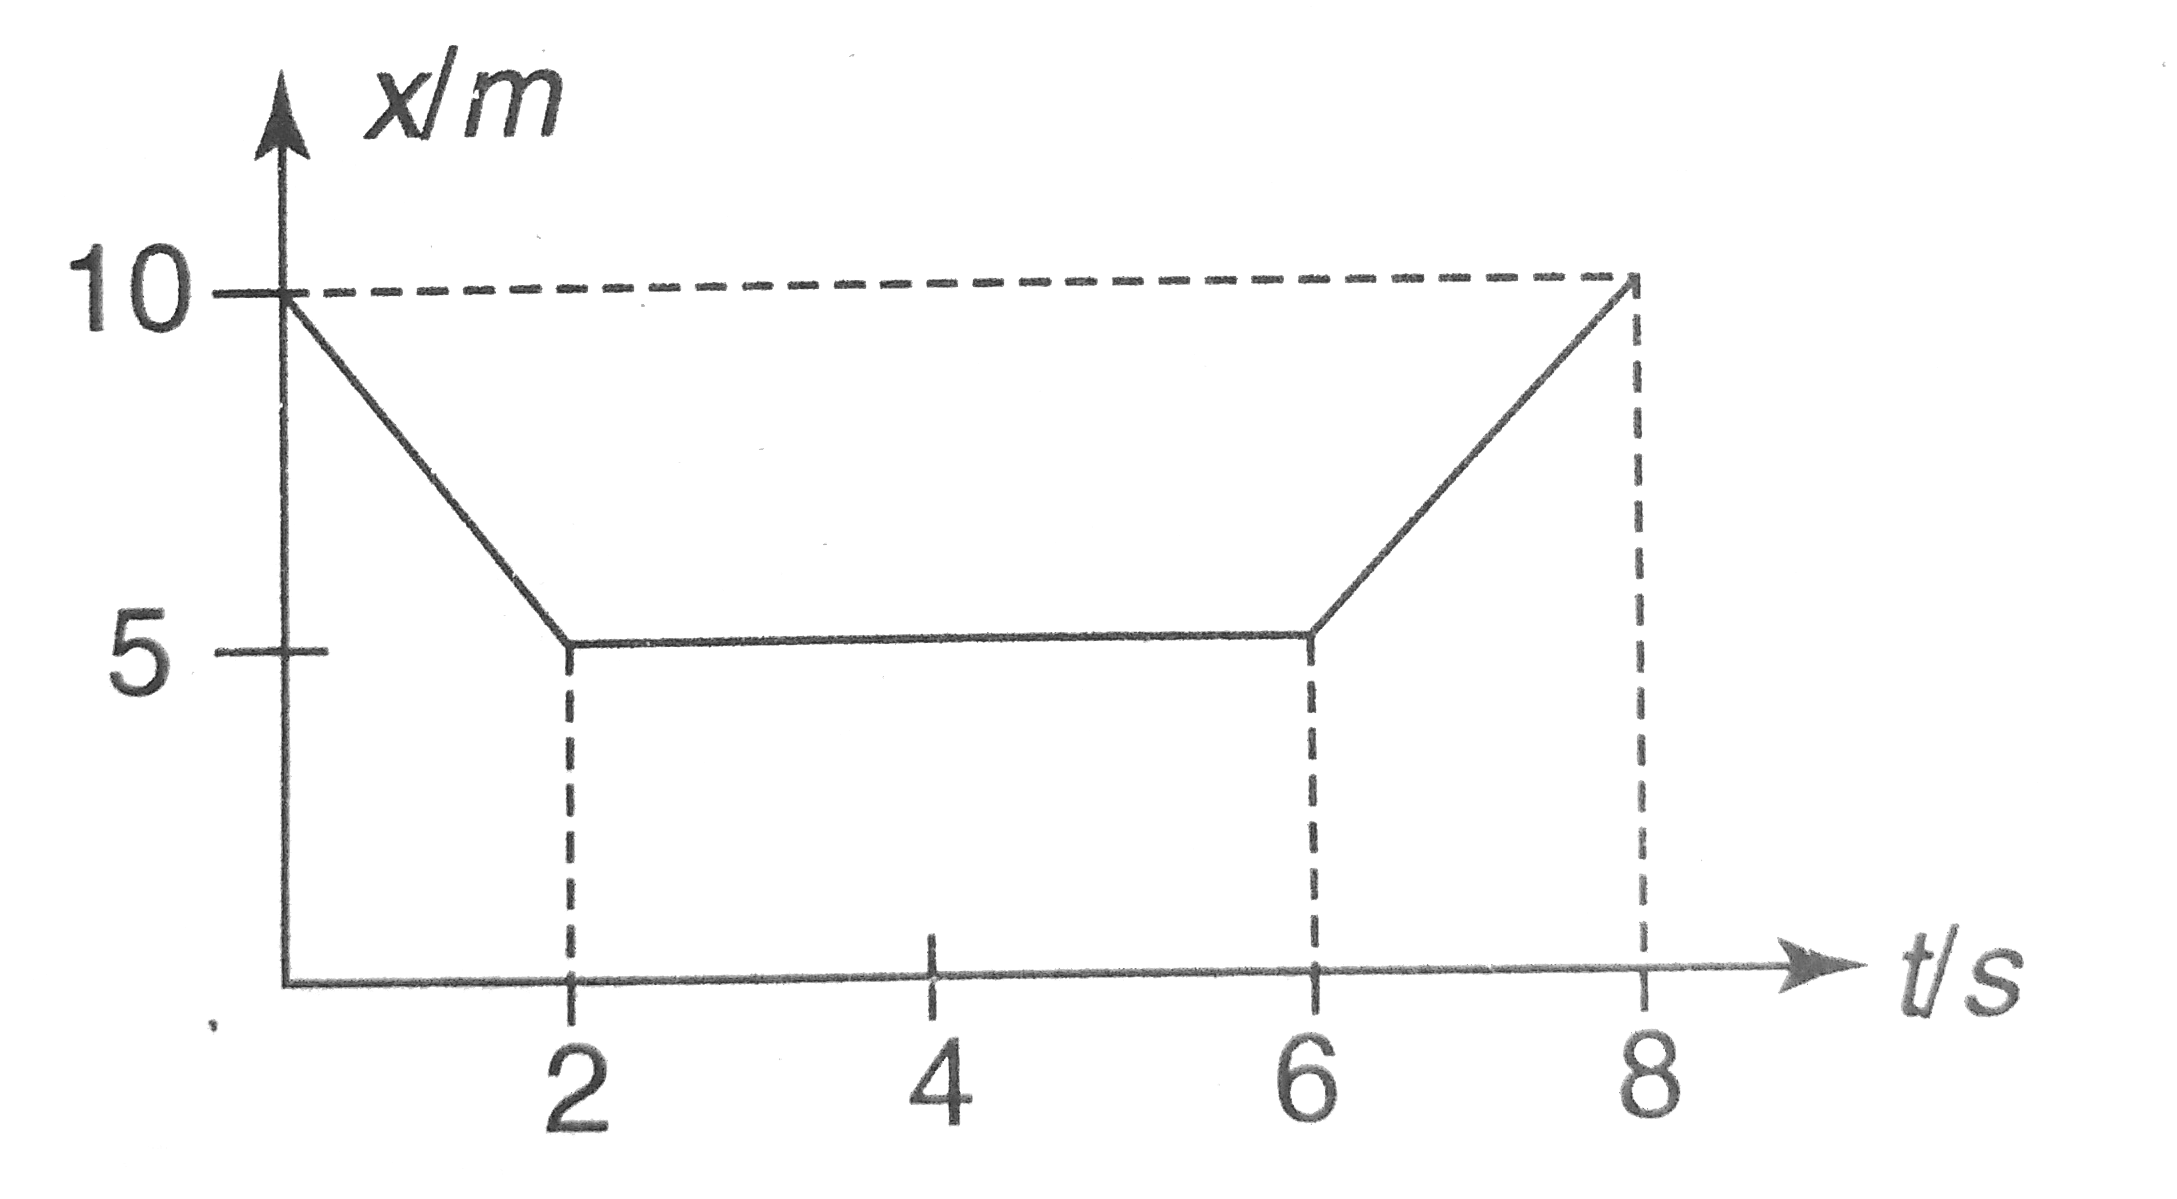 A5 mB−5mCzeroD15 m
Draw the position-time graph of an object moving with positive accceleration.
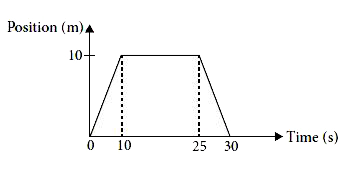
View SolutionThe given figure shows the position-time graph of an object. Find the ratio of the velocities at 5th and 27th second
View SolutionFigure is the distance - time graph of an object . Do you think it represents a real situation ? If so , why ? If not , why not?
View SolutionThe figure shows position time graph of two riders C and D. Based on the information represented by the graph, answer the following questions.
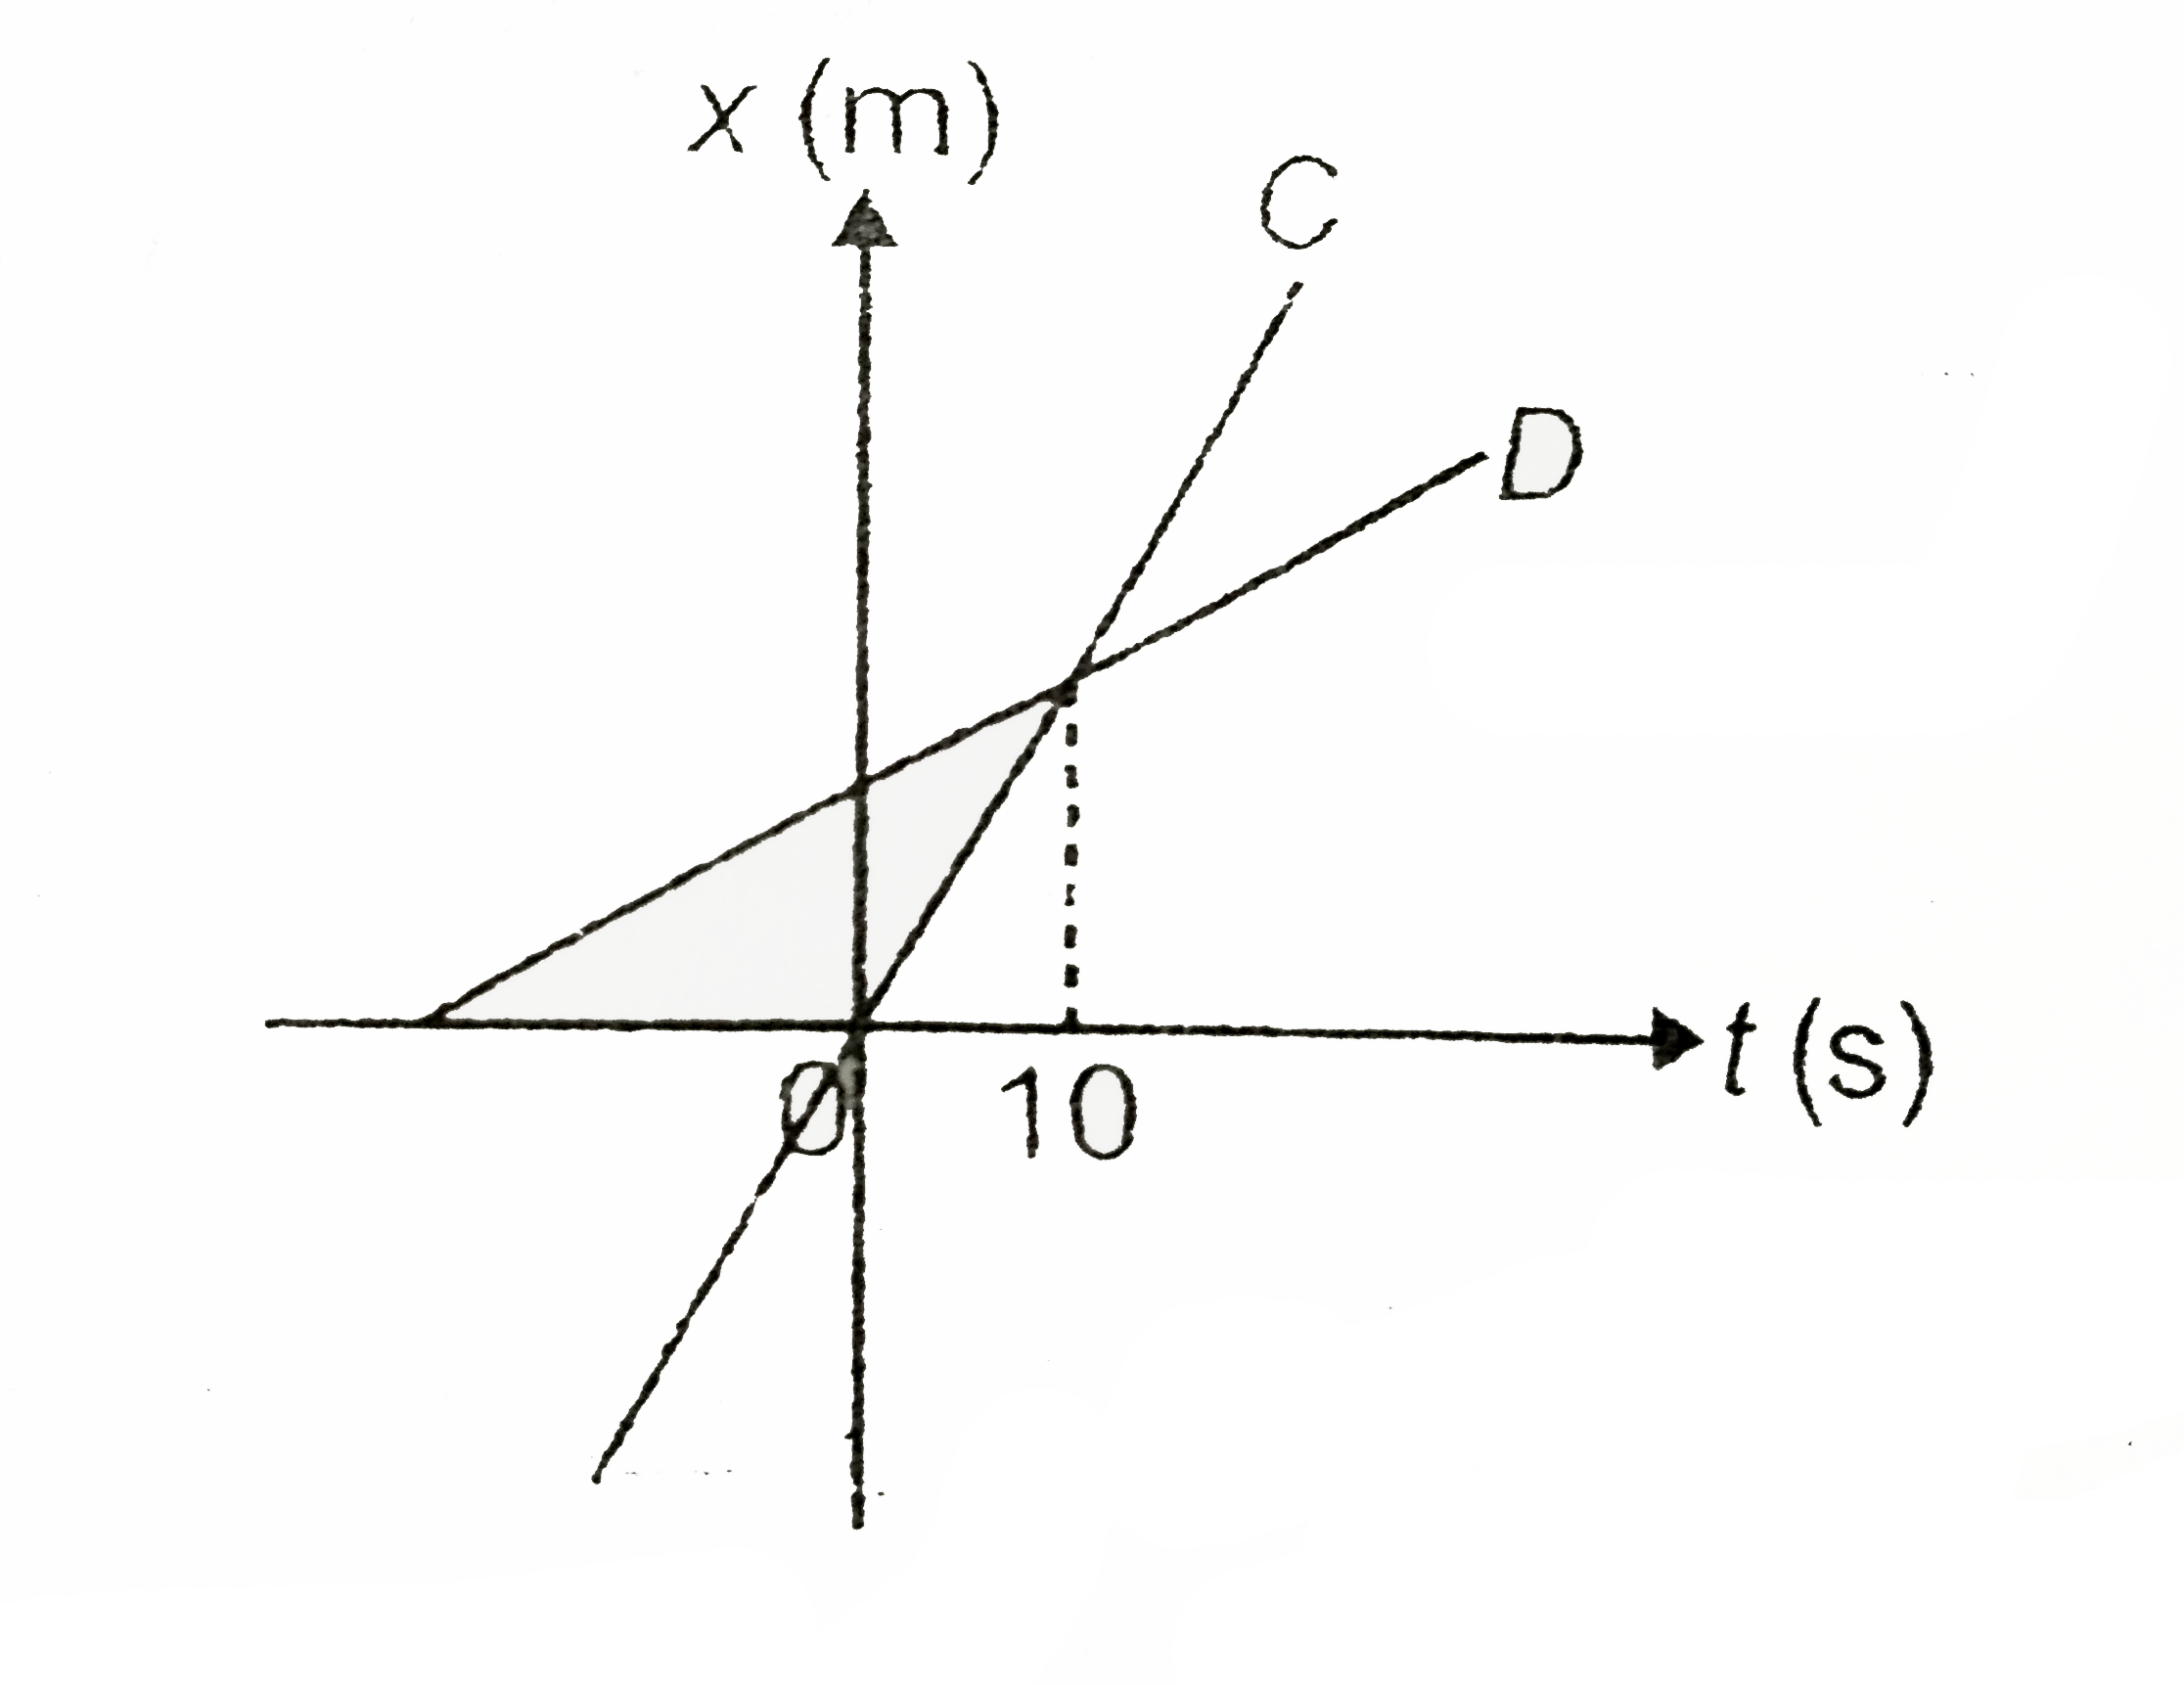
At t = 10 s
View SolutionThe figure shows position time graph of two riders C and D. Based on the information represented by the graph, answer the following questions.
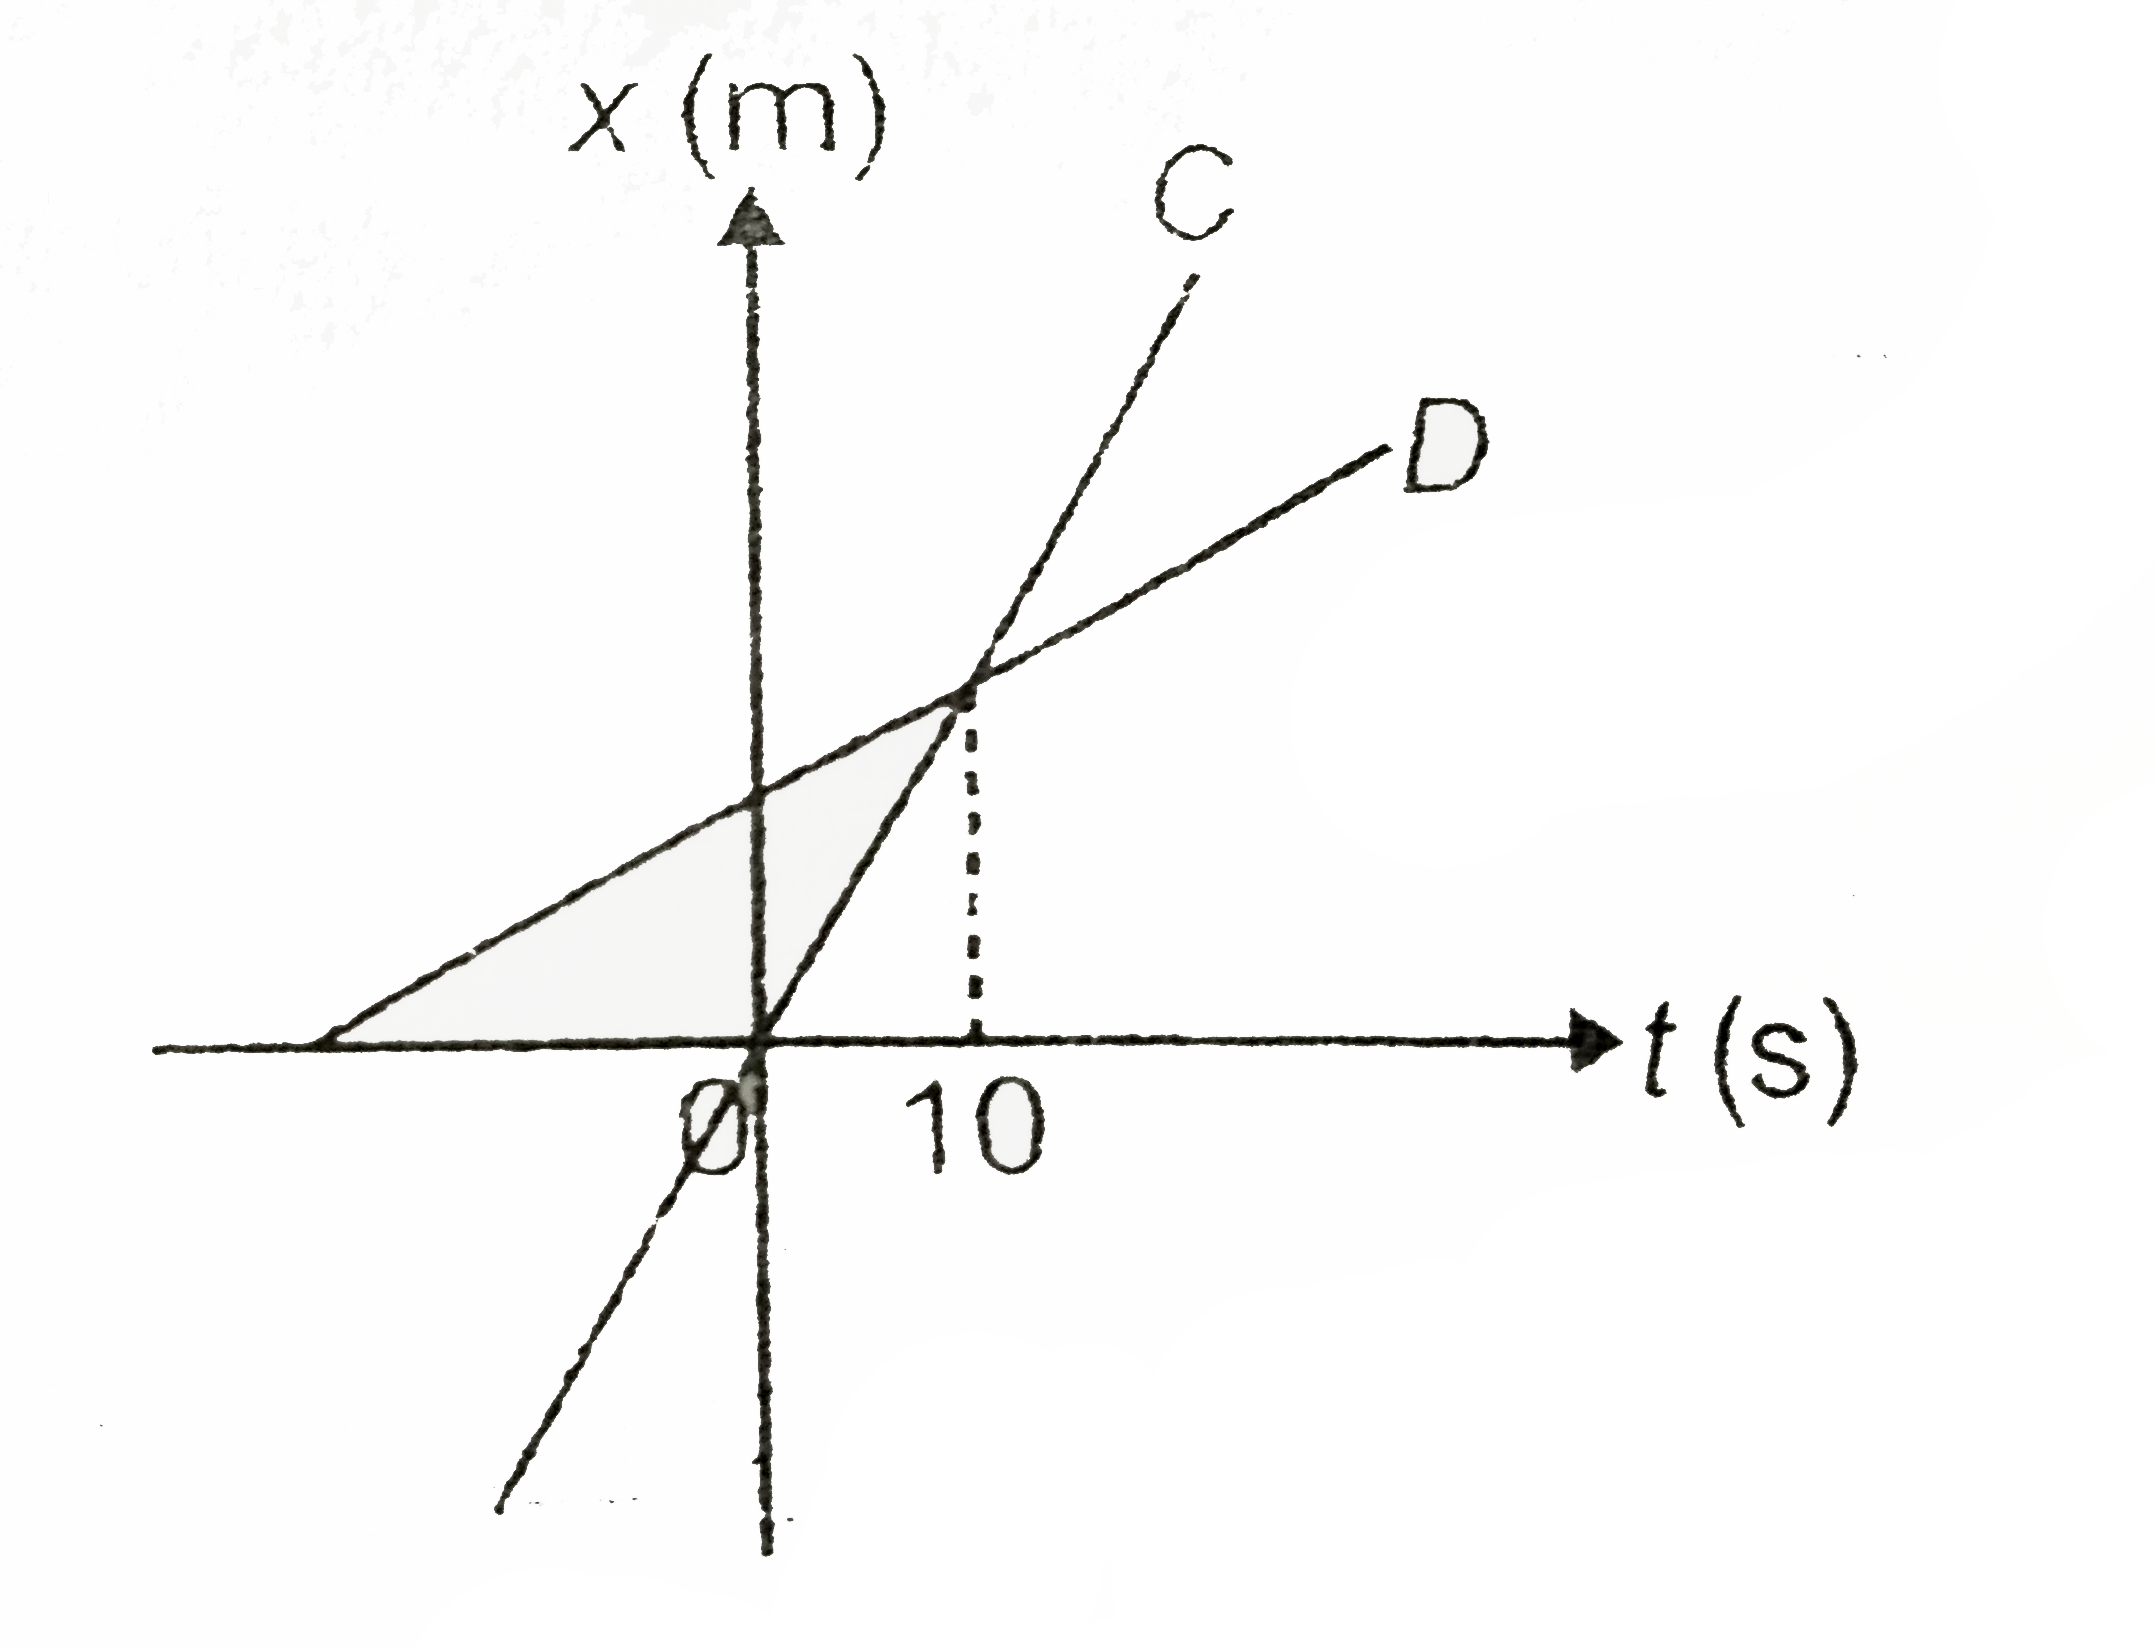
At t = 0 s
View Solution

