Two different rods A and B are kept as shown in figure . The variation of temperature of different cross sections with distance is plotted in a graph shown in figure . The ration of thermal conductivities of A andB is -
_E01_027_Q01.png)
2
0.5
1
2/3
The correct Answer is:B
∵(ΔQΔt)A=(ΔQΔt)B
∴KAA(100−70)30=KBA(70−35)70
⇒KA=KB2⇒KAKB=12
Topper's Solved these Questions
- BOOK - ALLENCHAPTER - GEOMETRICAL OPTICSEXERCISE - EXERCISE -0282videos
GEOMETRICAL OPTICS
- BOOK - ALLENCHAPTER - GEOMETRICAL OPTICSEXERCISE - EXERCISE -0311videos
GEOMETRICAL OPTICS
- BOOK - ALLENCHAPTER - GEOMETRICAL OPTICSEXERCISE - SOME WORKED OUT EXAMPLES84videos
GEOMETRICAL OPTICS
- BOOK - ALLENCHAPTER - CURRENT ELECTRICITYEXERCISE - All Questions427videos
CURRENT ELECTRICITY
- BOOK - ALLENCHAPTER - GRAVITATIONEXERCISE - EXERCISE 49videos
GRAVITATION
Similar Questions
Two different rods A and B are kept as shown in the figure. The variation of temperature of different cross-sections is plotted Find the ratio" of thermal conductivities of B to A.
'(##CEN_KSR_PHY_JEE_C13_E01_031_Q08##)'View SolutionA rod is heated at one end as shown in figure. In steady state temperature of different sections becomes constant but not same. Why so?
 . View Solution
Knowledge Check
- Question 1 - Select One
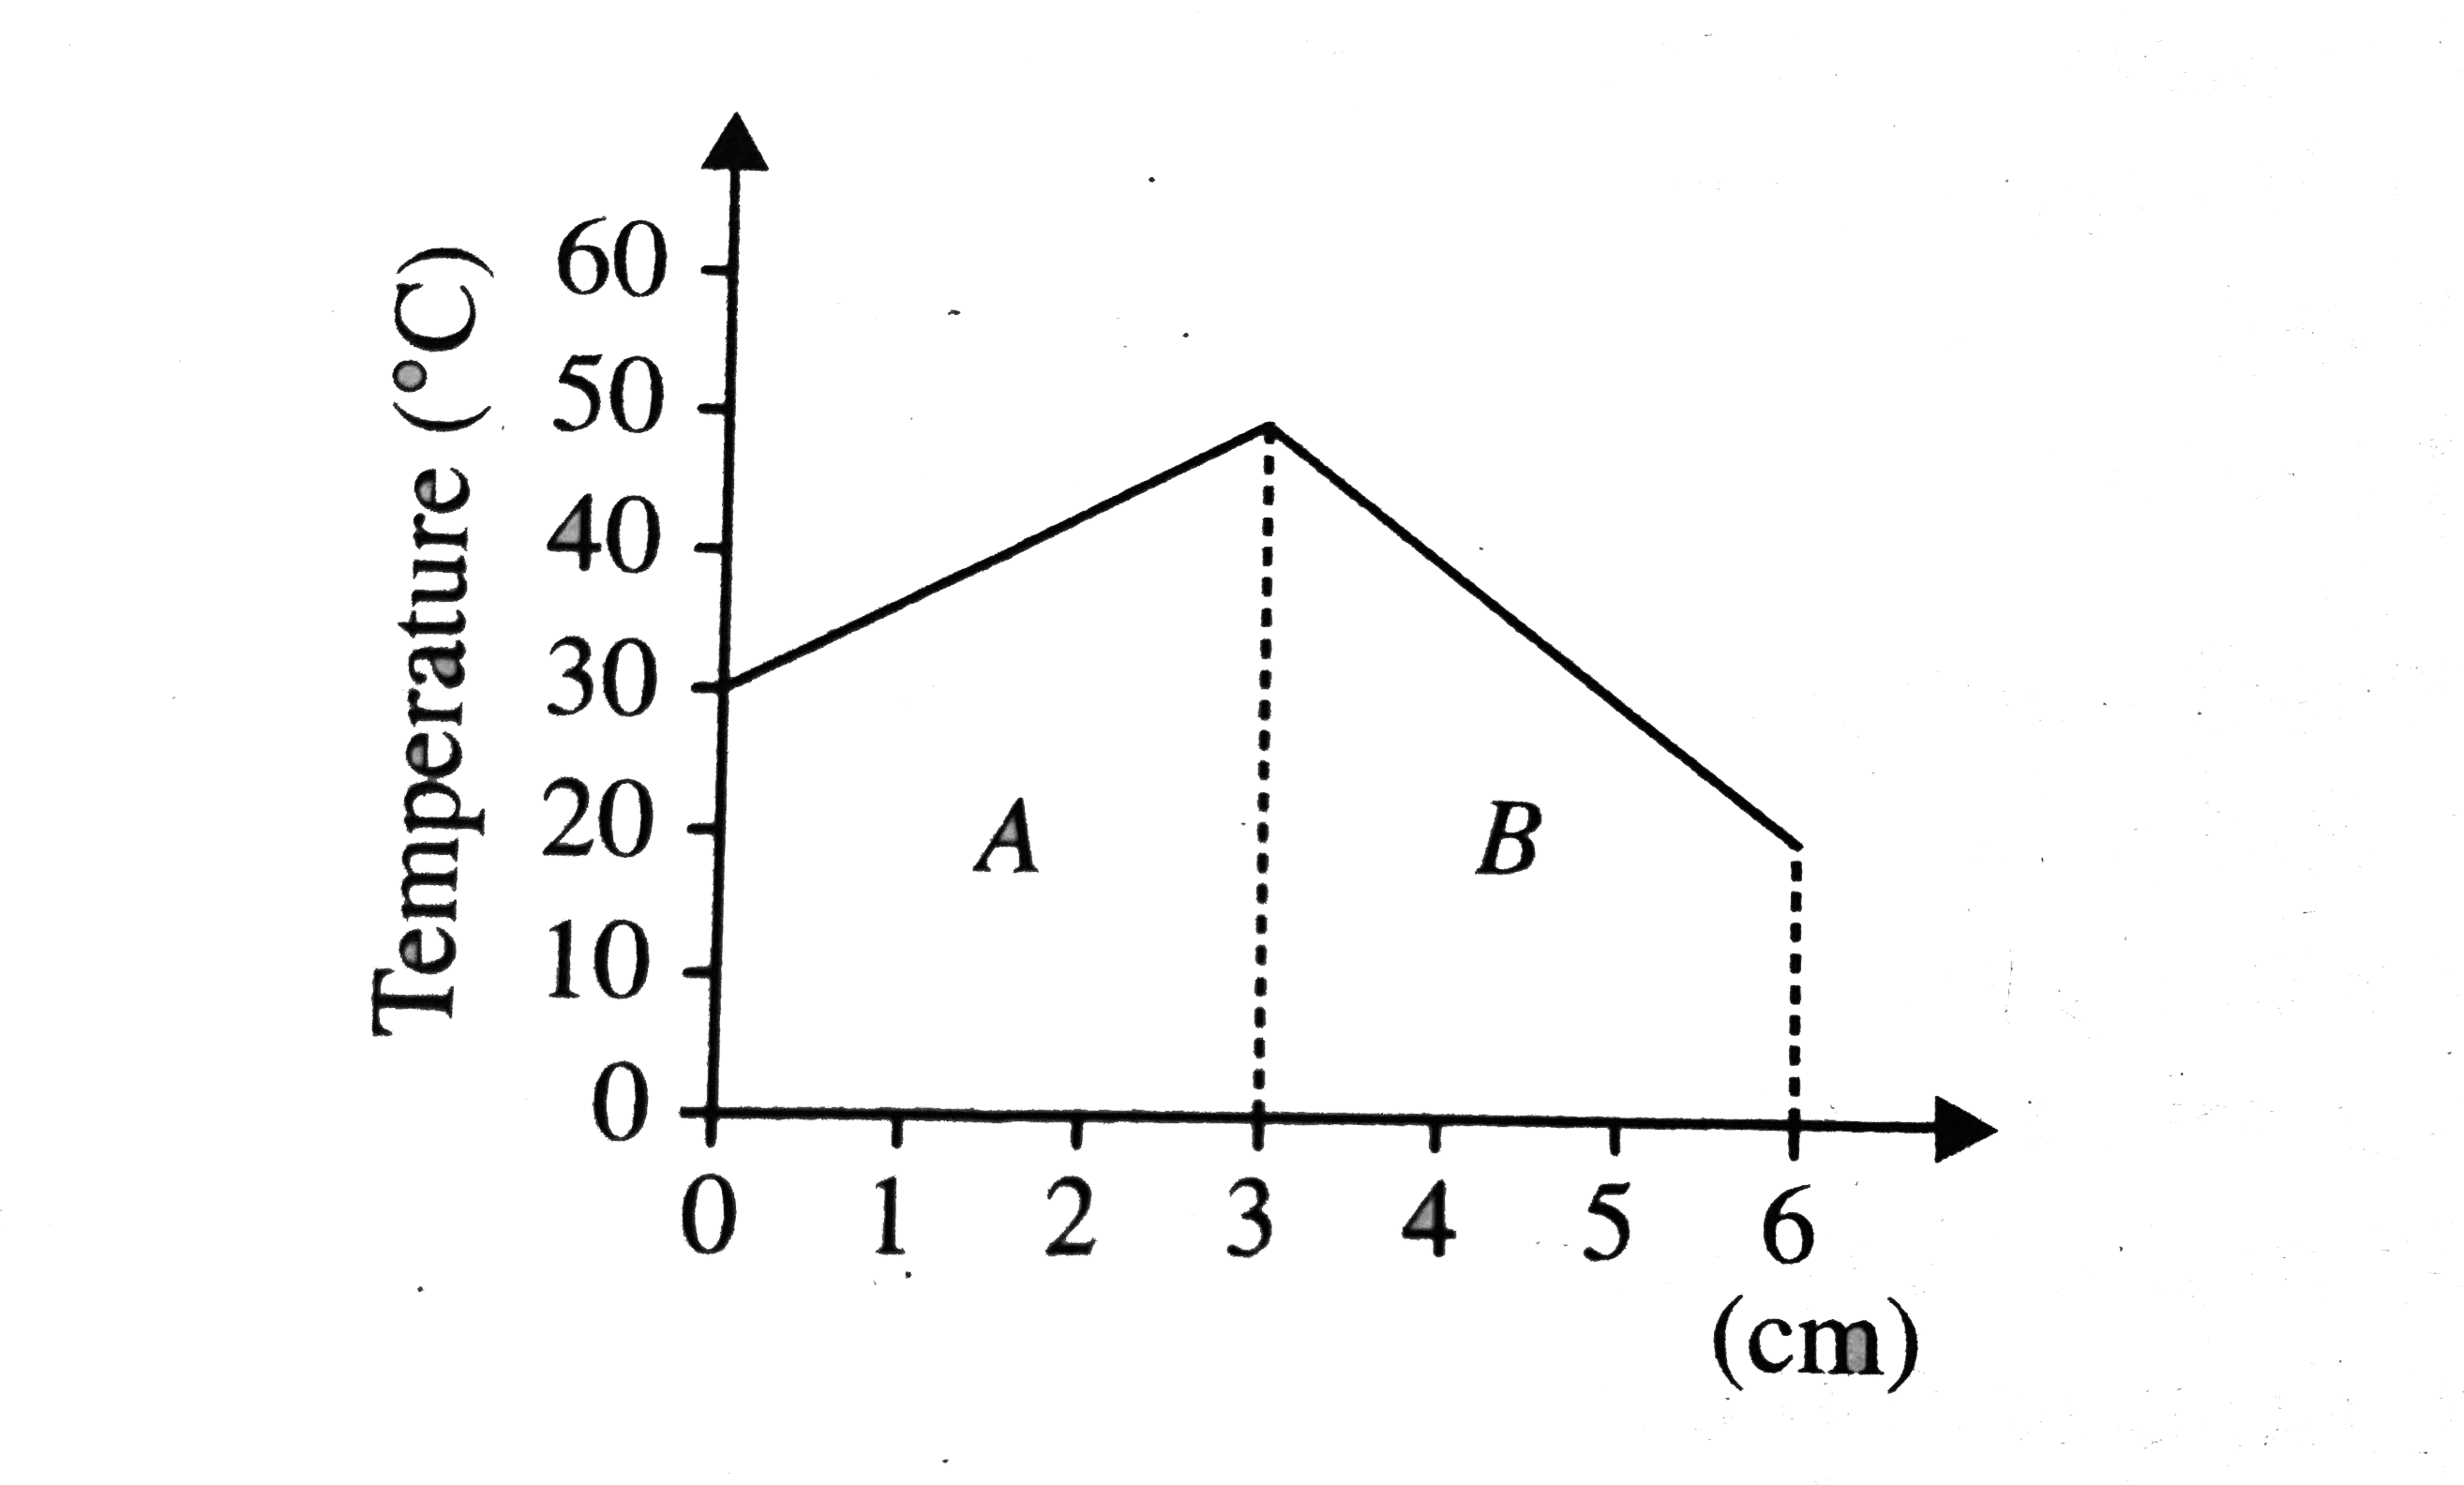
The temperature across two different slabs A and B are shown I the steady state (as shown Fig) The ratio of thermal conductivities of A and B isA2:3B3:2C1:1D5:3 - Question 2 - Select One
The potential difference between A and B as shown in figure is
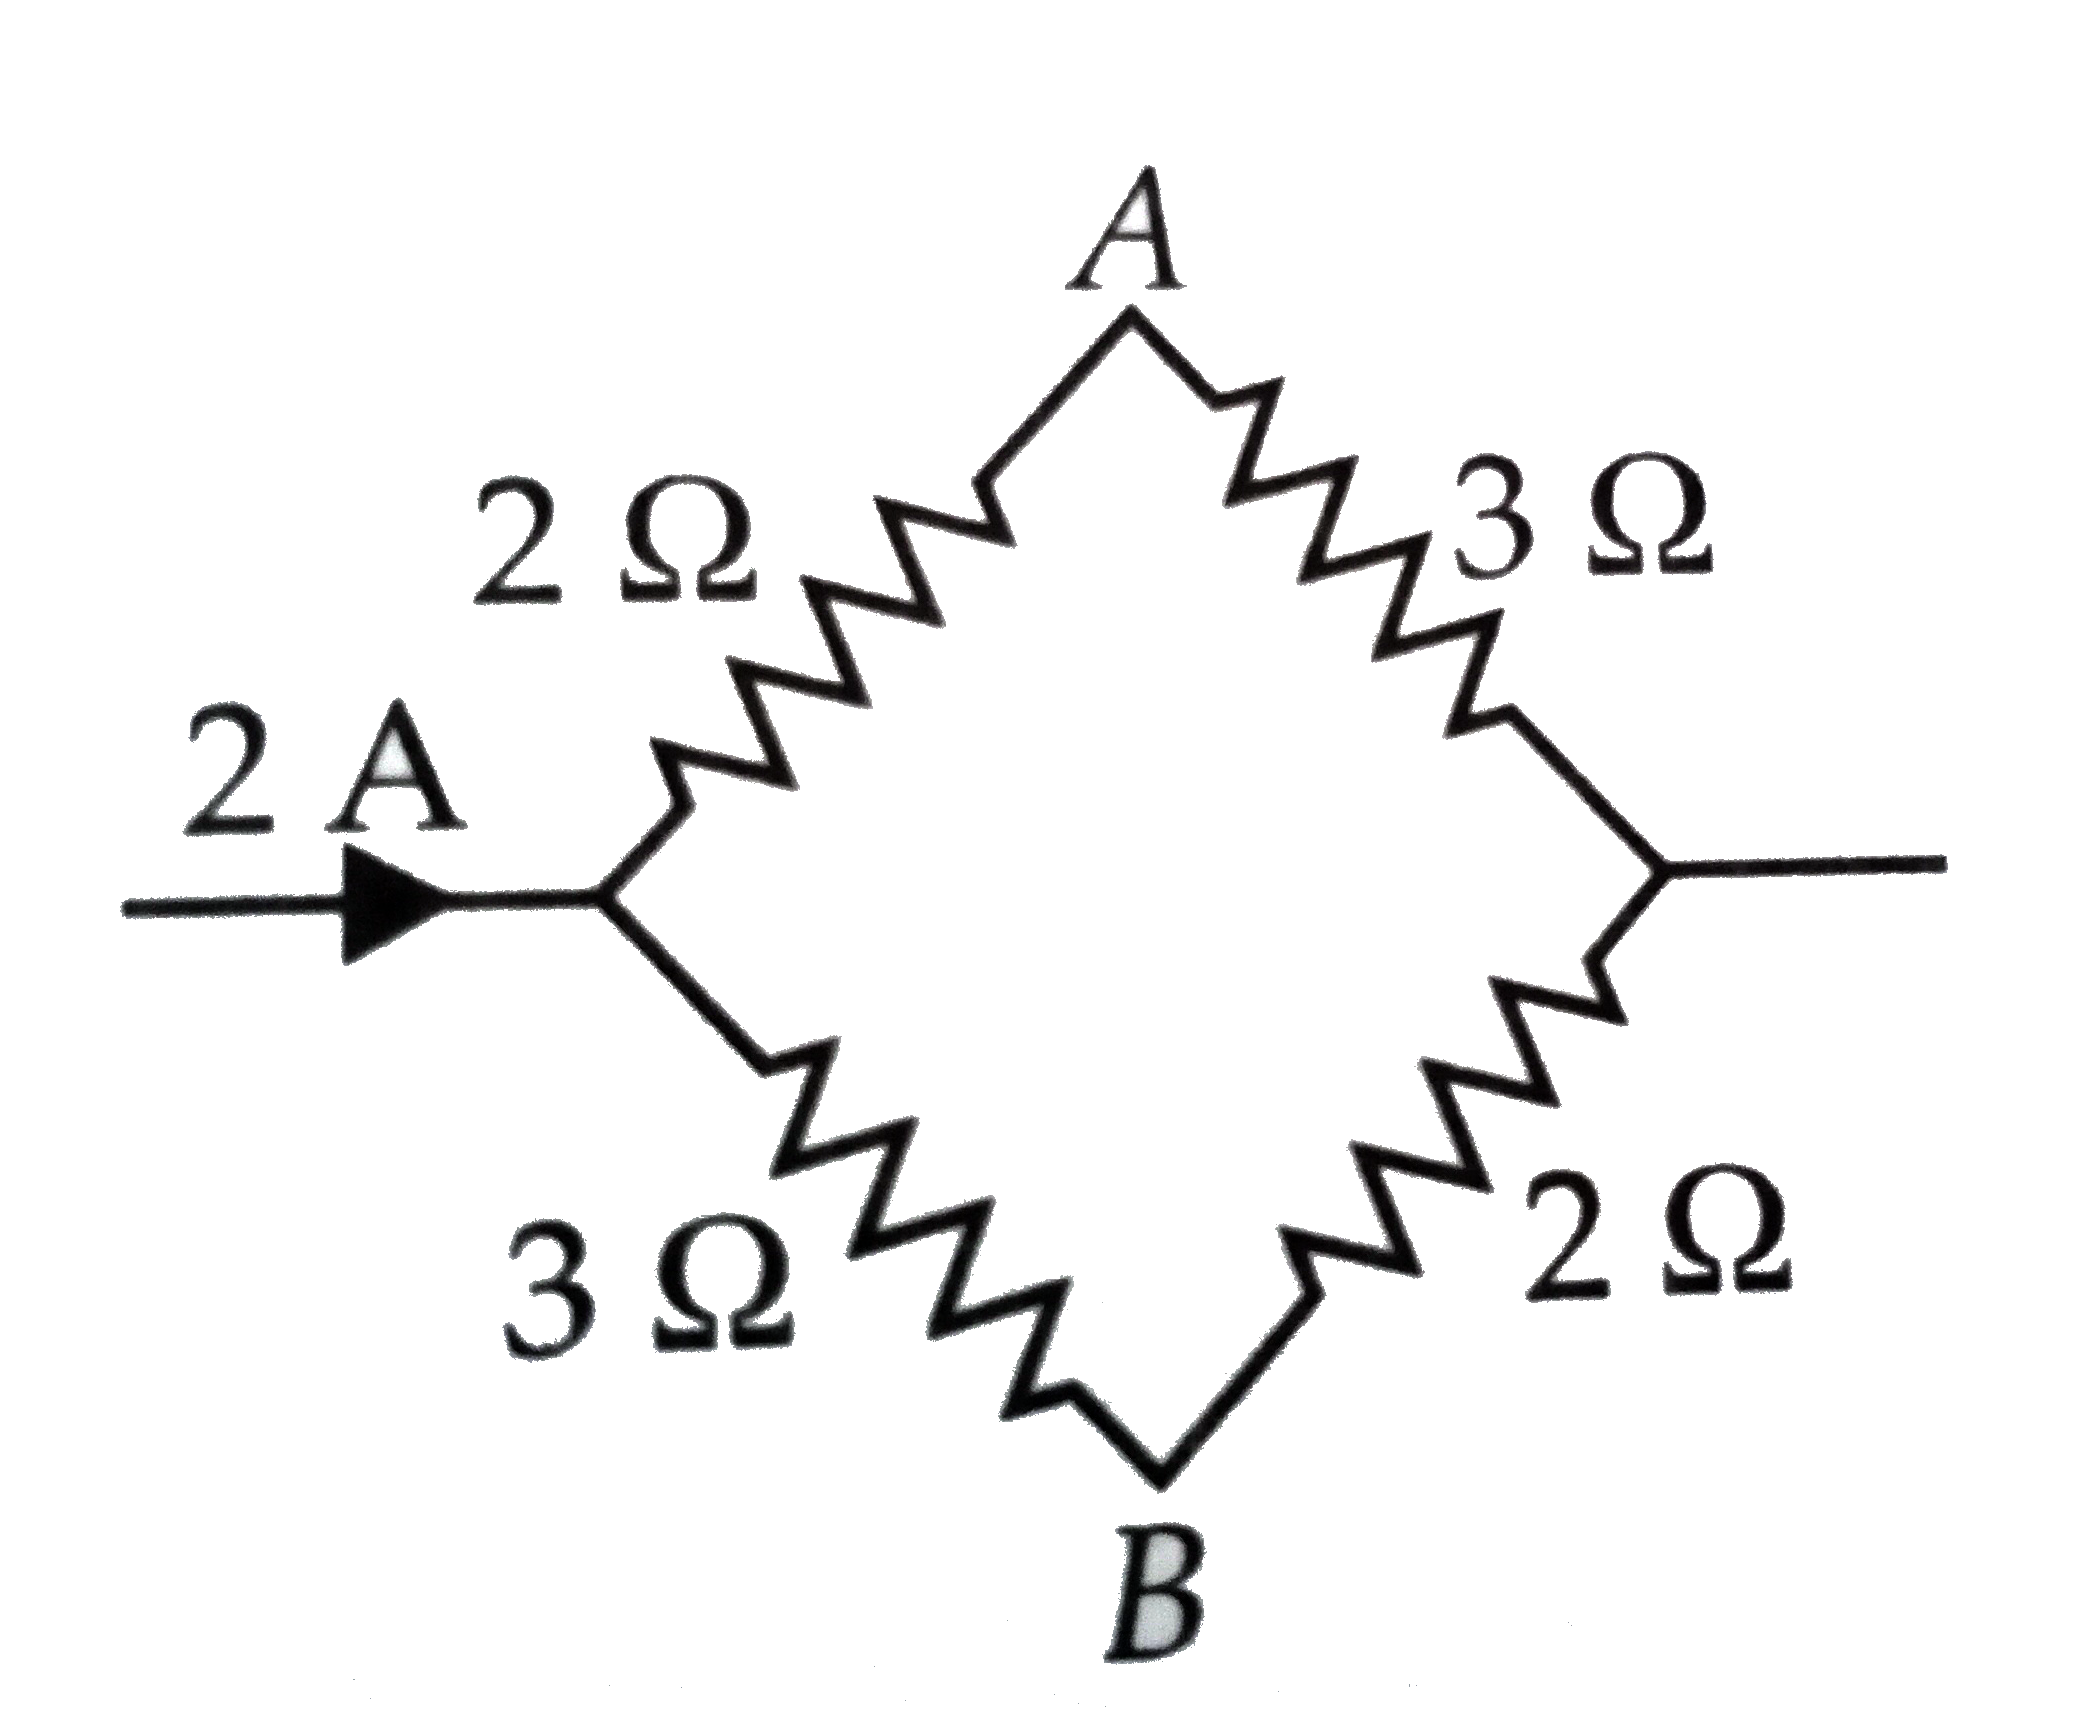 A1VB2VC3VD4V
 - Question 3 - Select One
The variation of lengths of two moles rods A and B with change in temperature is shown in figure . The ratio of αaαB is :-
_E01_013_Q01.png) A32B23C43D34
A32B23C43D34
Two different metal bodies A and B of equal mass are heated at a uniform rate under similar conditions. The variation of temperature of the bodies is graphically represented as shown in the figure. The ratio of specific heat capacities is :
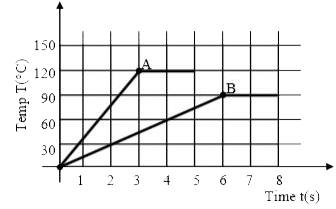 View Solution
The variation of vapour pressure of different liquids with temperature is shown in figure
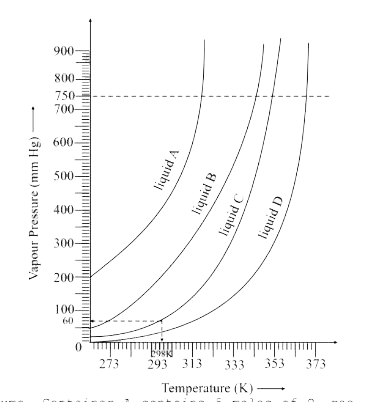
Calculate graphically boiling points of liquids A and B.View Solution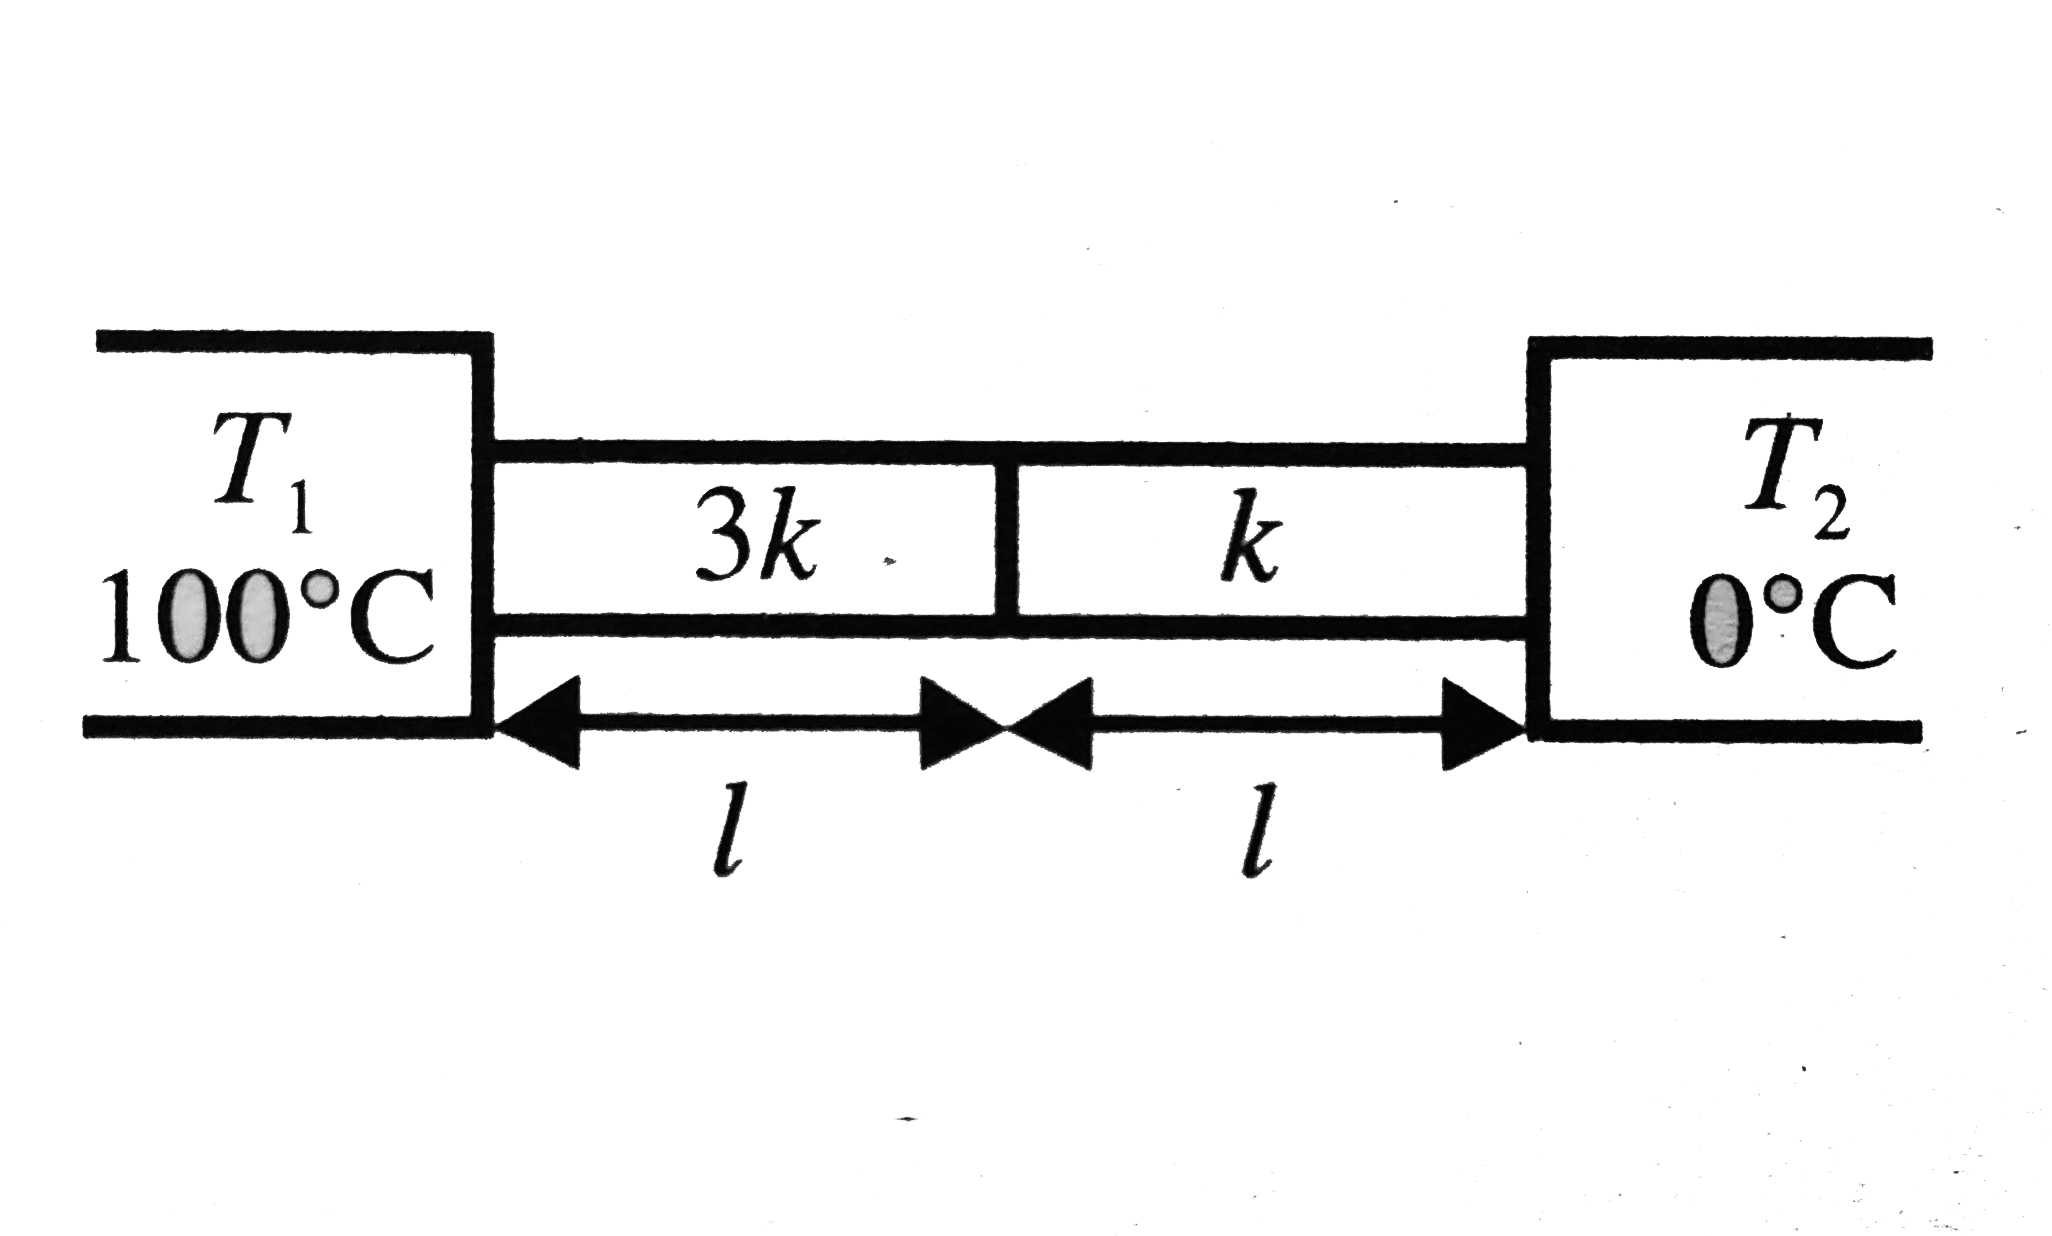
Two rods A and B of same length and cross-sectional area are connected in series and a temperature difference of 100∘C is maintained across the combination as shoen in Fig. If the thermal conductivity of the rod A is 3 k and that of rod B is k, Then
i.Determine the thermal resistance of each rod.
ii. determine the heat current flowing through each rod.
iii. determine the heat current flowing through each rod.
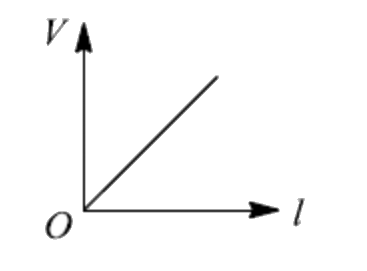
iv. plot the variation of temperature along the length of the rod.View SolutionThe V – I graph for a wire of copper of length L and cross -section area A is shown in the figure below . The slope of the graph will be
 View Solution
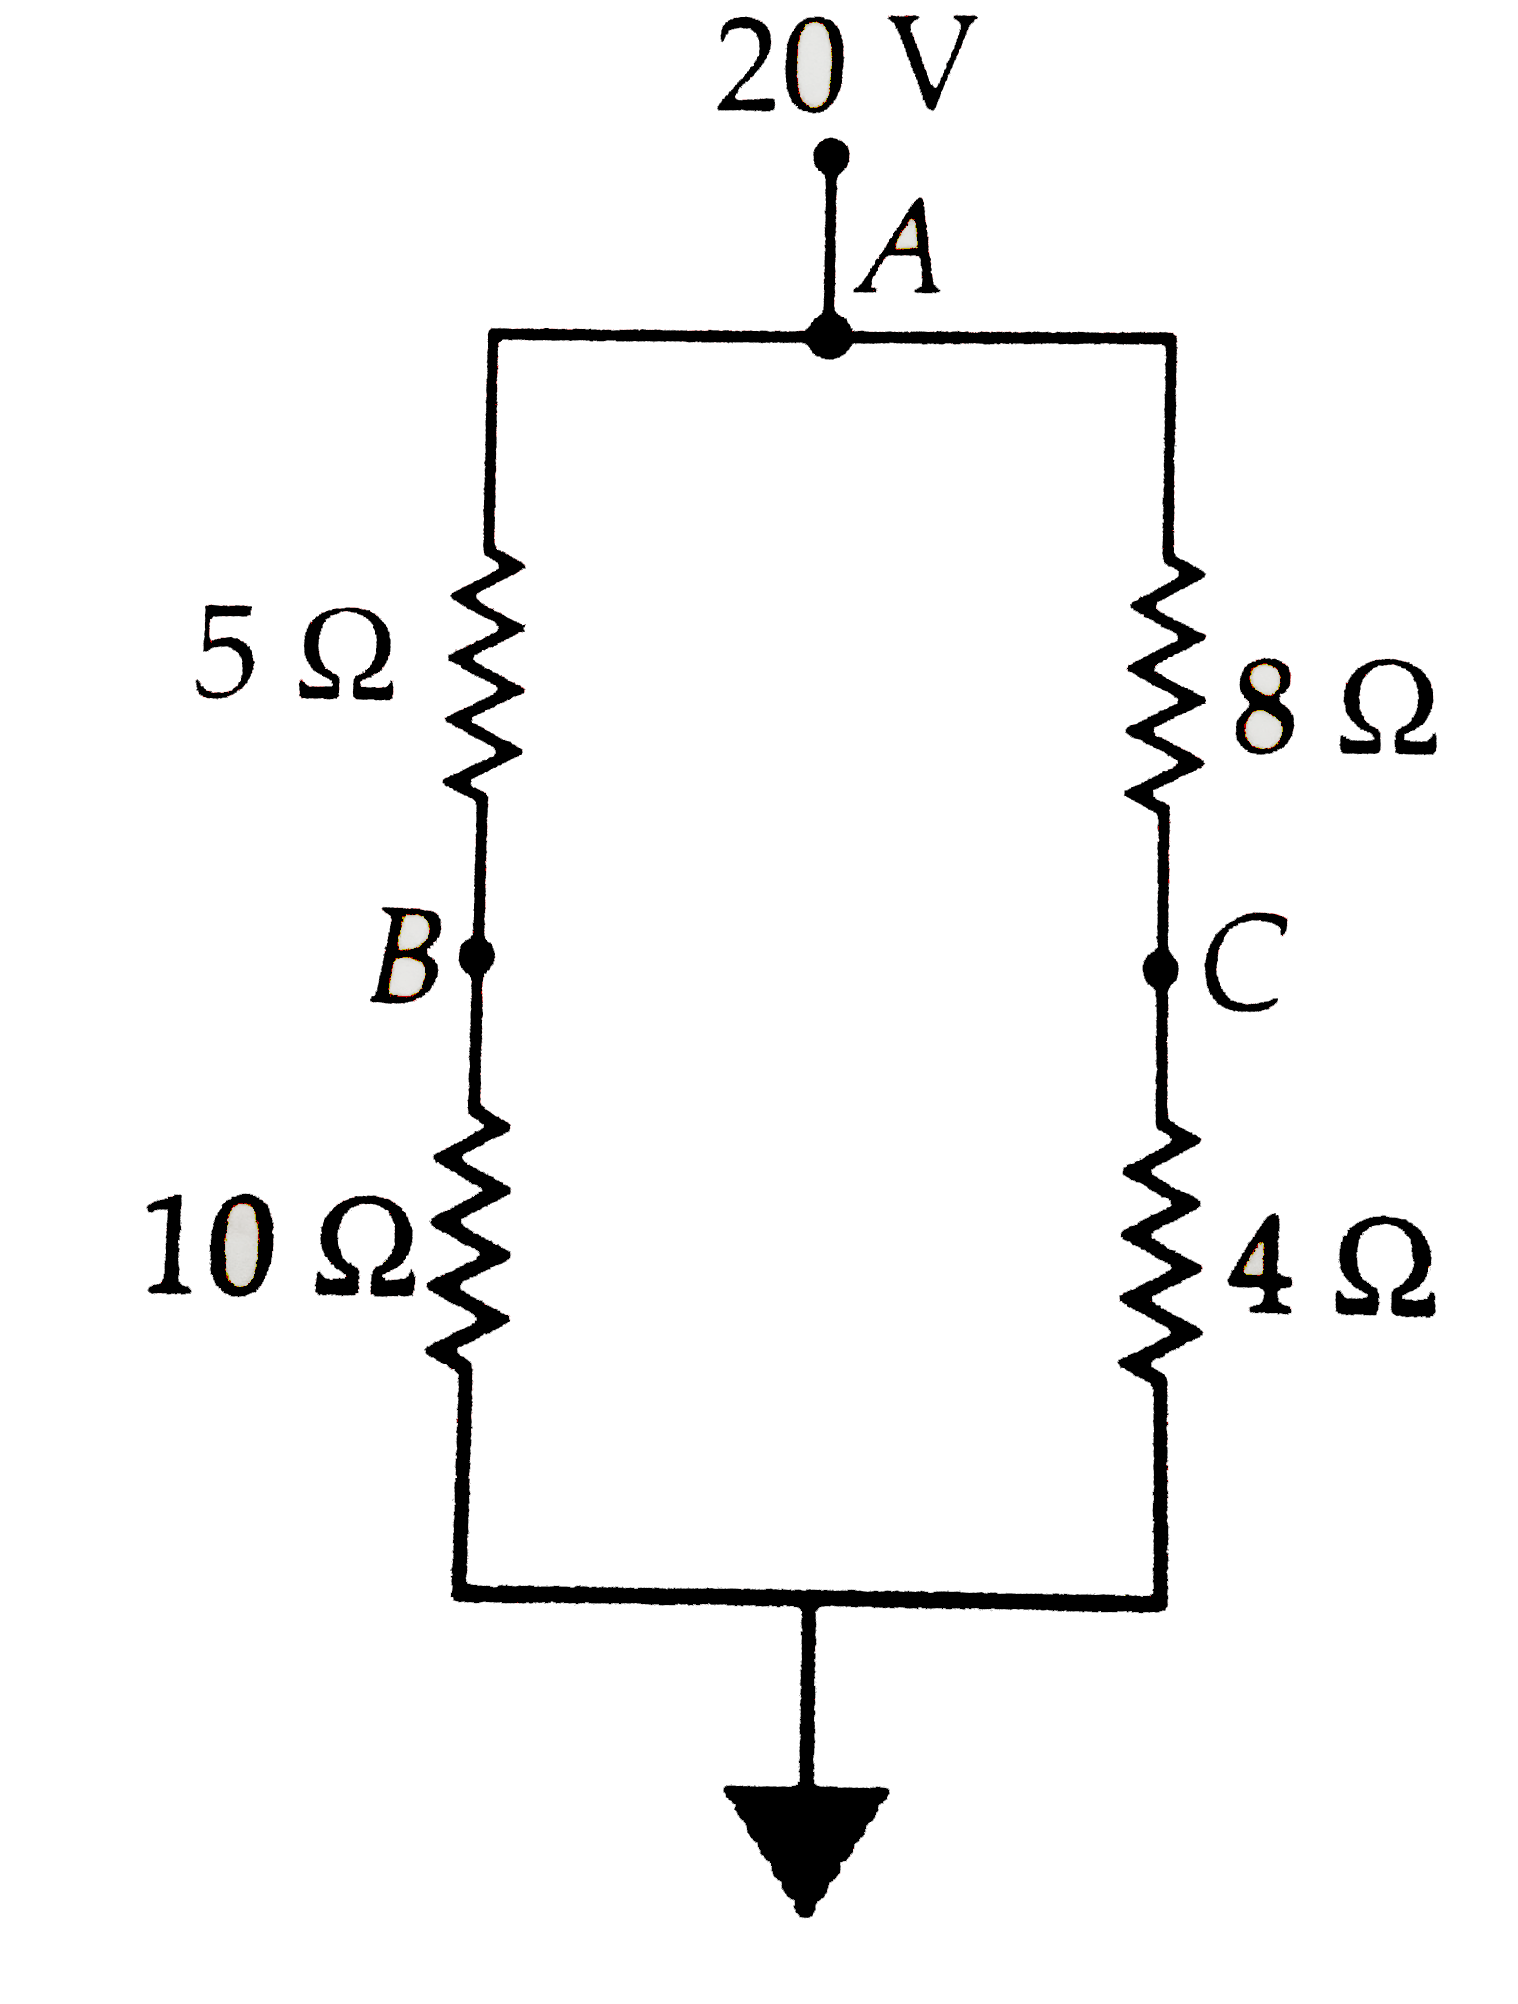
What is the potential difference between the points A and B in the circuit diagram shown in figure ?
 View Solution

