Following graph shows the correct variation in intensity of heat radiations by black body and frequency at a fixed temperature
A
_E01_029_O01.png)
B
_E01_029_O02.png)
C
_E01_029_O03.png)
D
_E01_029_O04.png)
Video Solution
Text Solution
The correct Answer is:C
According to Wien's law λmα1T⇒vmαT. As the temperature of body increases, frequency corresponding to maximum energy in radiation (vm) increases. Also area under the curve
∫EvdvαT4
|
Topper's Solved these Questions
- GEOMETRICAL OPTICSBOOK - ALLENCHAPTER - GEOMETRICAL OPTICSEXERCISE - EXERCISE -02
82 Videos
- GEOMETRICAL OPTICSBOOK - ALLENCHAPTER - GEOMETRICAL OPTICSEXERCISE - EXERCISE -03
11 Videos
- GEOMETRICAL OPTICSBOOK - ALLENCHAPTER - GEOMETRICAL OPTICSEXERCISE - SOME WORKED OUT EXAMPLES
84 Videos
- CURRENT ELECTRICITYBOOK - ALLENCHAPTER - CURRENT ELECTRICITYEXERCISE - All Questions
427 Videos
- GRAVITATIONBOOK - ALLENCHAPTER - GRAVITATIONEXERCISE - EXERCISE 4
9 Videos
Similar Questions
Knowledge Check
Which of the following graphs shows the correct variation in intensity of heat radiations by black body and frequency at a fixed temperature
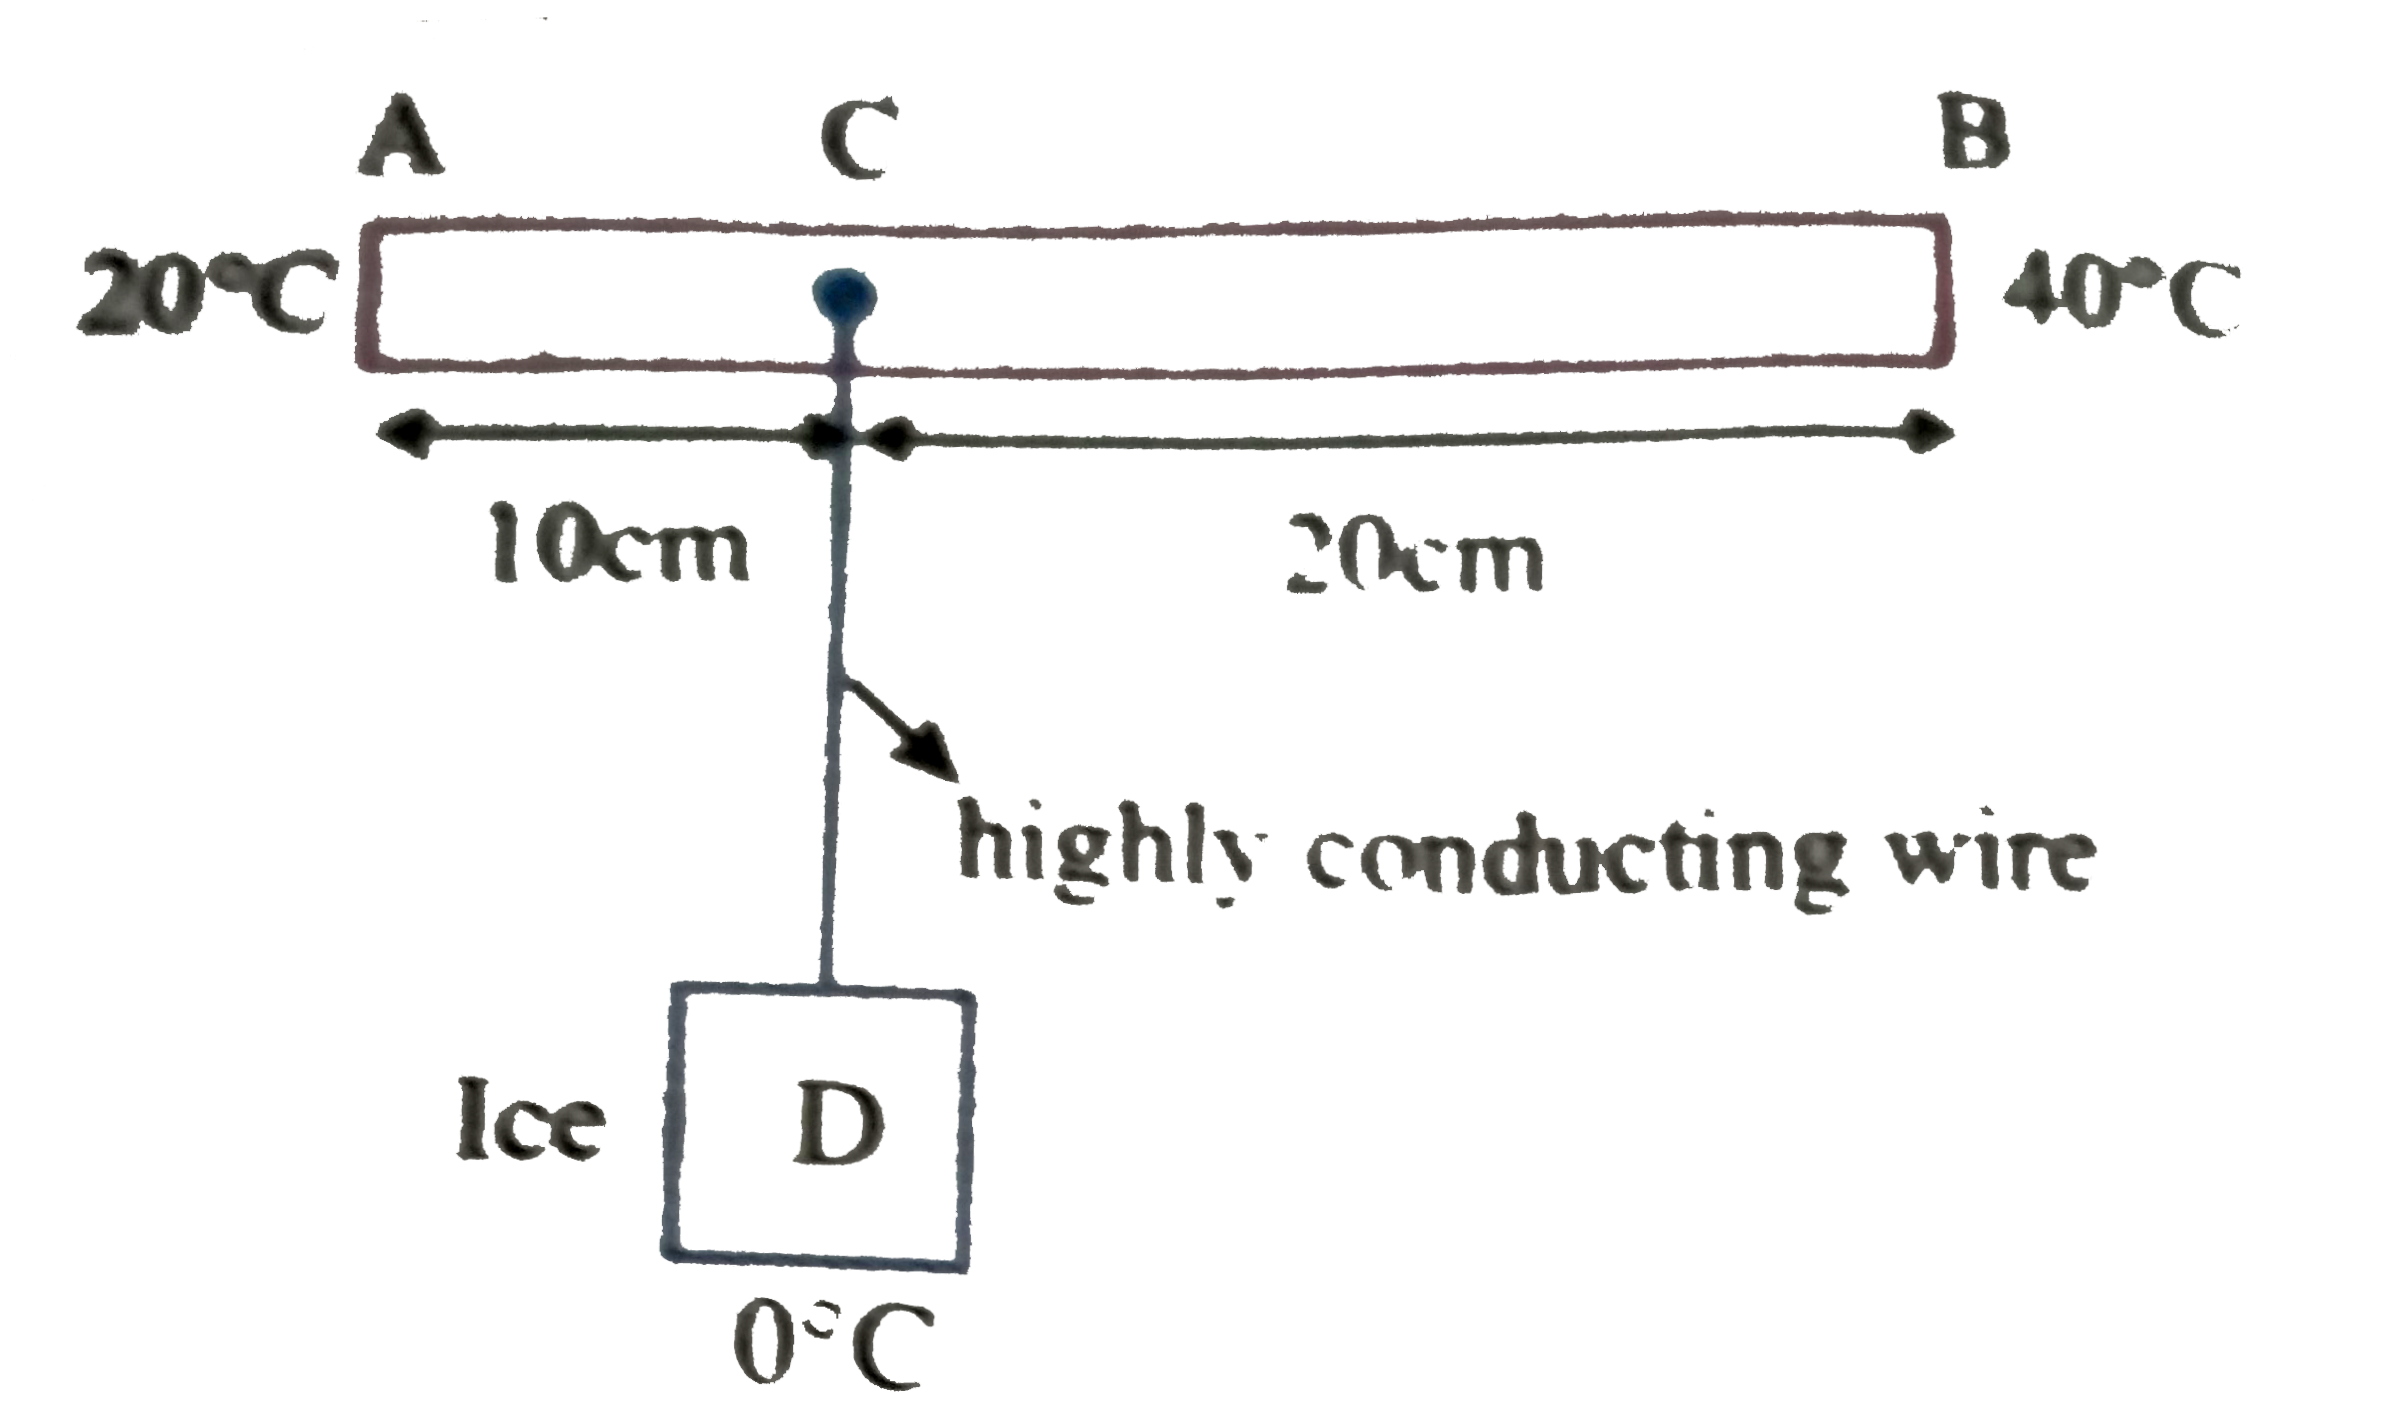 .A
.A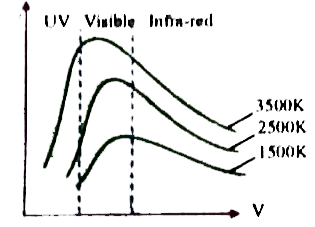 B
B C
C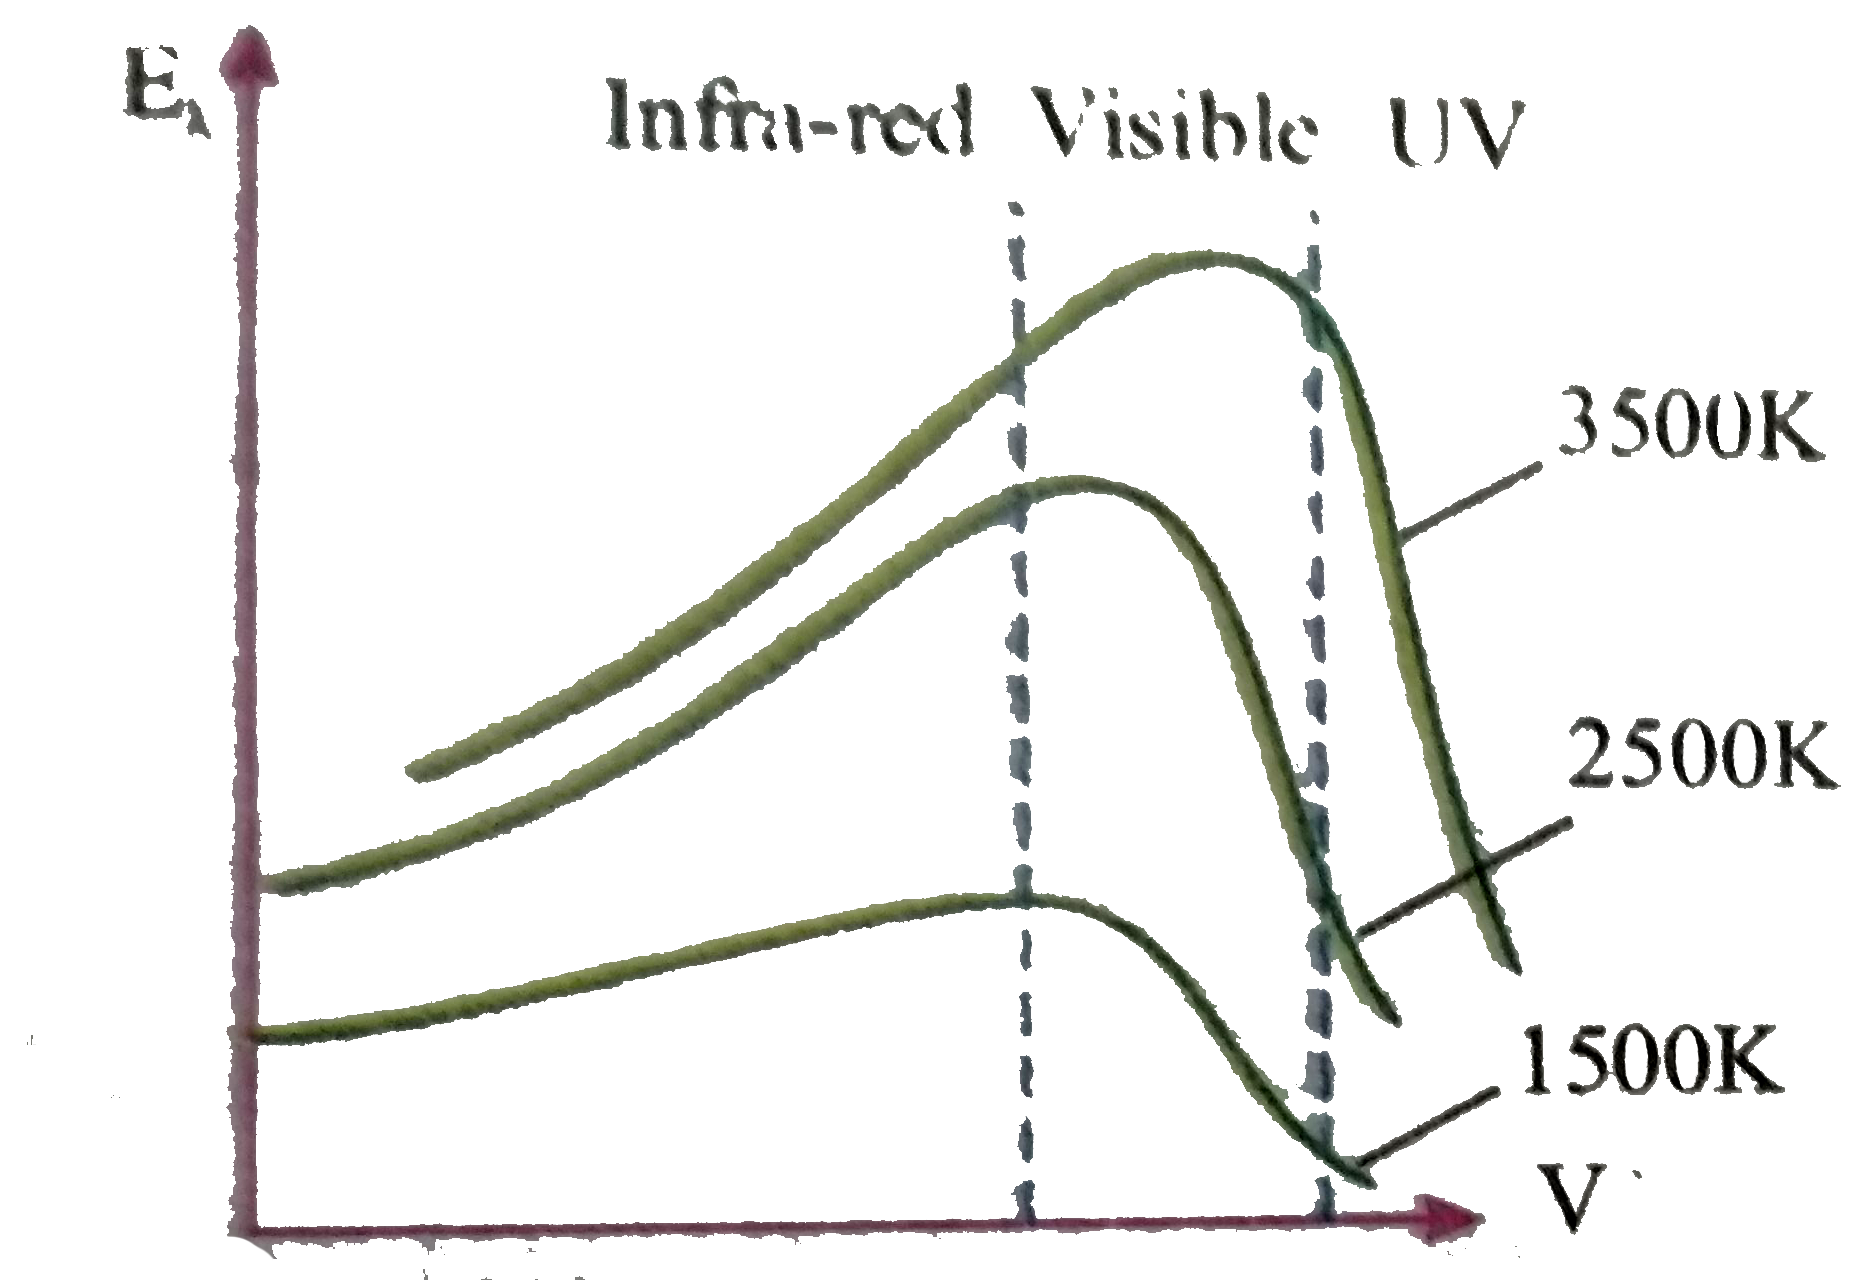 D
D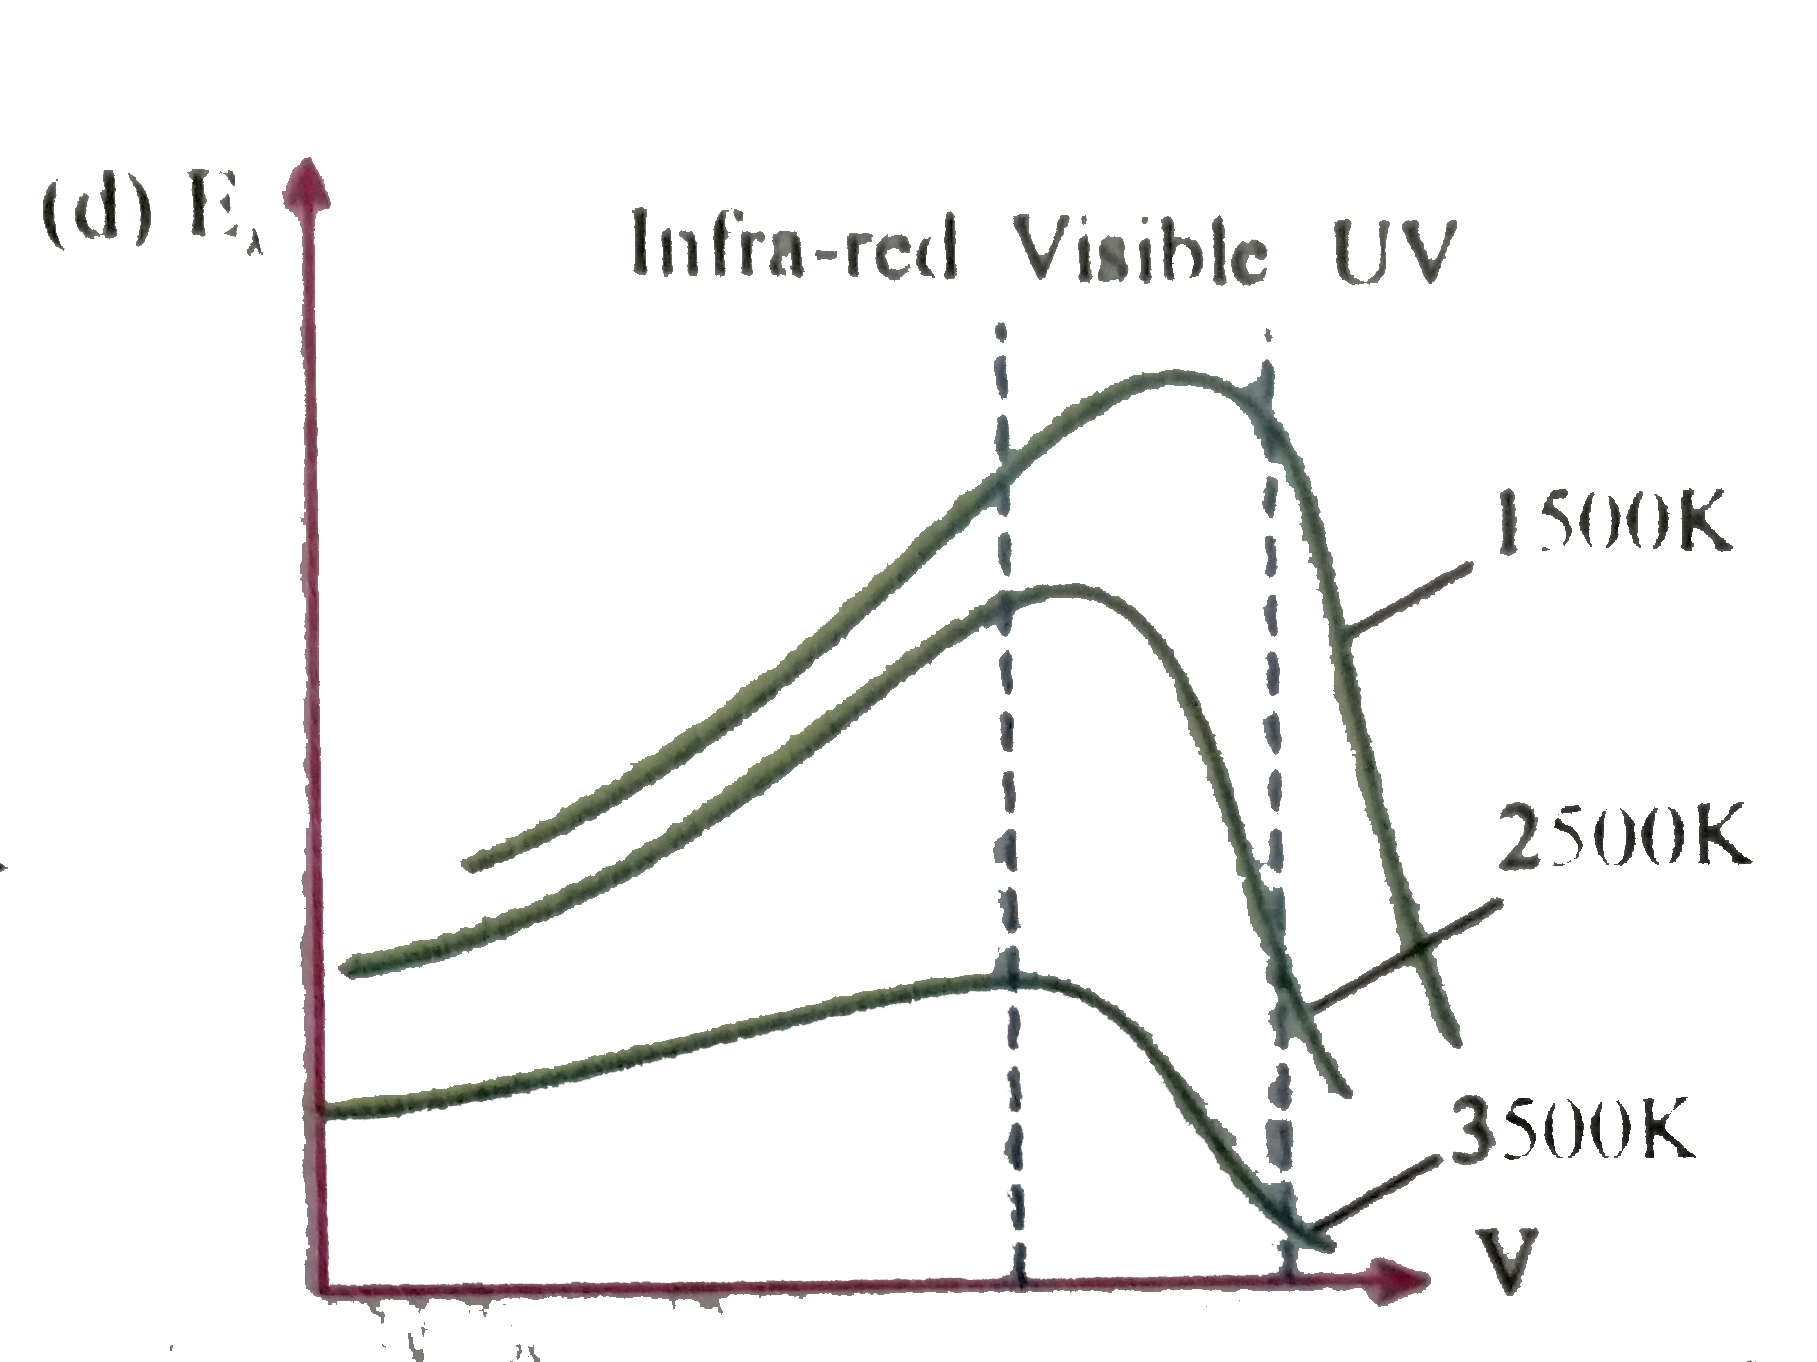
Following graphs shows the variation in the intensity of heat radiations by the the black body and frequency at a fixed temperature . Choose the correct option.
A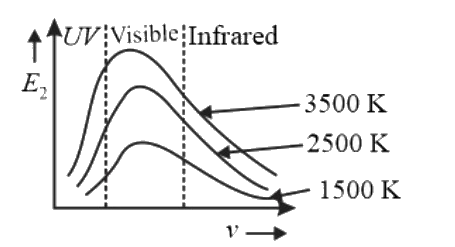 B
B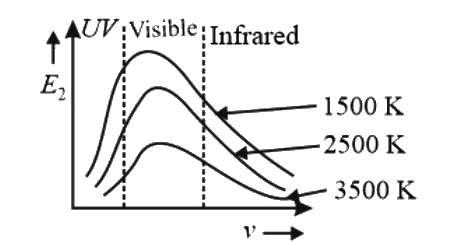 C
C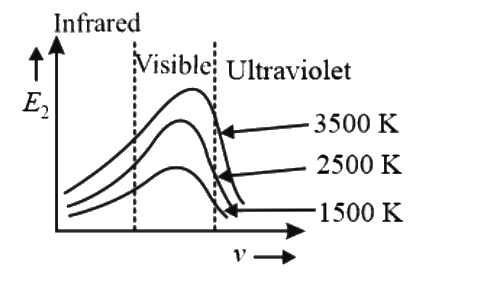 D
D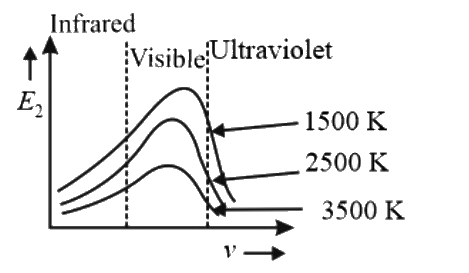
Mark out the correct statement with respect to thermal radiations emitted by a black body
AAt a given temperature, , energy is distributed non - uniformly among different wavelengthsBAs temperature of body is increased , energy content of all wavelengths decreasesCThe product of Eλ (spectral energy) with Dλ (spectral width) , for all equal Δλ' is the sameDThe thermal radiation emitted by a hot body is a discrete spectra
If a black body is heated at a high temperature, it seems to be
View SolutionIf a black body is heated at a high temperature, it seems to be
View SolutionIf a black body is heated at a high temperature, it seems to be
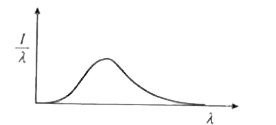
View SolutionThe graph shows the variation in radiation intensity per unit wavelength versus wavelength for a perfect black- body at temperature T. Complete the following statement: As the blackbody temperature is increased, the peak in intensity of this curve
View SolutionWhich of the following graphs represents correctly the variations of 0.5mv2max with the intensity of incident radiations of a constant frequency ?
View Solution

