if for a given substance , melting point is TB and freezing point is TA then correct variation of entropy by graph between entropy change and temperature is
A

B

C

D

Text Solution
The correct Answer is:a
for a pure substance, TAandTB represent the same temperature. Hence , A is correct choice.
|
Topper's Solved these Questions
- CHEMICAL THERMODYNAMICSBOOK - BITSAT GUIDECHAPTER - CHEMICAL THERMODYNAMICSEXERCISE - BITSAT Archives
15 Videos
- CHEMICAL KINETICSBOOK - BITSAT GUIDECHAPTER - CHEMICAL KINETICSEXERCISE - BITSAT Archives
16 Videos
- COORDINATION COMPOUNDSBOOK - BITSAT GUIDECHAPTER - COORDINATION COMPOUNDSEXERCISE - BITSAT Archives
7 Videos
Similar Questions
Knowledge Check
If for a given substance, melting point is TB and freezing point is TA then correct variation of entropy is by graph between entropy change and temperature is
A B
B C
C D
D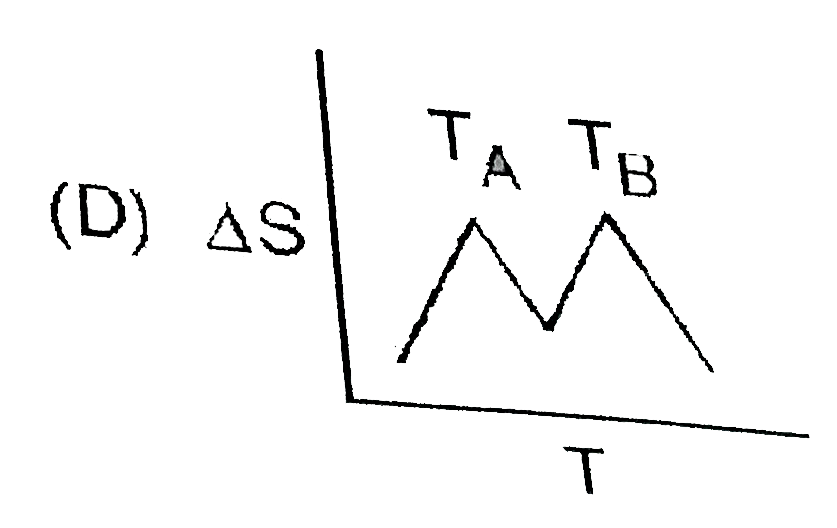
If for a given substance, melting point is TB and freezing point is TA then correct variation of entropy is by graph between entropy change and temperature is
A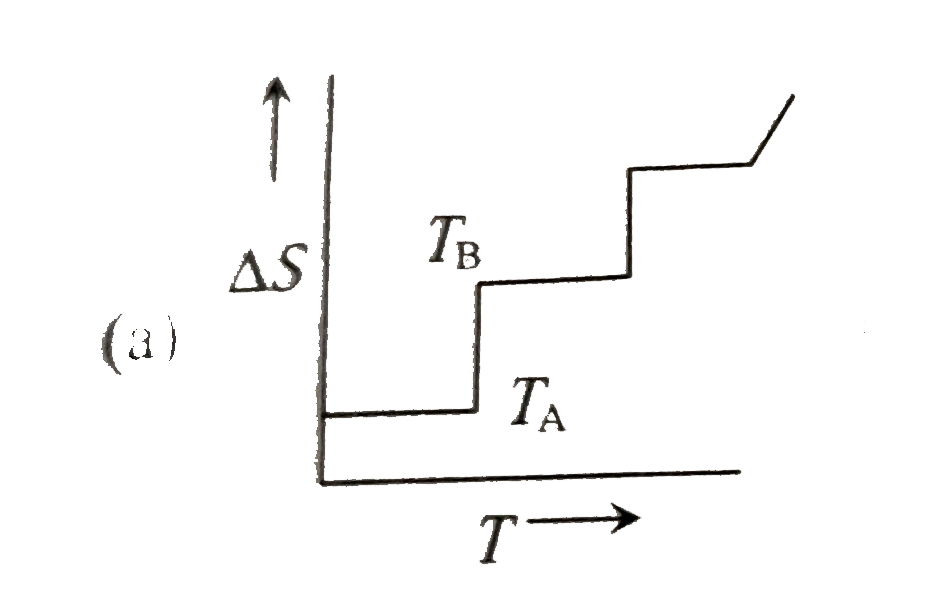 B
B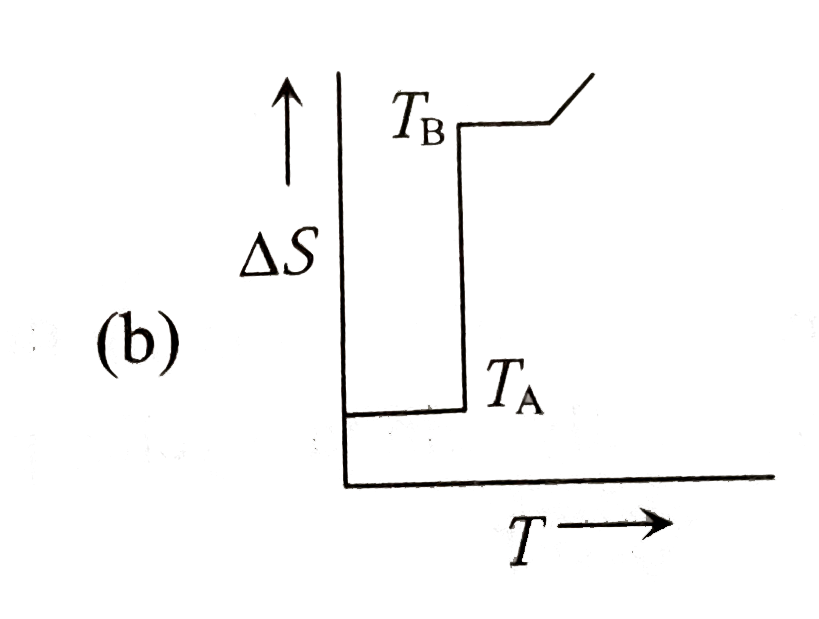 C
C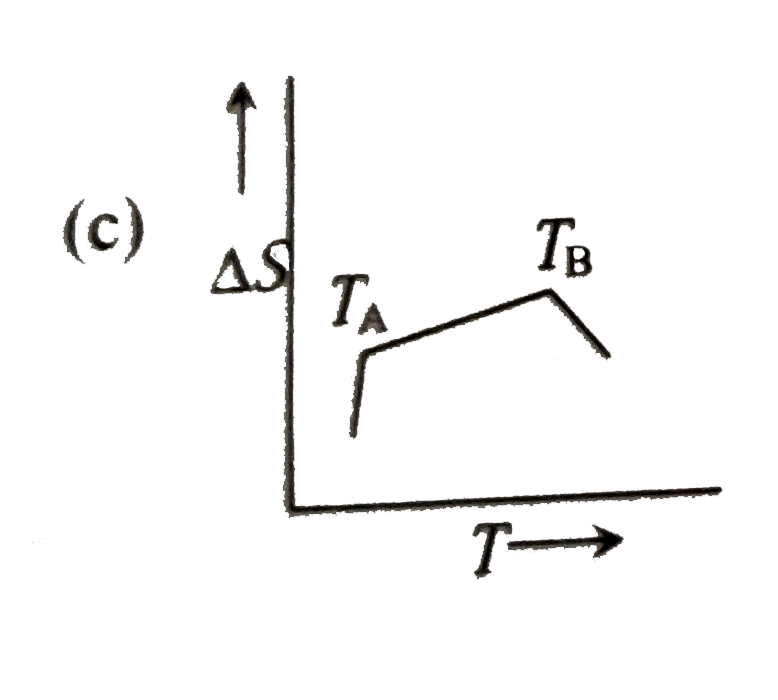 D
D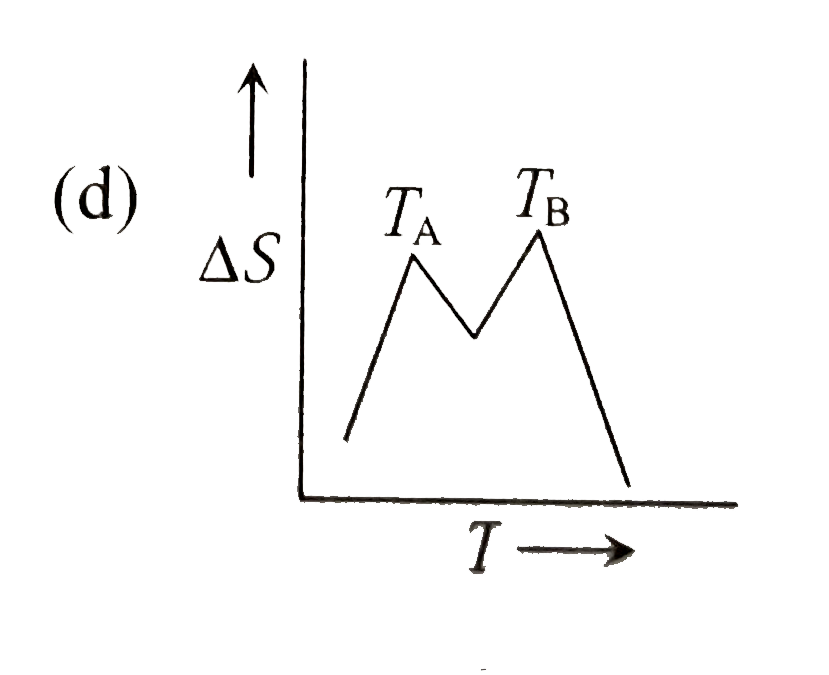
Observe the P-T phase diagram for a given substance A. Then melting point of A(s), boiling point of A(l), critical point of A and triple point of A (at their respective pressure) are respectively:
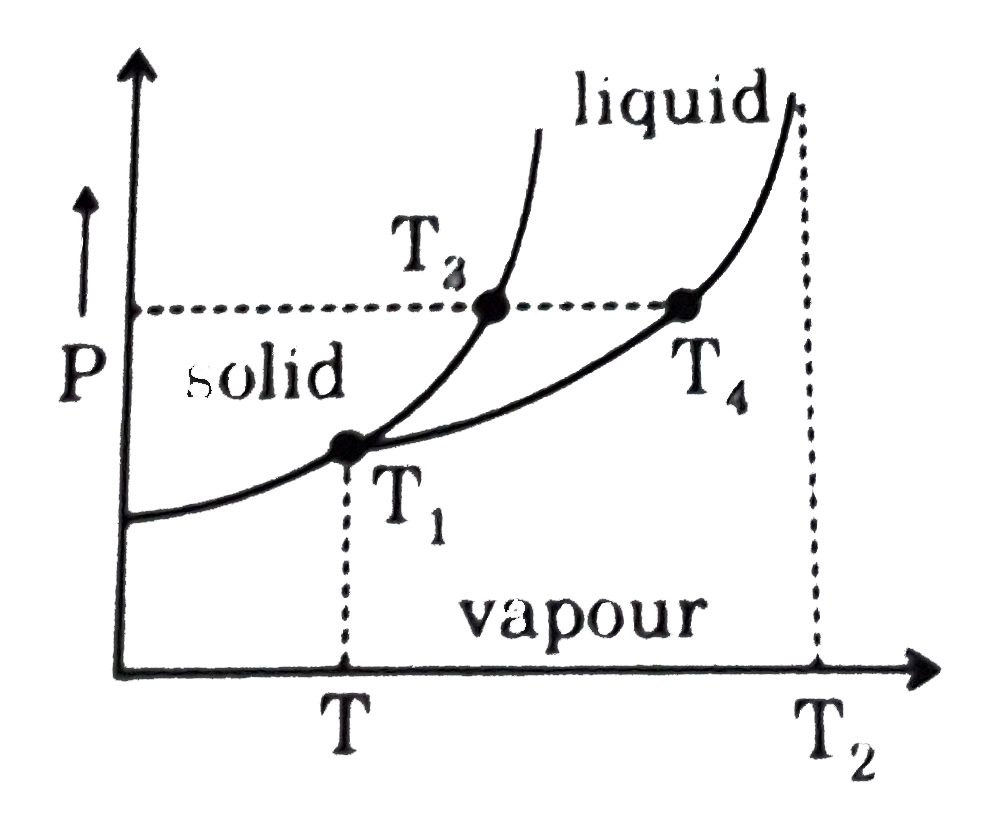 AT1,T2,T3,T4BT4,T3,T1,T2CT3,T4,T2,T1DT2,T1,T3,T4
The correct graph which shows the variation of paramagnetic susceptibility S with temperature T is
View SolutionObserve the P-T phase diagrams for a given substance A. Then melting point of A(s), boiling point of A(l), critical point of A and triple point of A (at their respective pressure) are respectively-
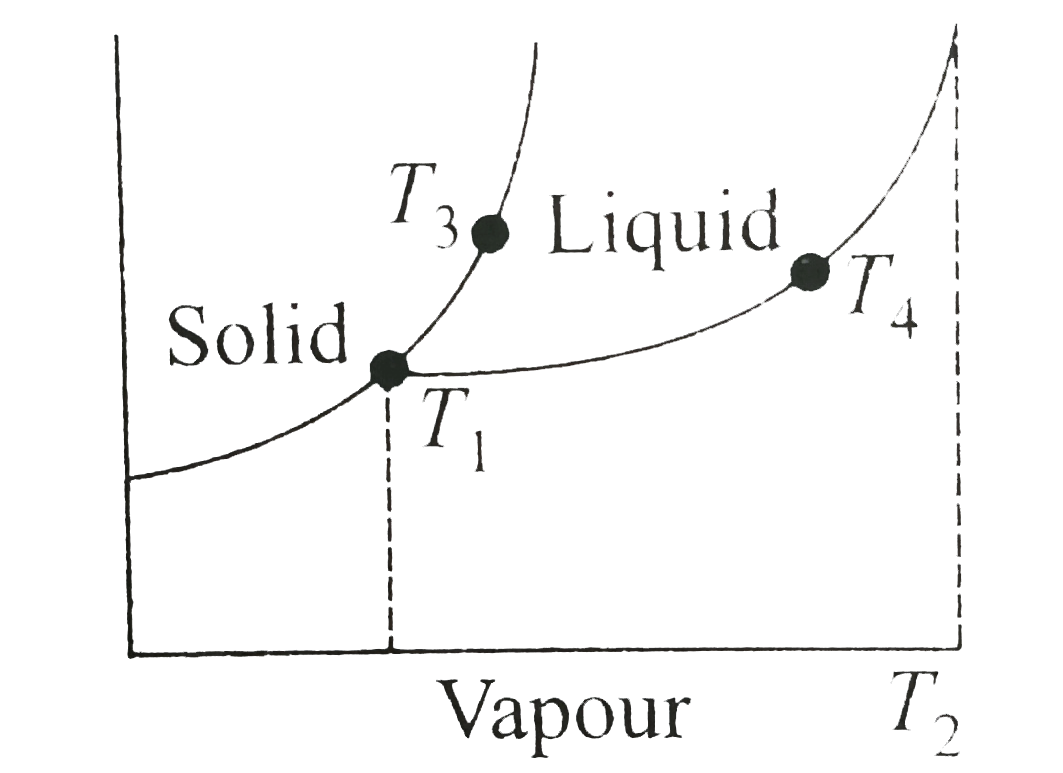
View SolutionThe correct graph which shows the variation of paramagnetic susceptibility S with temperature T is
View SolutionWhich of the following graphs best illustrates the variation of entropy of a substance with temp.
View SolutionThe relationship between the free energy change (ΔG) and entropy change (ΔS) at constant temperature (T) si
View Solution
