Consider the following statements -
(i) At same P, if V vs T graph is draw for sam e mass of the two idea gaes, then the heavier has will have a heighter slope.
(ii) Intercept of log V vs T graph should always be posiive.
(iii) Graph of V2 vs 1T2 for fixes amount of an ideal gas at constant pressure will be a parabola.
A
FTF
B
FFT
C
FFF
D
TTF
Text Solution
The correct Answer is:C
(i) M1>M2 (Gas is heavier)
n1>n2
V=n1RTV=n2RT P P Slope Slope
Heavier gas has lower slope
(ii) PV = nRT
V=nRPT
log V = log nRP+ log T
Intercept C = log nRP (Can be postive and negative)
|
Topper's Solved these Questions
- TEST PAPERSBOOK - BANSALCHAPTER - TEST PAPERSEXERCISE - CHEMISTRY PART (A)
14 Videos
- TEST PAPERSBOOK - BANSALCHAPTER - TEST PAPERSEXERCISE - CHEMISTRY PART (B)
1 Videos
- TEST PAPERSBOOK - BANSALCHAPTER - TEST PAPERSEXERCISE - Chemistry PART D
4 Videos
- SOLUTIONSBOOK - BANSALCHAPTER - SOLUTIONSEXERCISE - Exercise4
32 Videos
- THERMOCHEMISTRYBOOK - BANSALCHAPTER - THERMOCHEMISTRYEXERCISE - Exercise 4
15 Videos
Similar Questions
Knowledge Check
For fixed amount of an ideal gas taken at constnat temperature V vs 1p2 is :
A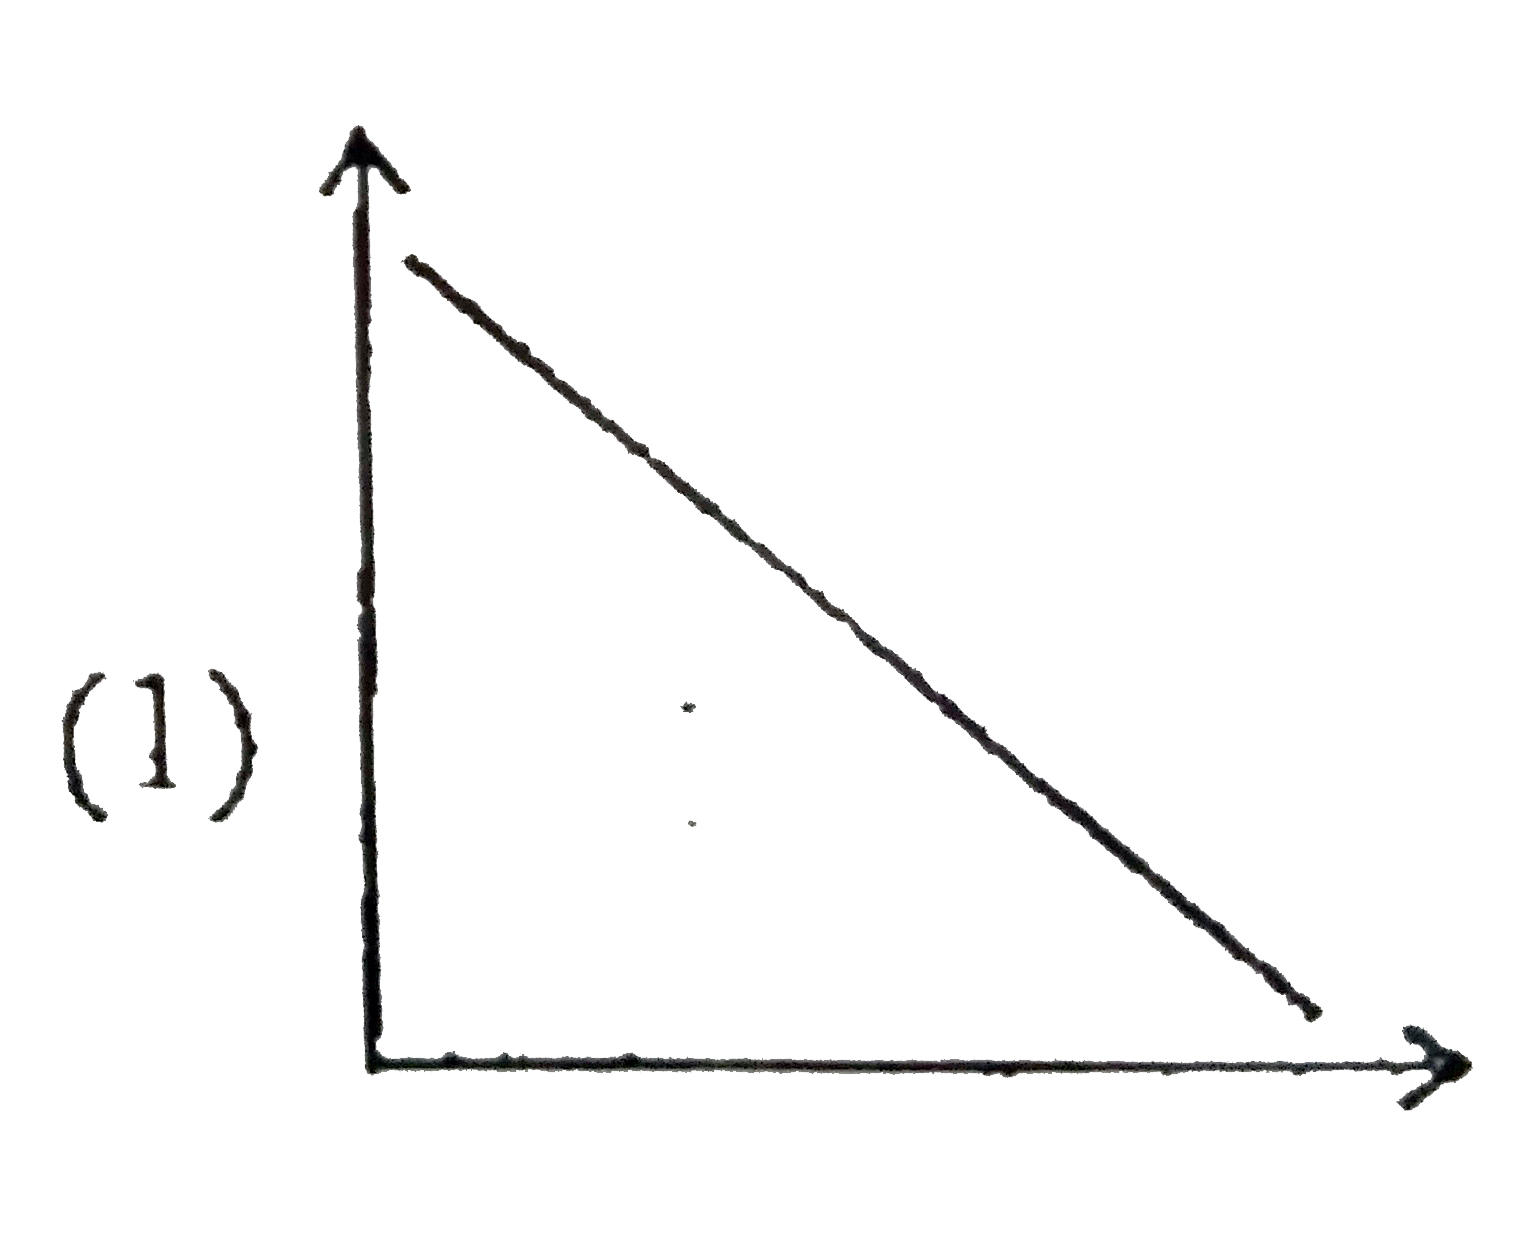 B
B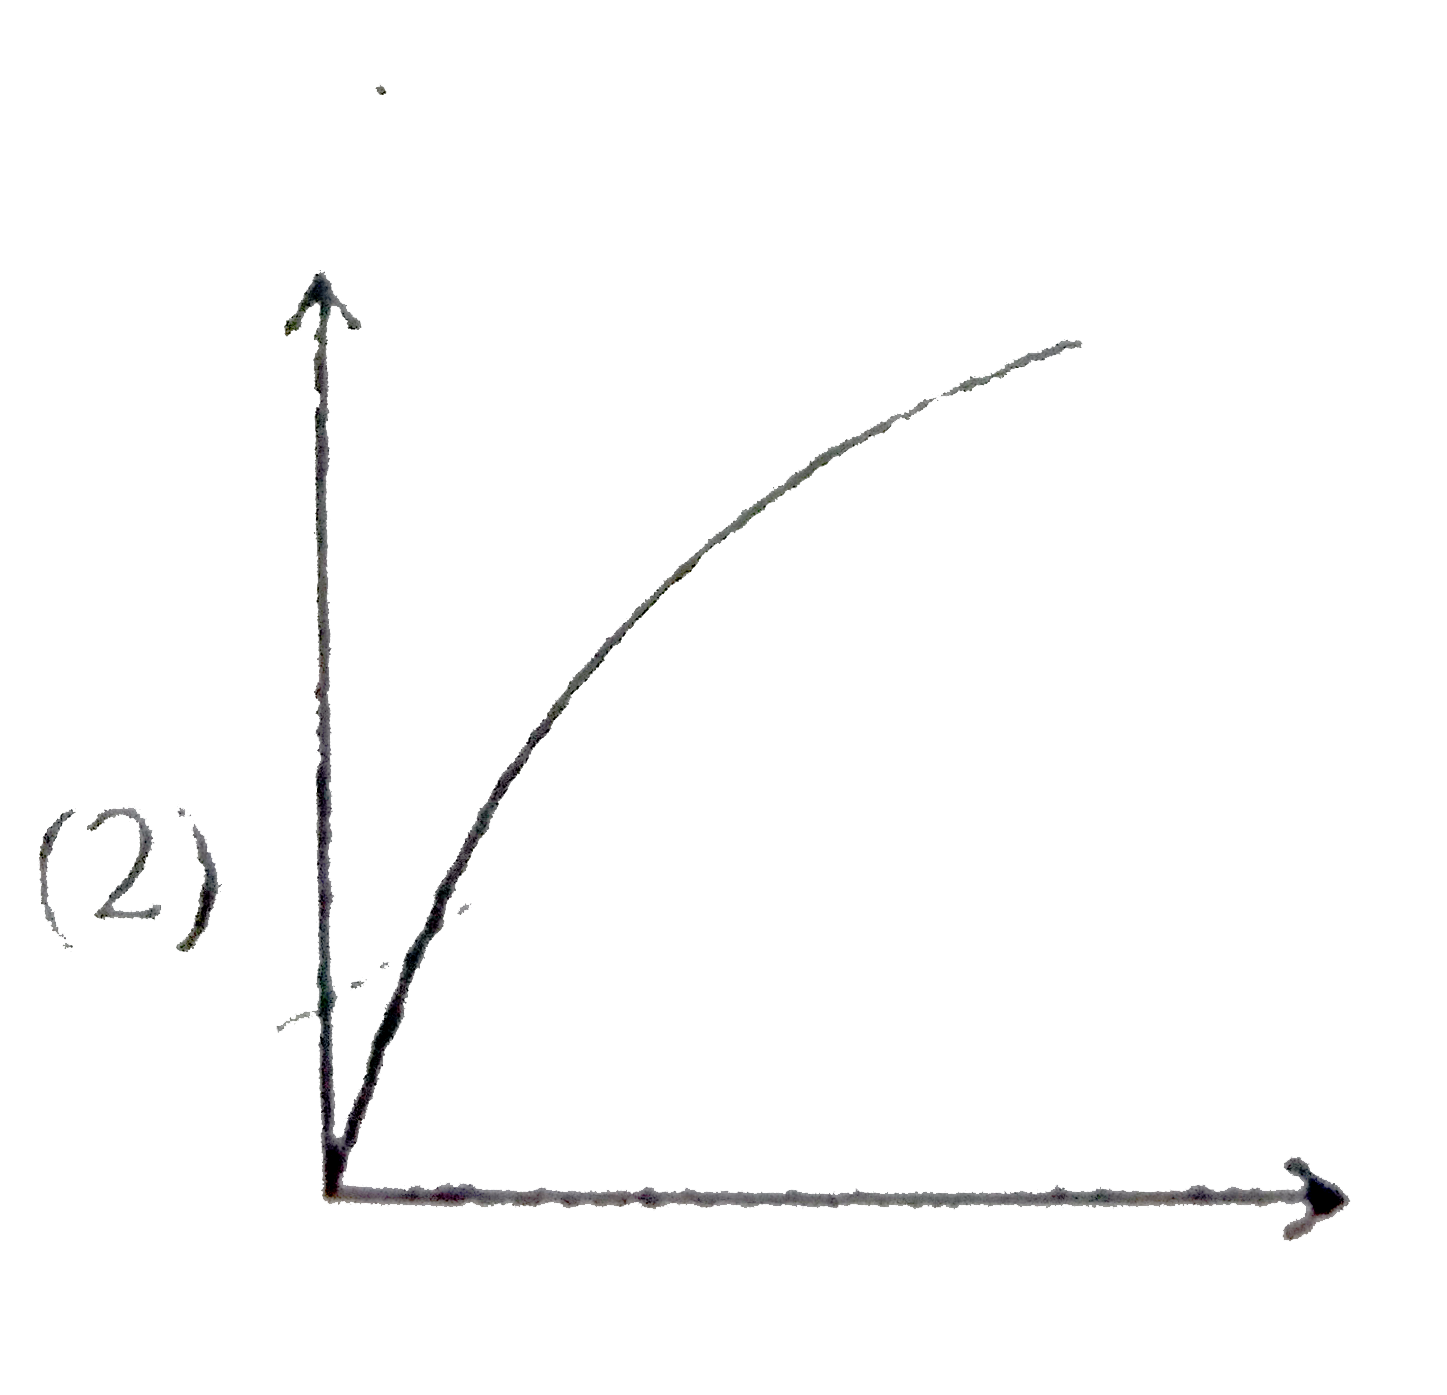 CE01_218_O03.png" width="30%">DE01_218_O04.png" width="30%">
Which of following graphs correctly represent variation of α=−(dV/dP)TV with P for fixed amount of an ideal gas at constant temperature ?
A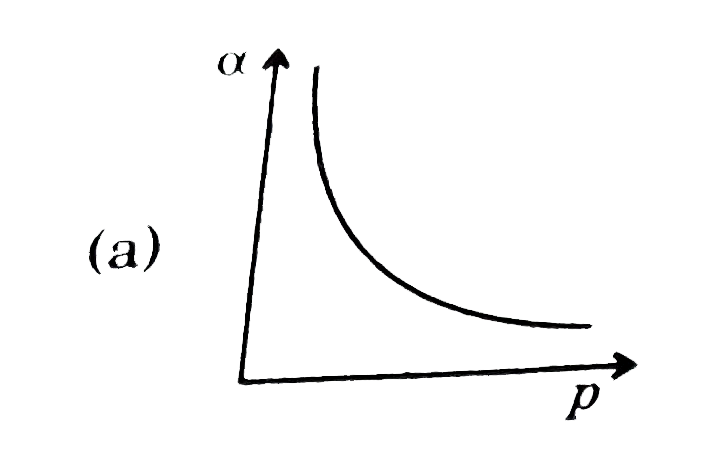 B
B C
C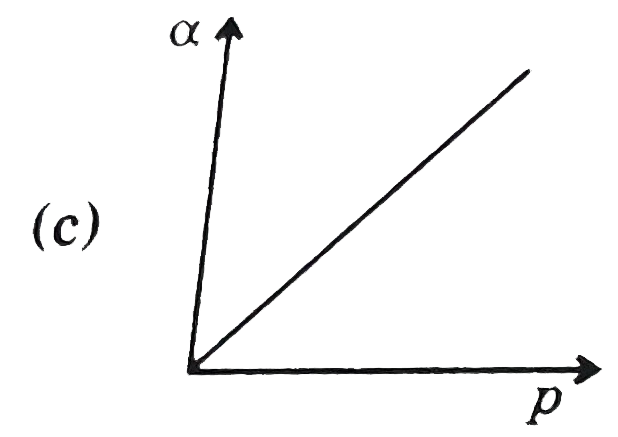 D
D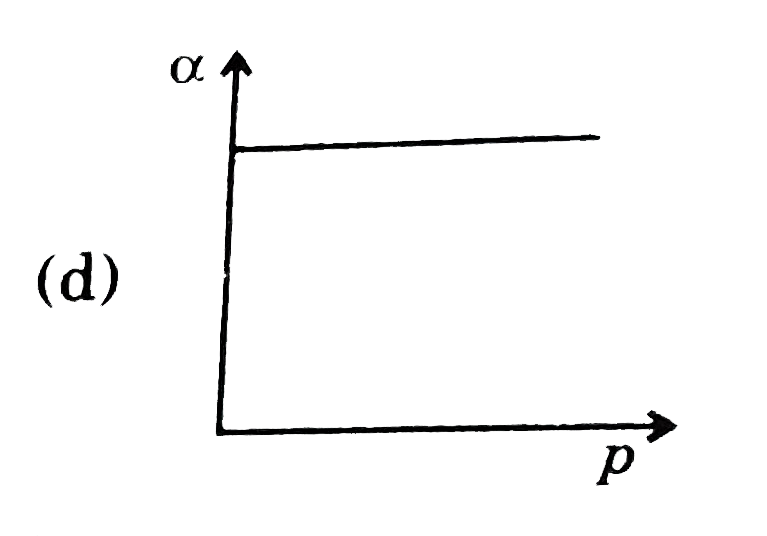
At low pressure, the graph of PVvs1V for a given amount at a constant temperature for a real gas is:
Astraight line parallel to x-axisBstraight line having positive intercept and negative slopeCstraight line passing through origin having positive slopeDnone of the above
Draw a graph of logP and log(1/V) for a fixed amount of gas at constant temperature.
View SolutionDraw a graph of logP and log(1/V) for a fixed amount of gas at constant temperature.
View SolutionFigure shows volume - temperature (V-T) graph for same mass of an ideal gas at two different pressures P1and P2. Hence
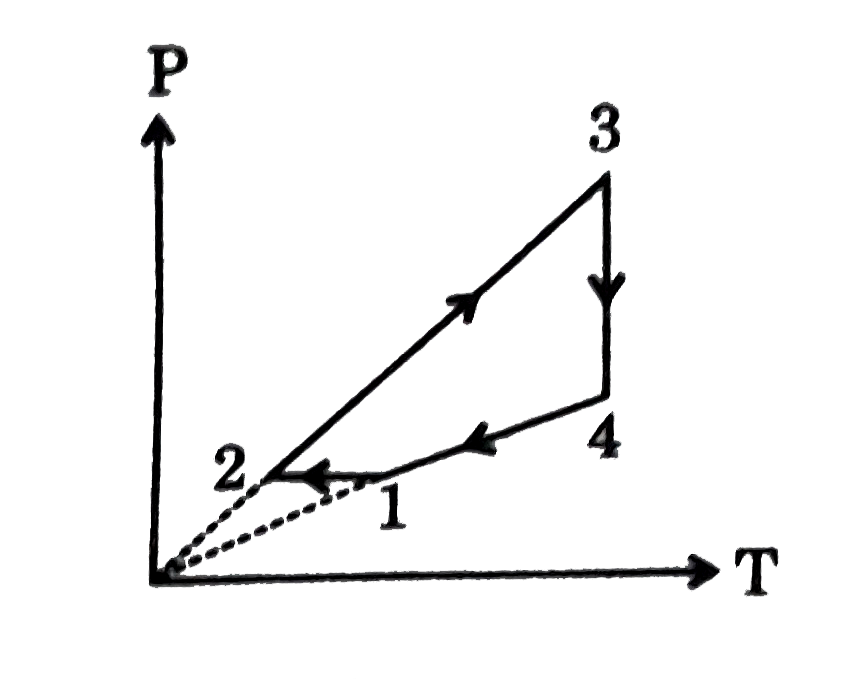
View SolutionConsider the following (P-T) graph for a fixed mass of gas: Correct P-V graph as:
View Solutionwhich of the following graphs correctly represents the vatiation β=−(dVdP)T/V with P for an ideal gas at constant temperature ? .
View Solution
