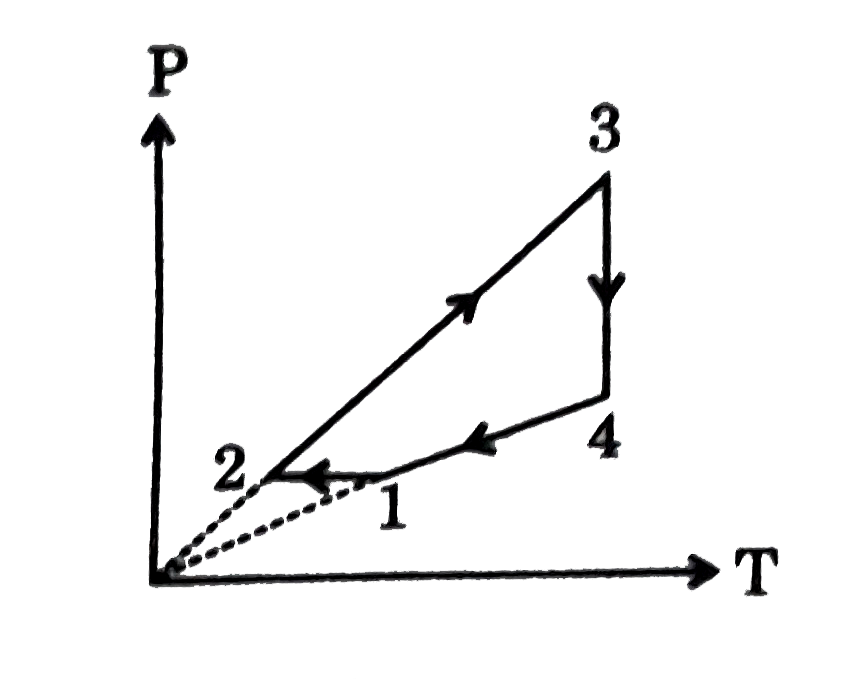
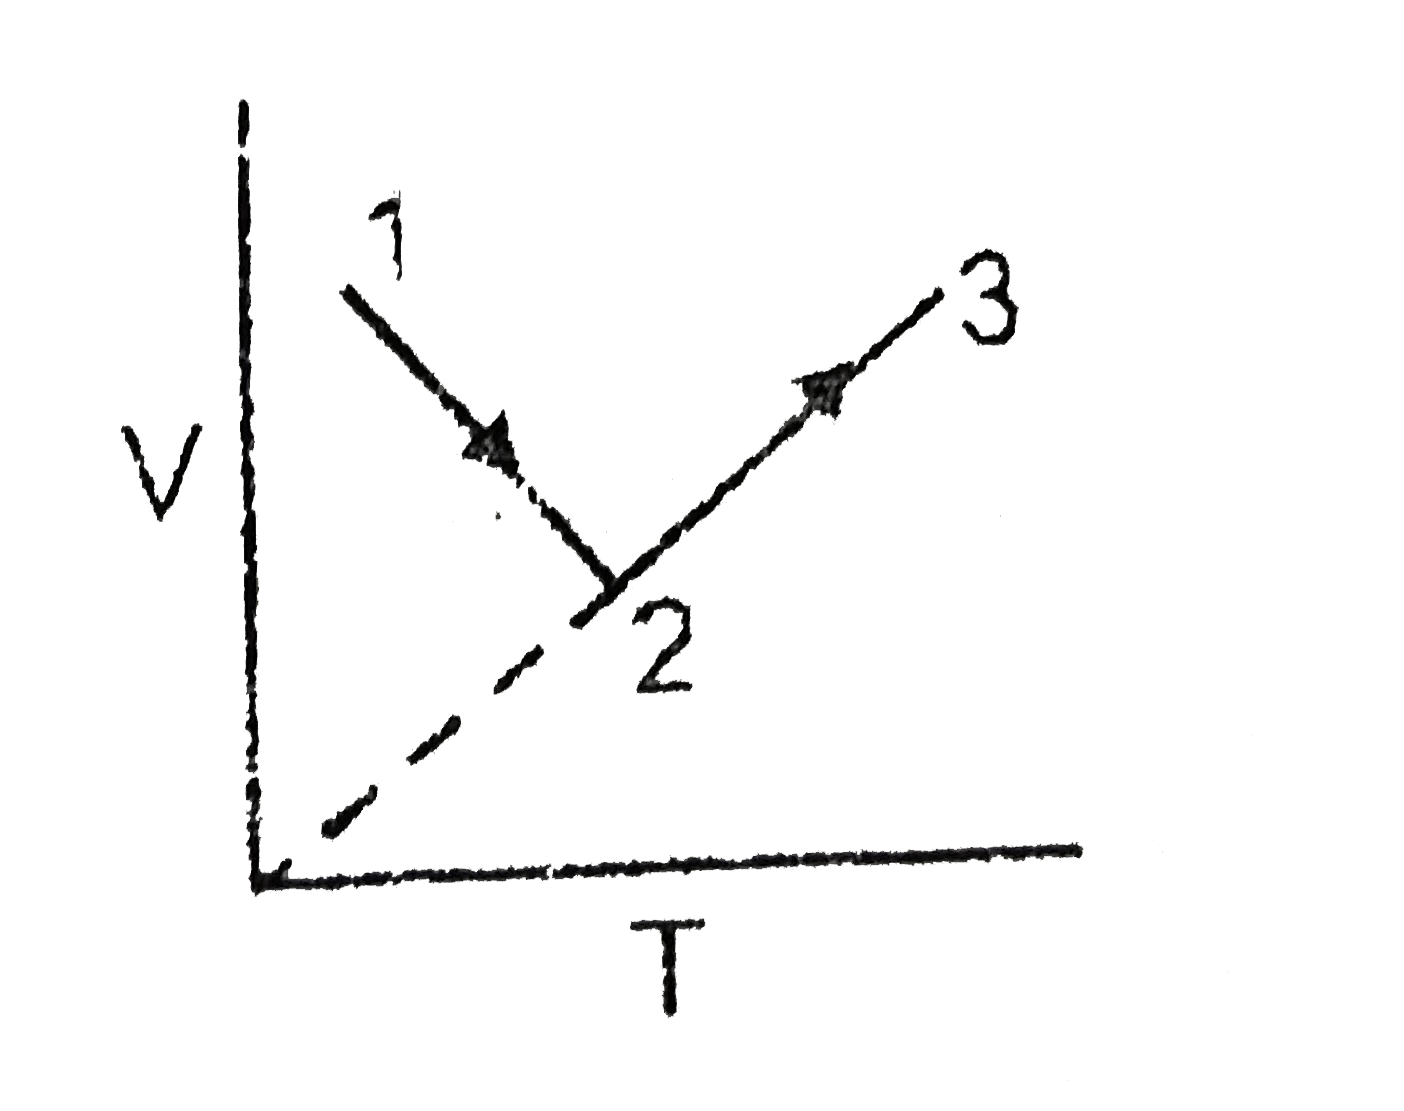
Consider the following (P-T) graph for a fixed mass of gas: Correct P-V graph as:
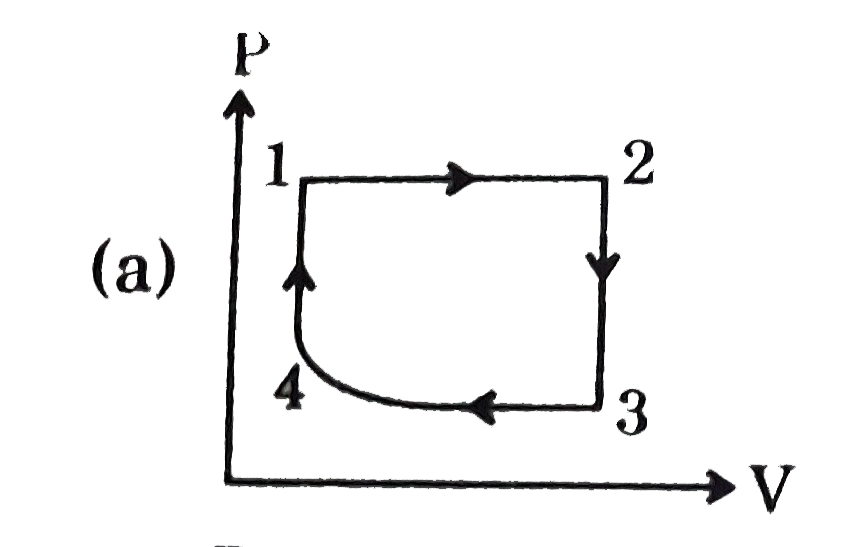
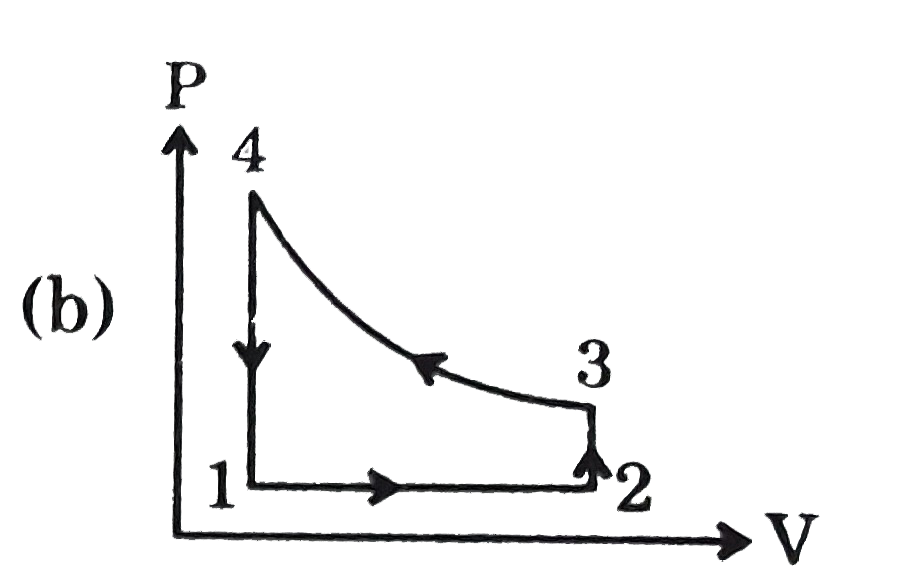
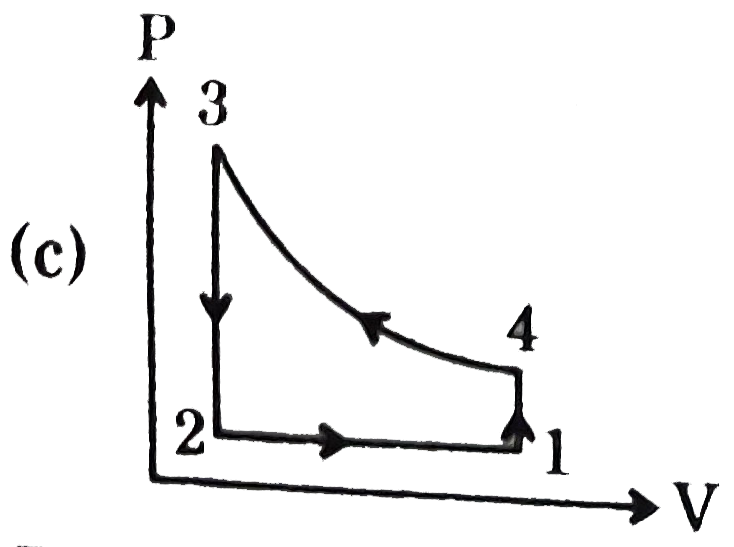
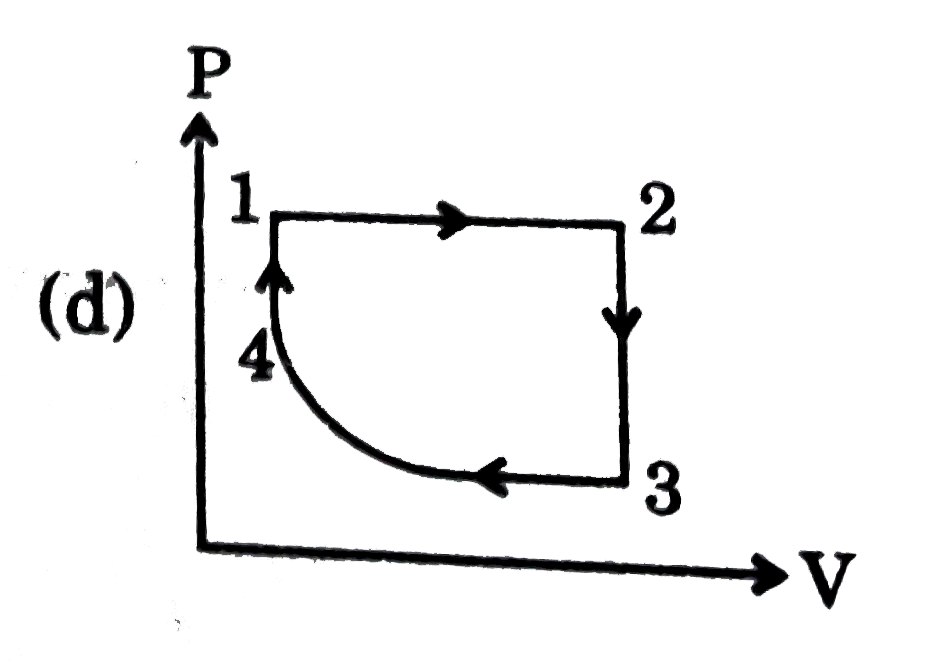
The correct Answer is:C
Step by step video, text & image solution for Consider the following (P-T) graph for a fixed mass of gas: Correct P-V graph as: by Chemistry experts to help you in doubts & scoring excellent marks in Class 12 exams.
Topper's Solved these Questions
- BOOK - GRB PUBLICATIONCHAPTER - GRAPHICAL INTERPRETATIONEXERCISE - C. Atomic Sturcture1videos
GRAPHICAL INTERPRETATION
- BOOK - GRB PUBLICATIONCHAPTER - GRAPHICAL INTERPRETATIONEXERCISE - Atomic Sturcture9videos
GRAPHICAL INTERPRETATION
- BOOK - GRB PUBLICATIONCHAPTER - GRAPHICAL INTERPRETATIONEXERCISE - B. Gaseous State1videos
GRAPHICAL INTERPRETATION
- BOOK - GRB PUBLICATIONCHAPTER - F-BLOCK ELEMENTSEXERCISE - Subjective type7videos
F-BLOCK ELEMENTS
- BOOK - GRB PUBLICATIONCHAPTER - HYDROCARBON (ALIPHATIC)EXERCISE - Previous years jee questions28videos
HYDROCARBON (ALIPHATIC)
Similar Questions
Knowledge Check
- Question 1 - Select One
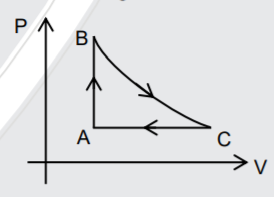
For the given P-V graph for an ideal gas, chose the correct V-T graph. Process BC is adiabatic.
 A
A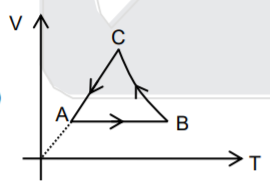 B
B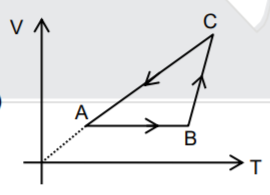 C
C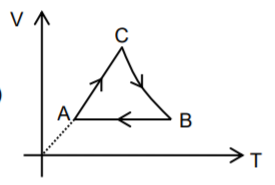 D
D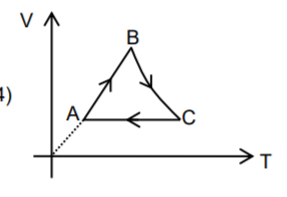
- Question 2 - Select One
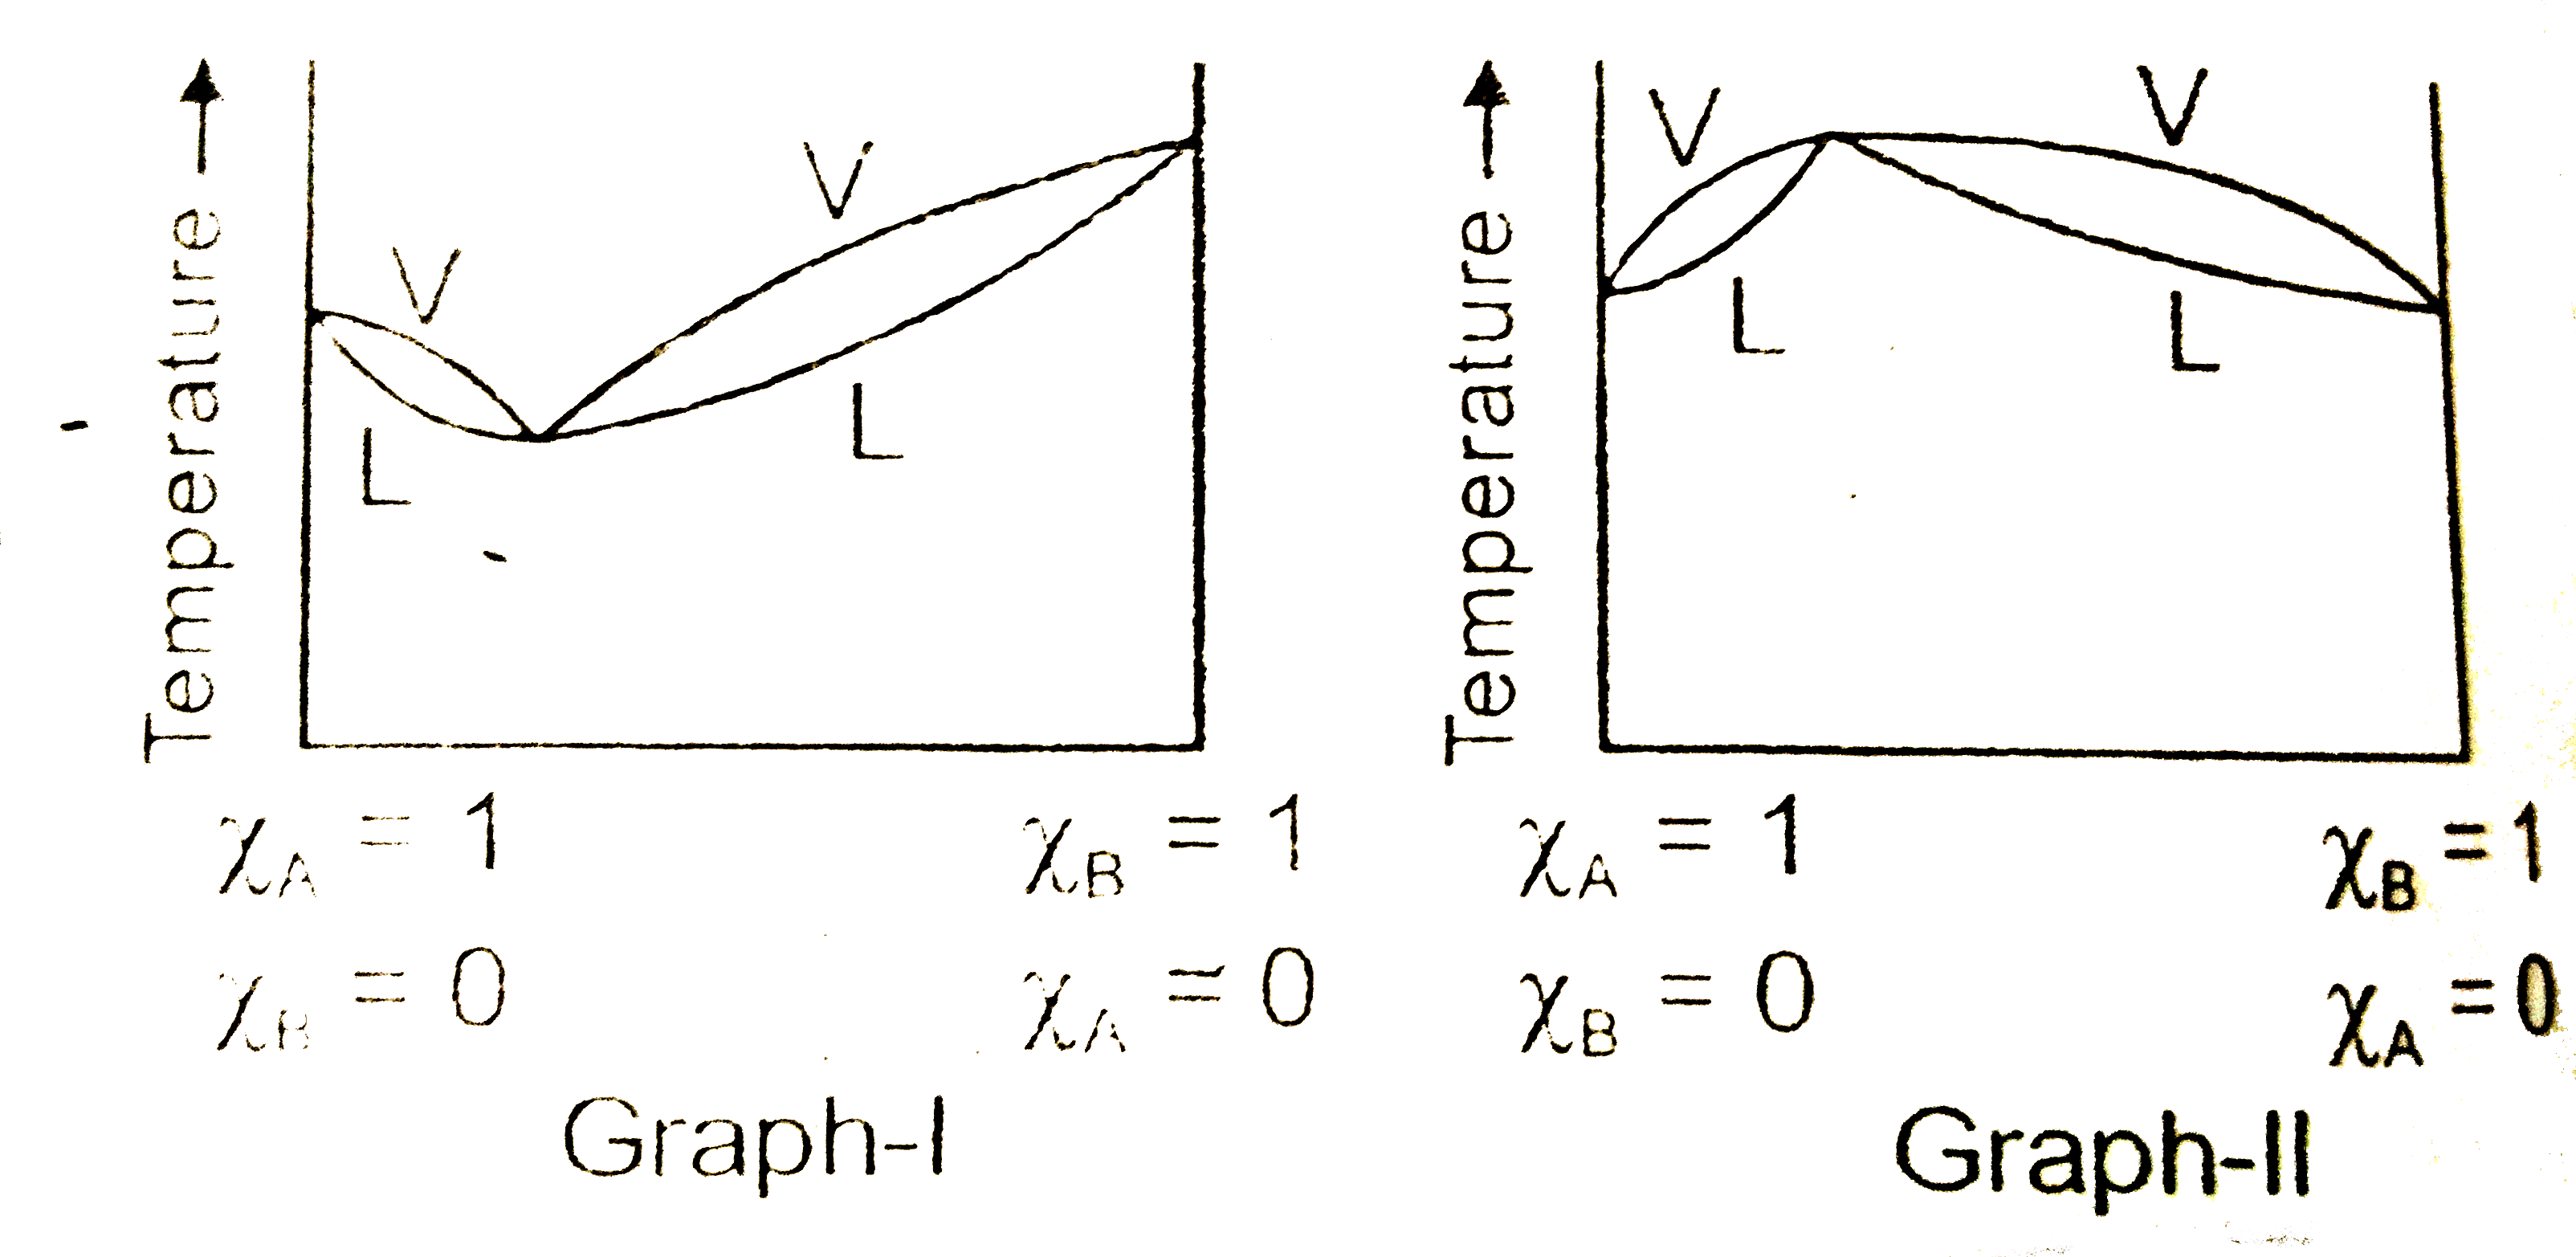
Consider the following graphs
 Choose the correct statementsAAccording to both graphs mole fraction of A > mole fraction of B in condensateBGraph I belogs to minimum boiling azotropeCGraph II belongs to maximum boiling azetropeDGraph II belogs to mininum boiling azeotrope while graph I bellngs to minimum boiling azeotrope.
 - Question 3 - Select One or More
Which of the following graph is parabolic for fixed mass of an ideal gas at constant temperature in closed container ?
A1V2 us PBPV us PCPV us VDPV us log V
Which of the following graph between (x/m) vs P is correct?
View SolutionThe slope of T−P graph for a given mass of a gas increases, the volumn of the gas
View SolutionFollowing graph is constucted for the fixed amount of the gas
 View Solution
On the P−T graph of an ideal gas, choose the correct option(s):
View SolutionWhen a sample of ideal gas is changed from an initial state to a final state, various curves can be plotted for the process like P-V curve, V-T curve,P-T curve etc.
For example, P-V curve for a fixed amount of an ideal gas at constant temperature is a rectangular hyperbola, V-T curve for a fixed amount of an ideal gas at constant volume is again a straight line. However, the shapes may vary if the constant parameters are also changed.
Now, answer the following questions :
Which of the following graphs is not possible for a fixed amount of ideal gas upon moving from initial state A to final state B :View Solution


